F-1/A: Registration statement for securities of certain foreign private issuers
Published on February 4, 2025
Table of Contents
As filed with the United States Securities and Exchange Commission on February 4, 2025.
Registration No. 333-284251
UNITED STATES
SECURITIES AND EXCHANGE COMMISSION
Washington, D.C. 20549
Amendment No. 3
to
FORM F-1
REGISTRATION STATEMENT
UNDER
THE SECURITIES ACT OF 1933
TITAN AMERICA SA
(Exact name of registrant as specified in its charter)
| Belgium | 1400 | Not applicable | ||
| (State or other jurisdiction of incorporation or organization) |
(Primary Standard Industrial Classification Code Number) |
(I.R.S. Employer Identification No.) |
1000 Bruxelles,
Square de Meeûs 37, Belgium
+32 27 26 80 58
(Address, including zip code, and telephone number, including area code, of registrants principal executive offices)
John Christy
5700 Lake Wright Drive, Suite 300
Norfolk, VA 23502
(757) 858-6500
(Name, address, including zip code, and telephone number, including area code, of agent for service)
Copies to:
| Jeffrey D. Karpf Lillian Tsu Cleary Gottlieb Steen & Hamilton LLP One Liberty Plaza New York, NY 10006 (212) 225-2000 |
Erika L. Weinberg Benjamin J. Cohen Latham & Watkins LLP 1271 Avenue of the Americas New York, NY 10020 (212) 906-1200 |
Dirk Meeus Sophie Rutten Allen Overy Shearman Sterling (Belgium) LLP Tervurenlaan 268A Avenue de Tervueren 1150 +32 2 780 2222 |
Philippe Remels Olivier Van Wouwe NautaDutilh BV Terhulpsesteenweg 120 Chaussée de la Hulpe 120 1000 Brussels, Belgium +32 2 566 80 00 |
Approximate date of commencement of proposed sale to the public: As soon as practicable after the effective date of this registration statement.
If any of the securities being registered on this Form are to be offered on a delayed or continuous basis pursuant to Rule 415 under the Securities Act of 1933, check the following box. ☐
If this Form is filed to register additional securities for an offering pursuant to Rule 462(b) under the Securities Act, check the following box and list the Securities Act registration statement number of the earlier effective registration statement for the same offering. ☐
If this Form is a post-effective amendment filed pursuant to Rule 462(c) under the Securities Act, check the following box and list the Securities Act registration statement number of the earlier effective registration statement for the same offering. ☐
If this Form is a post-effective amendment filed pursuant to Rule 462(d) under the Securities Act, check the following box and list the Securities Act registration statement number of the earlier effective registration statement for the same offering. ☐
Indicate by check mark whether the registrant is an emerging growth company as defined in Rule 405 of the Securities Act of 1933.
Emerging Growth Company ☐
If an emerging growth company that prepares its financial statements in accordance with U.S. GAAP, indicate by check mark if the registrant has elected not to use the extended transition period for complying with any new or revised financial accounting standards provided pursuant to Section 7(a)(2)(B) of the Securities Act. ☐
| | The term new or revised financial accounting standard refers to any updated issued by the Financial Accounting Standards Board to its Accounting Standards Codification after April 5, 2012. |
The Registrant hereby amends this Registration Statement on such date or dates as may be necessary to delay its effective date until the Registrant shall file a further amendment which specifically states that this Registration Statement shall thereafter become effective in accordance with Section 8(a) of the Securities Act of 1933, as amended, or until the Registration Statement shall become effective on such date as the Securities and Exchange Commission, acting pursuant to said Section 8(a), may determine.
Table of Contents
The information in this preliminary prospectus is not complete and may be changed. The selling shareholder may not sell these securities until the registration statement filed with the Securities and Exchange Commission of which the preliminary prospectus forms a part is effective. This preliminary prospectus is not an offer to sell these securities, and it is not soliciting an offer to buy these securities in any jurisdiction where the offer or sale is not permitted.
SUBJECT TO COMPLETION, DATED FEBRUARY 4, 2025
PRELIMINARY PROSPECTUS

24,000,000 Shares
Titan America SA
Common Shares
This is an initial public offering of the common shares, no nominal value per share (common shares), of Titan America SA (TASA). We are offering 9,000,000 common shares. Titan Cement International SA, (the selling shareholder), is offering 15,000,000 common shares. We will not receive any of the proceeds from the common shares sold by the selling shareholder in this offering.
We expect the initial public offering price will be between $15.00 and $18.00 per common share. Currently, no public market exists for our common shares. We have applied to have our common shares listed on the New York Stock Exchange (NYSE) under the symbol TTAM.
The selling shareholder has granted the underwriters an option for a period of 30 days after the date of this prospectus to purchase up to an additional 3,600,000 common shares from the selling shareholder at the initial public offering price less the underwriting discounts and commissions.
Upon completion of this offering, the selling shareholder will hold approximately 87% of the voting rights of our outstanding share capital immediately, assuming no exercise of the underwriters option to purchase additional common shares. As a result, we will be a controlled company as defined under the NYSE corporate governance requirements. See Risk Factors and ManagementCorporate GovernanceDirector Independence and Controlled Company Exception for additional information.
We are a foreign private issuer under applicable Securities and Exchange Commission rules, and as a result, will be subject to reduced public company reporting requirements for this prospectus and future filings with the Securities and Exchange Commission.
Our business and an investment in our common shares involve significant risks. You should carefully consider the risks that are described under the caption Risk Factors beginning on page 32 of this prospectus before making a decision to invest in our common shares.
Neither the Securities and Exchange Commission nor any state securities commission has approved or disapproved of these securities or passed upon the accuracy or adequacy of this prospectus. Any representation to the contrary is a criminal offense.
| Per Share |
Total | |||||||
| Initial public offering price |
||||||||
| Underwriting discounts and commissions(1) |
||||||||
| Proceeds, before expenses, to us |
||||||||
| Proceeds, before expenses, to the selling shareholder |
||||||||
| (1) | See Underwriting for additional information regarding total underwriter compensation. |
The underwriters expect to deliver our common shares to purchasers against payment on or about , 2025.
Joint Book-Running Managers
(*in alphabetical order)
| Citigroup* | Goldman Sachs & Co. LLC* |
Bookrunners
| BofA Securities | BNP PARIBAS | Jefferies | HSBC | SOCIETE GENERALE | Stifel |
, 2025
Table of Contents
| 1 | ||||
| 1 | ||||
| 1 | ||||
| 1 | ||||
| 2 | ||||
| 3 | ||||
| 32 | ||||
| 69 | ||||
| 71 | ||||
| 72 | ||||
| 73 | ||||
| 75 | ||||
| MANAGEMENTS DISCUSSION AND ANALYSIS OF FINANCIAL CONDITION AND RESULTS OF OPERATIONS |
77 | |||
| 117 | ||||
| 128 | ||||
| 175 | ||||
| 184 | ||||
| 188 | ||||
| 192 | ||||
| 194 | ||||
| 207 | ||||
| 208 | ||||
| 214 | ||||
| 217 | ||||
| 223 | ||||
| 224 | ||||
| 225 | ||||
| 226 | ||||
| F-1 |
Through and including the 25th day after the date of this prospectus, all dealers that effect transactions in our common shares, whether or not participating in this offering, may be required to deliver a prospectus. This is in addition to the dealers obligations to deliver a prospectus when acting as underwriters and with respect to their unsold allotments or subscriptions.
Neither we, the selling shareholder nor any of the underwriters have authorized anyone to provide you with any information other than that contained in this prospectus or in any free writing prospectus prepared by or on behalf of us or to which we may have referred you. We, the selling shareholder and the underwriters take no responsibility for, and can provide no assurance as to the reliability of, any other information that others may give you. Neither we, the selling shareholder nor any of the underwriters are making an offer to sell the common shares in any jurisdiction where the offer or sale is not permitted. This offering is being made in the United States and elsewhere solely on the basis of the information contained in this prospectus. You should assume that the information appearing in this prospectus is accurate only as of the date on the front cover of this prospectus, regardless of the time of delivery of this prospectus or any sale of the common shares. Our business, financial condition, results of operations and prospects may have changed since the date on the front cover of this prospectus.
Table of Contents
Unless otherwise indicated or unless the context otherwise requires, (a) all references in this prospectus to the Company, Titan America, we, us, our or similar terms refer to Titan America SA and its subsidiaries, following the contribution of Titan Atlantic Cement Industrial and Commercial S.A. (Titan Atlantic) to Titan America SA (the Contribution) in connection with the Reorganization Transactions (as defined below), (b) all references to TASA refer to Titan America SA and not its subsidiaries and (c) all references to Titan Cement International and our Parent refer to Titan Cement International SA, Titan Americas ultimate parent, and its consolidated subsidiaries other than Titan America and Titan Americas subsidiaries. All references to shares or common shares in this prospectus refer to the common shares of Titan America SA, no nominal value per share. Unless otherwise indicated, all references to tons in this prospectus refer to short tons. In connection with the completion of this offering, we will complete certain reorganization transactions and related transactions with Titan Cement International, as more fully described under Prospectus SummaryThe Reorganization Transactions (the Reorganization Transactions). Unless otherwise stated or the context otherwise requires, all information in this prospectus reflects the completion of the Reorganization Transactions and this offering. In addition, after the Contribution, on January 1, 2025 Titan America LLC divested its wholly-owned subsidiaries, ST Equipment & Technology LLC and ST Equipment & Technology Trading Company LLC (collectively, the STET segment) in a sale for cash, to be settled no later than January 31, 2025, to Titan Cement Netherlands B.V., a wholly-owned subsidiary of Titan Cement International, which is outside the scope of this offering. The STET segment is a nonreportable operating segment included in the Companys historical financial results.
The data included in this prospectus regarding markets and the industry in which we operate, including the size of certain markets and our position and the position of our competitors within these markets, are based on reports of government agencies, independent industry sources such as Dodge Construction Network, an independent business analysis and consultancy group focused on the commercial construction sector, the Portland Cement Association, a non-governmental cement industry association, Cement Products Magazine, an independent industry publication, and other research consultants, as well as our own estimates relying on our managements knowledge and experience in the markets in which we operate. Our managements knowledge and experience is based on information obtained from our customers, distributors, suppliers, trade and business organizations and other contacts in the markets in which we operate. We believe these estimates to be accurate as of the date of this prospectus. However, the assumptions and estimates of our and our industrys future performance are necessarily subject to a high degree of uncertainty and risk due to a variety of factors, including those described in Risk Factors. These and other factors could cause future performance to differ materially from our assumptions and estimates and those of independent third parties. See Special Note Regarding Forward-Looking Statements. While we believe our internal research is reliable and the definitions of our market and industry are appropriate, neither such research nor these definitions have been verified by any independent source.
TRADEMARKS, TRADE NAMES AND SERVICE MARKS
We own or have rights to trademarks, trade names or service marks that we use in connection with the operation of our business. Solely for convenience, the trademarks, trade names and service marks referred to in this prospectus are listed without the ® and TM symbols, but we will assert, to the fullest extent under applicable law, our rights or the rights of the applicable licensors to these trademarks, trade names and service marks.
PRESENTATION OF FINANCIAL INFORMATION
This prospectus includes financial information which has been derived from TASAs audited consolidated financial statements as of December 31, 2023 and 2022 and for the years ended December 31, 2023, 2022 and
1
Table of Contents
2021, TASAs unaudited interim condensed consolidated interim financial statements as of September 30, 2024 and for the nine months ended September 30, 2024 and 2023, and the related notes, which are collectively referred to as consolidated financial statements or financial statements, and can be found beginning on page F-1 of this prospectus.
We maintain our books and records in U.S. dollars. We prepare our audited consolidated financial statements in accordance with International Financial Reporting Standards (IFRS Accounting Standards) as issued by the International Accounting Standards Board (IFRS). The definition of IFRS also encompasses all valid International Accounting Standards, as well as all interpretations of the International Financial Reporting Interpretations Committee, including those formally issued by the Standing Interpretations Committee. None of the consolidated financial statements in this prospectus were prepared in accordance with accounting principles generally accepted in the United States (U.S. GAAP). In this prospectus, unless otherwise specified, all monetary amounts are in U.S. dollars and all references to $ mean U.S. dollars.
We have made rounding adjustments to some of the figures included in this prospectus. Accordingly, numerical figures shown as totals in some tables may not be an arithmetic aggregation of the figures that precede them.
We have historically conducted our business through Titan America LLC (a wholly-owned subsidiary of Titan Atlantic) and Titan America LLCs subsidiaries. Titan America SA has not commenced operations and has nominal assets and liabilities. Upon completion of the Reorganization Transactions prior to the completion of this offering, Titan Atlantic will become a subsidiary of Titan America SA. Our financial statements present the historical financial position and results of operations of Titan Atlantic and its consolidated subsidiaries, including Titan America LLC and its subsidiaries.
We refer to the terms Adjusted EBITDA, Free Cash Flow, Net Debt and Ratio of Net Debt to Adjusted EBITDA in various places in this prospectus. These are supplemental financial measures that are not prepared in accordance with IFRS and should not be viewed as a substitute for IFRS measures. Although our management uses these non-IFRS financial measures when planning, monitoring and evaluating our performance, any analysis of non-IFRS financial measures should be used only in conjunction with results presented in accordance with IFRS. The non-IFRS financial measures we present may not be comparable to similarly-named measures reported by other companies.
We define Adjusted EBITDA as net income before finance cost, net, income tax expense, depreciation, depletion and amortization, further adjusted to remove the impact of additional items such as (gain)/loss on disposal of fixed assets, asset impairment (recovery)/loss, foreign exchange (gain)/loss, net, derivative financial instrument (gain)/loss, net, fair value loss on sale of accounts receivable, net, share-based compensation and other non-recurring items, including certain IPO transaction costs associated with this offering. Net income is the IFRS measure most directly comparable to Adjusted EBITDA.
Free Cash Flow is comprised of net cash provided by operating activities, less net payments for capital expenditures, which includes (i) investments in equipment, (ii) investments in identifiable intangible assets and (iii) proceeds from the sale of assets, net of disposition costs. The IFRS measure most directly comparable to Free Cash Flow is net cash provided by operating activities.
Net Debt comprises the sum of short and long-term borrowings, including accrued interest and current and non-current lease liabilities less cash and cash equivalents. Net Debt is used by management to measure the effective level of our indebtedness.
We define the Ratio of Net Debt to Adjusted EBITDA as the ratio derived by dividing Net Debt by Adjusted EBITDA.
2
Table of Contents
Company Introduction
Titan America is a leading vertically integrated, multi-regional manufacturer and supplier of heavy building materials and services operating primarily on the Eastern Seaboard of the United States (the Eastern Seaboard). We are a leading provider of materials that contribute to lower carbon emissions than traditional building materials and/or beneficial reuse of waste materials. We are a leading provider of heavy building materials in Florida, the New York and New Jersey Metropolitan area (Metro New York), Virginia, North Carolina and South Carolina (Virginia and the Carolinas, together with Metro New York and their adjacent areas, the Mid-Atlantic). We serve markets that benefit from population growth, economic growth and technology and innovation trends that are among the strongest in the United States.
We have built what we believe is a unique and differentiated building materials platform in the markets we serve. Today, our manufacturing, logistics and customer support capabilities span across critical building materials and products, including cement and supplementary cementitious materials (SCMs), aggregates, ready-mix concrete, concrete block and other ancillary products. Additionally, we believe that our market leadership in lower carbon cement and green concrete solutions positions us to benefit from growing demand for building materials that contribute to lower carbon emissions. We believe our vertically integrated business model and continued investment in our extensive logistical capabilities have enabled us to grow with our diverse customer base across infrastructure, residential and non-residential end markets. By leveraging these competitive advantages across our two reportable segments, the Mid-Atlantic and Florida, we believe that we are in a strong position to drive meaningful growth and enhanced profitability into the future.
Our executive management team has led Titan America to experience growth in scale, product portfolio and geographic footprint. This growth was driven by our management teams targeted investment strategy, which has enhanced production capacity and strengthened distribution and logistics capabilities in high-growth markets. These efforts include expanding cement and SCM storage, scaling import capacity and leveraging digital investments to optimize logistics execution and boost asset reliability across our vertically integrated operations. Between fiscal years 2013 and 2023, we have grown our sales from $539 million to approximately $1.6 billion (an 11% compound annual growth rate (CAGR)), our net income went from a loss of $65.4 million to a positive $155.2 million and our Adjusted EBITDA increased from $36 million to $328 million (a 25% CAGR), while our net income margin has grown from negative 12% to positive 10% during that same period.
As a result of our continuous investment program to modernize and scale our operations, we have experienced 50% revenue growth, 150% net income growth and 65% Adjusted EBITDA growth from fiscal 2019 to fiscal 2023. Additionally, we have reduced our cement operations CO2 emissions per metric ton of cementitious materials by 18%, from 718 kg of net CO2 per metric ton in 2019 to 587 kg of net CO2 per metric ton in 2023.
Our scaled, vertically integrated network of more than 100 facilities includes some of the largest cement plants, import terminals, mines, ready-mix concrete plants, fly ash processing plants and concrete block production lines in our core markets. Our cement plants are capable of producing approximately 3.8 million tons of cement annually, over 95% of which contains up to 10% lower CO2 emissions than standard use ordinary Portland cement (Lower-Carbon Cement). Our cement manufacturing activities are supported by a network of mining operations containing a total of 474 million tons of reserves as of May 1, 2024, which we are in the process of expanding through various opportunities.
3
Table of Contents
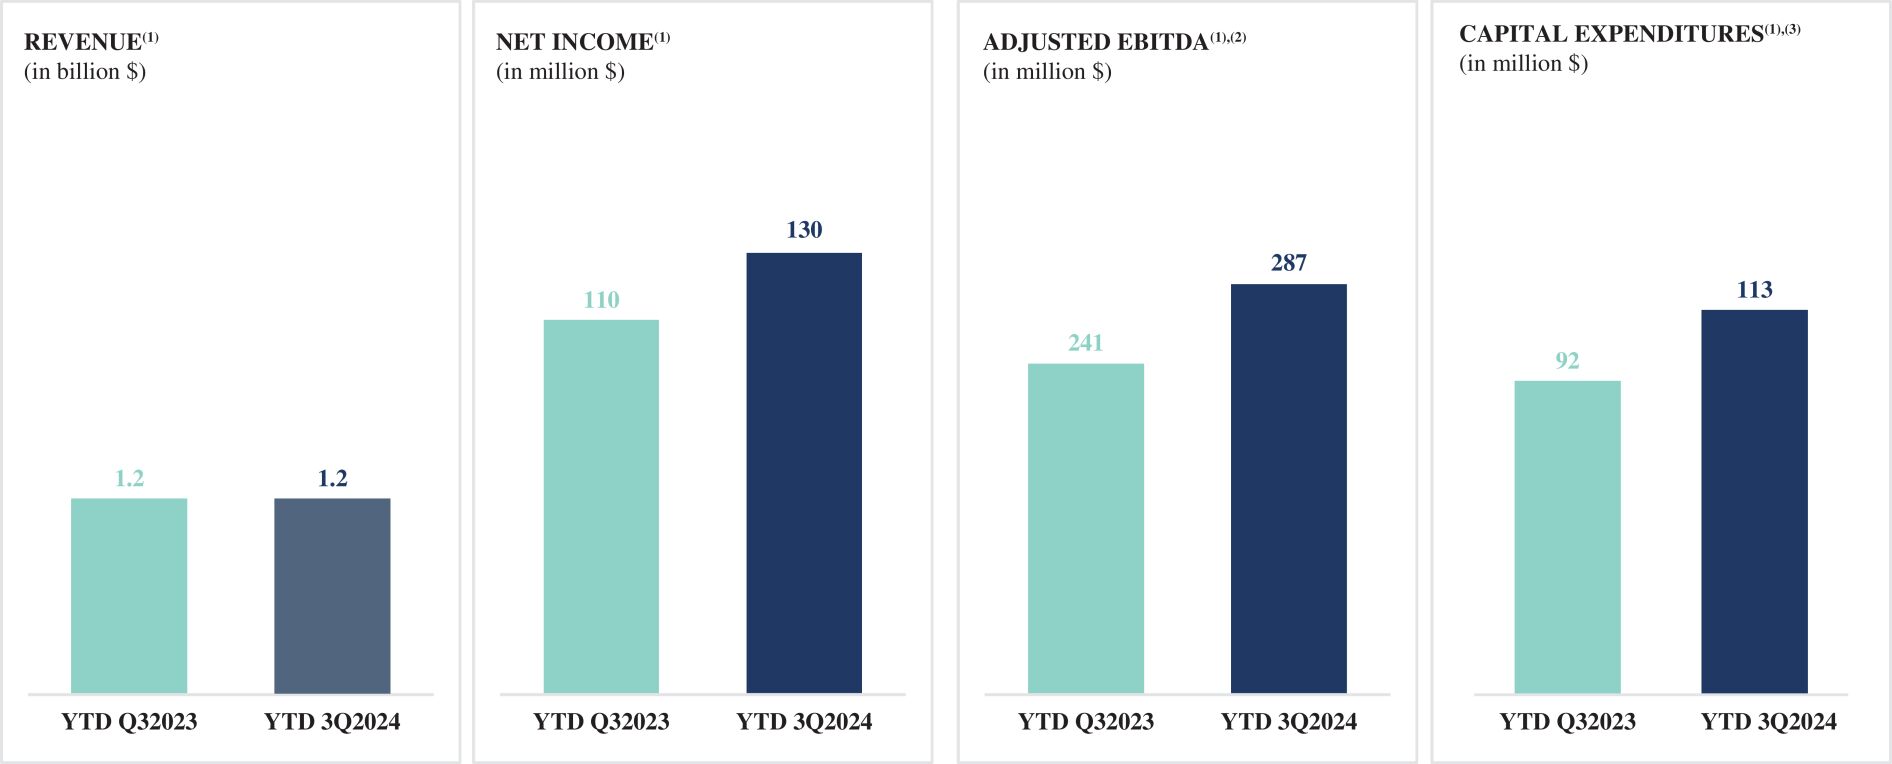
The following charts present a summary of revenue, net income, Adjusted EBITDA(1)(2) and Capital Expenditures(1)(3) for the fiscal years ended December 31, 2023, 2022 and 2021 and the nine months ended September 30, 2024 and 2023:
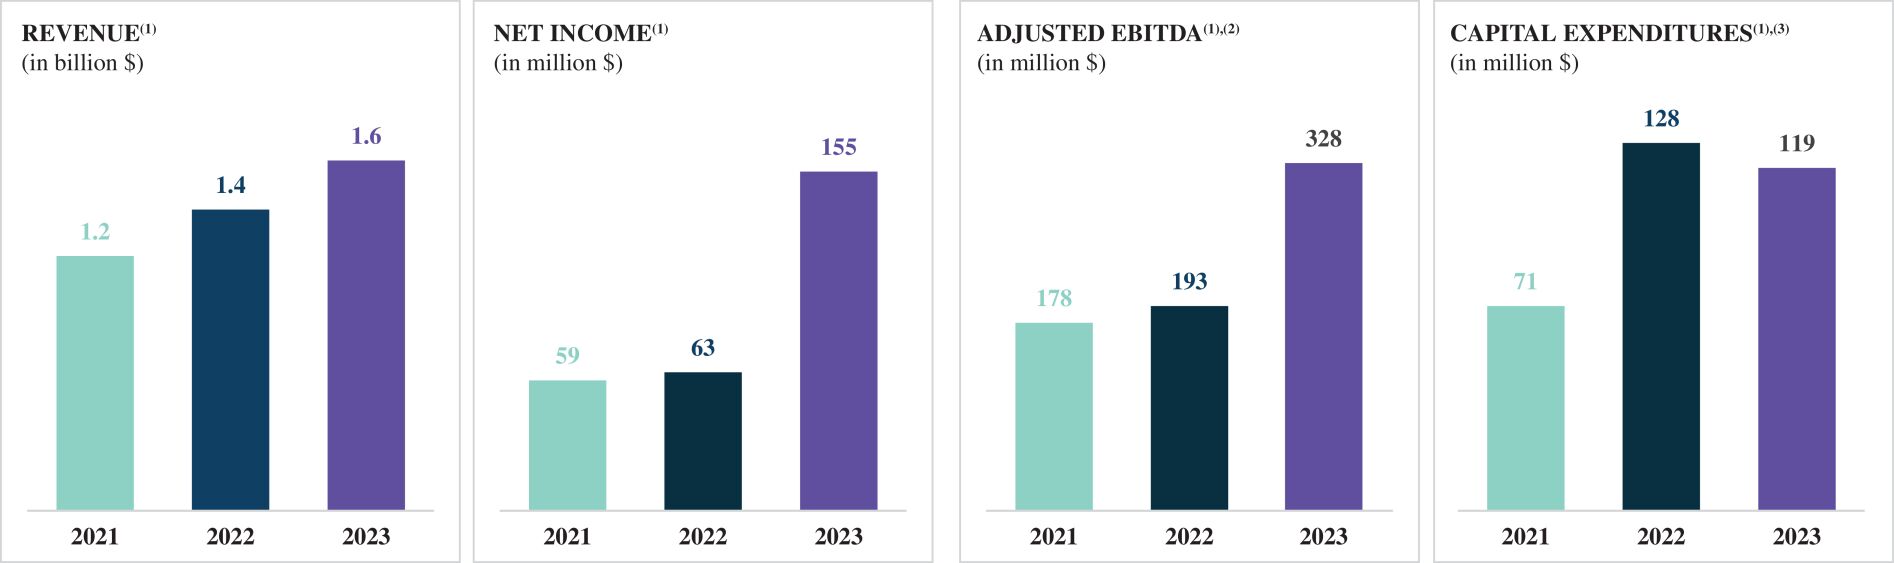
| (1) | After the Contribution of Titan Atlantic to Titan America SA, on January 1, 2025, Titan America LLC divested its STET segment in a sale for cash, to be settled no later than January 31, 2025, to Titan Cement Netherlands B.V., a wholly-owned subsidiary of Titan Cement International, which is outside the scope of this offering. |
| (2) | Adjusted EBITDA is a non-IFRS financial measure we use to evaluate the performance of our business. For the definition of this measure, see Managements Discussion and Analysis of Financial Condition and Results of OperationsNon-IFRS Measures. |
| (3) | Capital Expenditures includes investments in property, plant and equipment and investments in identifiable intangible assets. |
In the fiscal year ended December 31, 2023, Titan America delivered $1.6 billion of revenue, net income of $155.2 million and Adjusted EBITDA of $328.4 million. In the nine months ended September 30, 2024, Titan America delivered $1.2 billion of revenue, net income of $129.5 million and Adjusted EBITDA of $286.9 million. Titan America also delivered 6% of revenue growth for the last twelve months ended September 30, 2024.
Since our initial investment in the Essex Cement import terminal in Metro New York in 1989, we believe we have built one of the most comprehensive, capable and reliable building materials platforms on the Eastern Seaboard through focused and strategic investments.
In 1992, we acquired 59% of Roanoke Cement Company and all its related assets, establishing our domestic manufacturing and regional distribution capabilities in the Mid-Atlantic region through the addition of the Roanoke cement plant in Troutville, Virginia (our Roanoke Plant), a marine import terminal in South Norfolk, Virginia (our Norfolk Terminal) and a rail-connected distribution network in Virginia and North Carolina.
4
Table of Contents
Between 1996 and 2002, we invested $110 million in our Roanoke Plant, which included a major modernization of its clinker and cement production process, as well as the addition of a preheater/precalciner, a new clinker cooler, new clinker silos, a new finish mill and a new packaged cement line.
In 2000, we acquired Tarmac America Inc., including the remaining 41% of Roanoke Cement Company, giving us initial positions in ready-mix concrete and block operations across the State of Florida, as well as our Pennsuco facility in Medley, Florida (Pennsuco) that produces cement, aggregates, ready-mix concrete and concrete block.
In 2002, we acquired Separation Technologies (ST), a market leader in fly ash beneficiation and marketing.
Throughout the early 2000s, we made significant investments to expand and improve the logistics and import capabilities of the business establishing a cement import terminal at the Port Tampa Bay, Florida (our Port Tampa Bay Terminal), and modernizing the Essex import operation at Port Newark in Metro New York (our Essex Terminal).
Between 2001 and 2006, we invested approximately $254 million in our Pennsuco plant, which included modernization efforts with the commissioning of a state-of-the-art clinker production line, significantly increasing clinker production capacity at much lower energy consumption rates, and the addition of a new finish mill and a new packaging operation.
Between 2006 and 2007, we invested approximately $365 million to significantly expand our ready-mix footprint through the acquisition of the S&W Ready Mix Concrete Company (S&W Ready Mix), which operated 26 concrete plants in the Carolinas, the Mechanicsville Concrete Company and five plants under the Powhatan Ready Mix brand in and around Richmond, Virginia. We also completed acquisitions of three ready-mix businesses on the west coast of Florida, including nine concrete plants located in and between Tampa and Fort Myers. In addition to these acquisitions, we installed 11 greenfield ready-mix concrete plants and one block production line throughout our territory which expanded our geographic footprint and improved density of delivery and manufacturing capacity in growing markets.
In early 2010, we invested in a sand mine in Sussex County, Virginia, followed by commencing our operations in New Castle, Virginia (our Castle Sands Operation) in 2011 and Branchville, Virginia in 2019.
From 2014 to 2023, we invested $53 million in an overland conveyor and two new draglines at the Pennsuco quarry.
In 2017, we entered into a long-term mining royalty agreement and began operating a crushed limestone quarry in Estero, Florida, near Fort Myers. We upgraded the operations by installing a dragline and mobile mining fleet, as well as expanding the existing permit to substantially increase the base of reserves, all of which provide a stable source of aggregates for both external sale and internal consumption.
Between 2018 and 2023, we invested $52 million in modernizing our logistics network in the Mid-Atlantic, including (i) investments in increasing silo storage capacity and installation of an automated loadout system at our Roanoke Plant, (ii) expansion of the Winston-Salem, Charlotte, Selma and Wilmington rail terminals to allow for multiple products, optimized storage and distribution capabilities and (iii) installation of a hybrid loadout system at the Norfolk Terminal capable of loading both trucks and rail cars.
In 2023, we completed a $73 million investment at our Port Tampa Bay Terminal and our Norfolk Terminal, constructing new domes, adding multi-product storage capacity of approximately 70,000 tons each, as well as on other repairs and refurbishments.
5
Table of Contents
Recent investments we have made seek to capitalize on dynamic growth themes in the U.S. economy, including decarbonization, circular economy, resilient urbanization, infrastructure modernization, refurbishment and renovation, new construction technologies and high-performance products. We believe these initiatives contribute to and will act as significant drivers of growth.
We have developed new cement types requiring less carbon intensive inputs that perform equally or better than conventional cements, resulting in lower CO2 content of the final product. We have replaced over 95% of our standard use Ordinary Portland Cement (OPC) production with Lower-Carbon Cement, improving the CO2 emissions per ton of product by up to 10% compared to OPC. We are currently investing in the development of our Type IT cement (a ternary cement blend) that requires even less amount of clinker while delivering equal or better performance than Lower-Carbon Cement. Depending on the type of SCM used (such as fly ash, slag, calcined clay or natural pozzolans) the total reduction in clinker quantity can reach up to 50% compared to OPC cements, resulting in a significant reduction of the CO2 emissions per ton of product.
We are also committed to digital transformation. We are early adopters of artificial intelligence and machine learning (AI/ML) technologies in our industry, which we employ to increase plant reliability and capacity utilization, improve product quality, proactively manage operating and maintenance costs and improve energy efficiency. These initiatives place our cement plants in the top five most efficient in the U.S. cement industry out of companies participating in a 2022 Portland Cement Association (PCA) survey. We created a Digital Center of Excellence in 2022, which has driven digital transformation across our entire supply chain and fostered continuous improvement and fine-tuning of existing industrial AI/ML solutions, as well as the development and implementation of similar solutions in our commercial and logistics activities. Our investments in state-of-the-art operations and process control systems have also resulted in the deployment of predictive maintenance systems, based on data analytics for equipment faults and process anomaly detection to improve the reliability of our operations, and predictive quality analytics that improve product quality and consistency.
Throughout the United States, we operate and maintain two cement plants, three marine import terminals, seven active mine locations, 82 ready-mix locations with 92 batch plants, eight concrete block locations with 13 production lines, seven fly ash plants and 21 distribution hubs that can handle various combinations of our products.
Our Reportable Segments
Due to the regional nature of our business, we report our operating results in two reportable segments: Florida and Mid-Atlantic. We run our operations nimbly allowing us to pivot resources to markets we support with the greatest demand based on market conditions.
6
Table of Contents
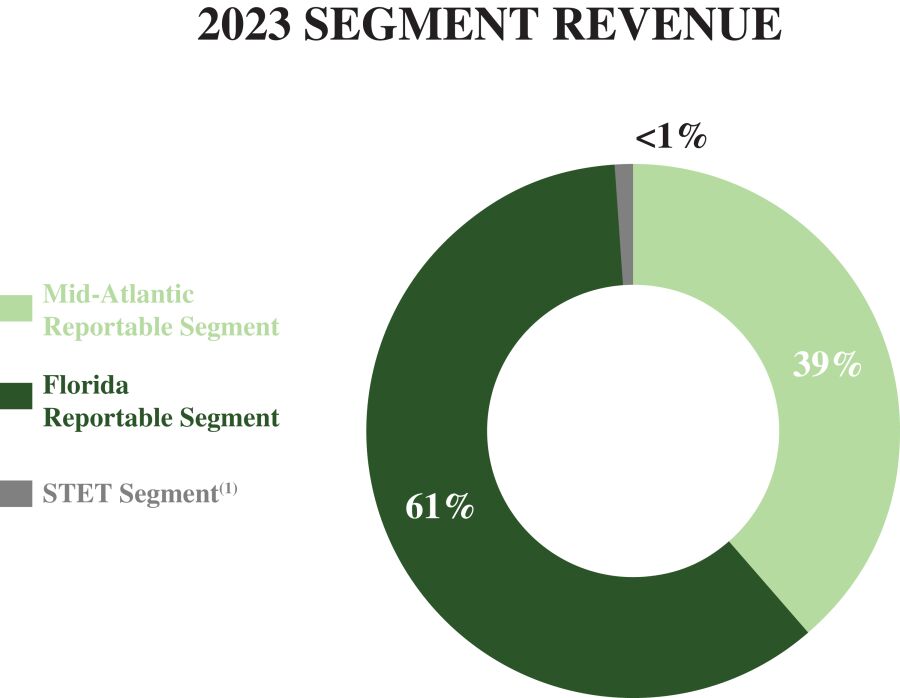
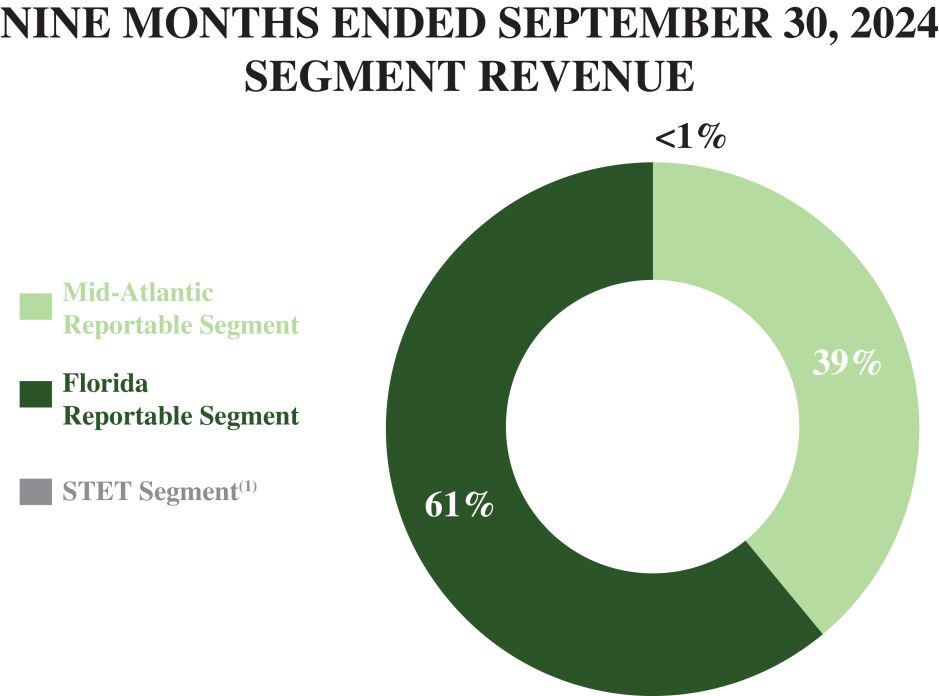
The following charts show revenue by segment for the fiscal year 2023 and the nine months ended September 30, 2024:
|
|
| (1) | Represents the revenue associated with the STET segment. The STET segment is a nonreportable operating segment that develops, manufactures, sells and services triboelectrostatic separators and related equipment used to beneficiate fly ash, industrial minerals, and food and feed organics. After the Contribution of Titan Atlantic to Titan America, on January 1, 2025, Titan America LLC divested the STET segment in a sale for cash, to be settled no later than January 31, 2025, to Titan Cement Netherlands B.V., a wholly owned subsidiary of Titan Cement International, which is outside the scope of this offering. |
Florida Reportable Segment
Our Florida reportable segment consists of our cement, aggregates, ready-mix concrete, concrete block and fly ash operations within the State of Florida. We currently operate one cement plant, three mines, 40 ready-mix locations with 45 batch plants, eight concrete block locations with 13 production lines, two fly ash facilities and one multi-product marine import terminal along with related logistics infrastructure.
7
Table of Contents
The Florida Titan Network
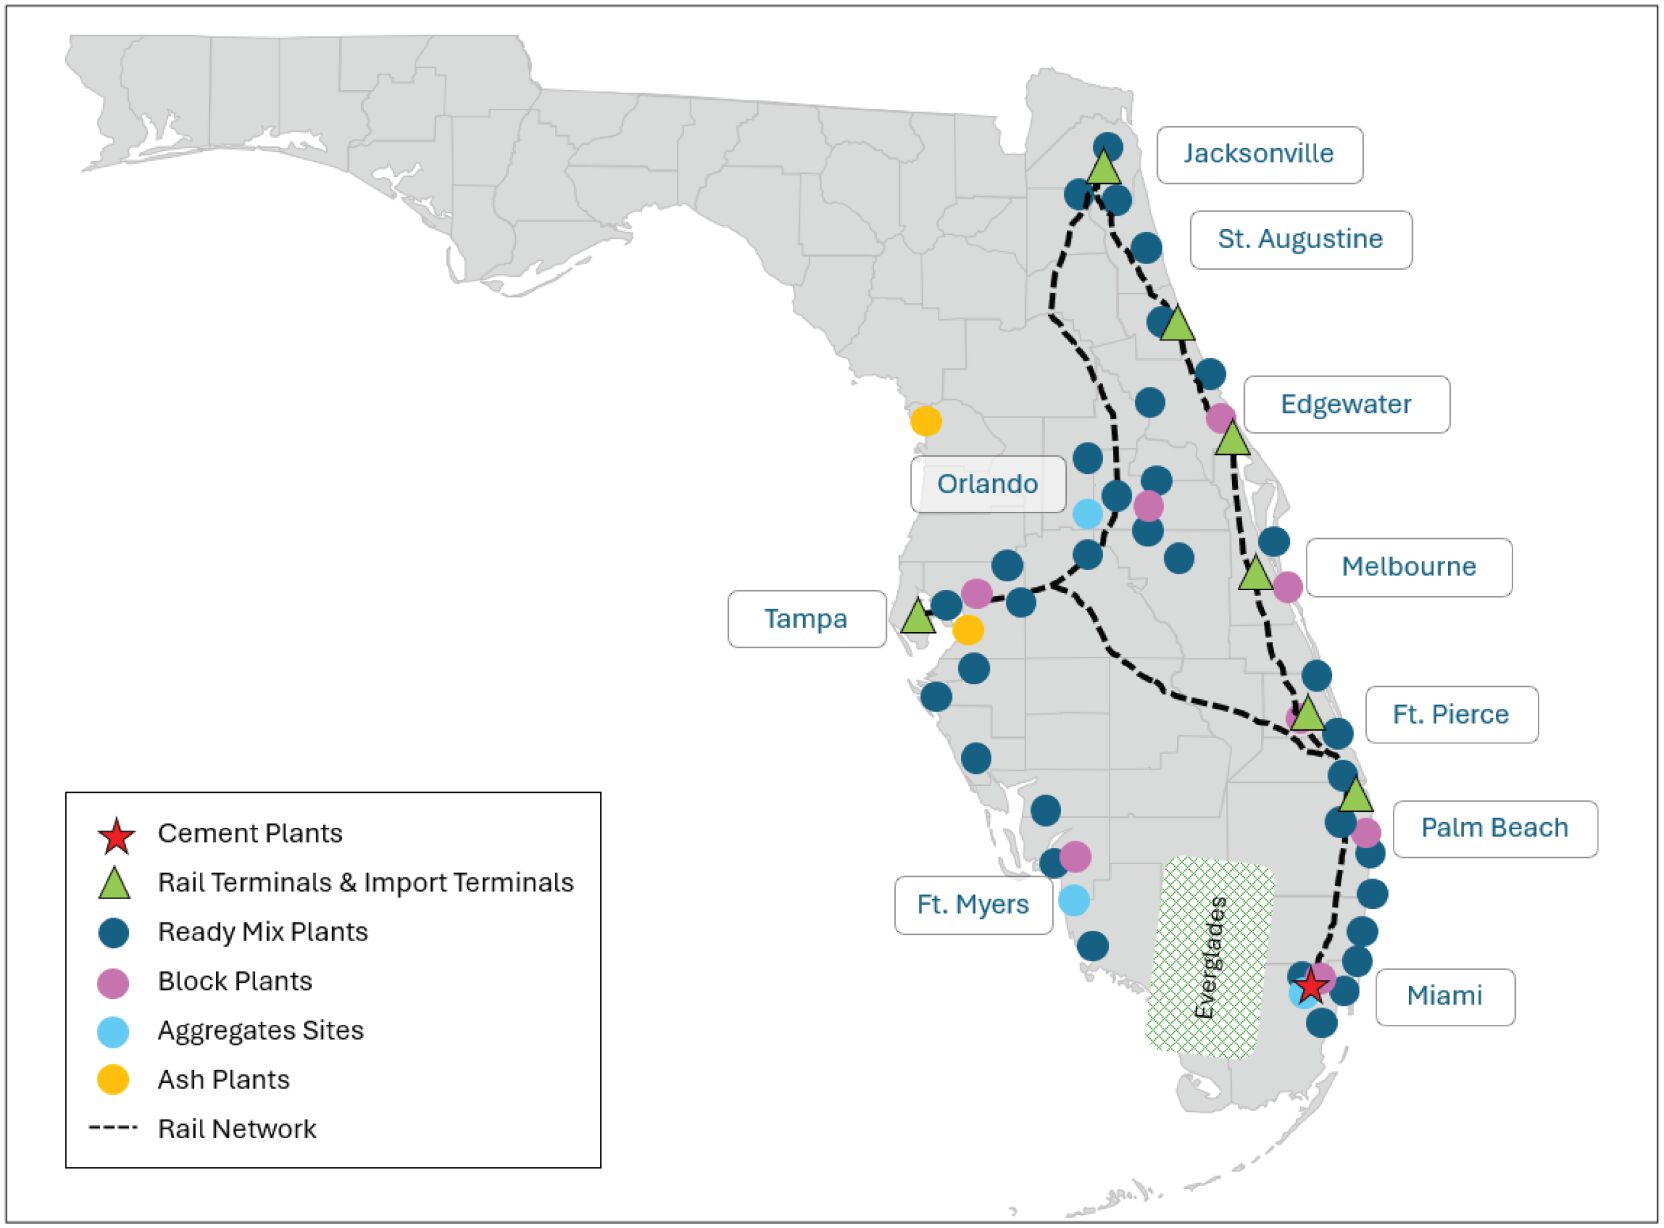
In fiscal year 2023, our Florida reportable segment generated $969.9 million in segment external revenue and $221.2 million in segment adjusted EBITDA, an increase of $161.4 million in segment external revenue and $90.7 million in segment adjusted EBITDA compared to fiscal year 2022. In the nine months ended September 30, 2024, our Florida reportable segment generated $762.4 million in segment external revenue and $197.0 million in segment adjusted EBITDA, an increase of $33.1 million in segment external revenue and $37.2 million in segment adjusted EBITDA compared to the nine months ended September 30, 2023.
Mid-Atlantic Reportable Segment
Our Mid-Atlantic reportable segment consists of our cement, aggregates, ready-mix concrete and fly ash operations throughout the Mid-Atlantic region, most concentrated in Virginia, North Carolina, South Carolina, New York and New Jersey, capable of serving surrounding states such as Maryland, West Virginia, Kentucky, Tennessee, Pennsylvania, Ohio and Indiana areas with fly ash. We currently operate one cement plant, four mines, 42 ready-mix locations with 47 batch plants, along with related logistics infrastructure and import terminals.
8
Table of Contents
The Mid-Atlantic Titan Network
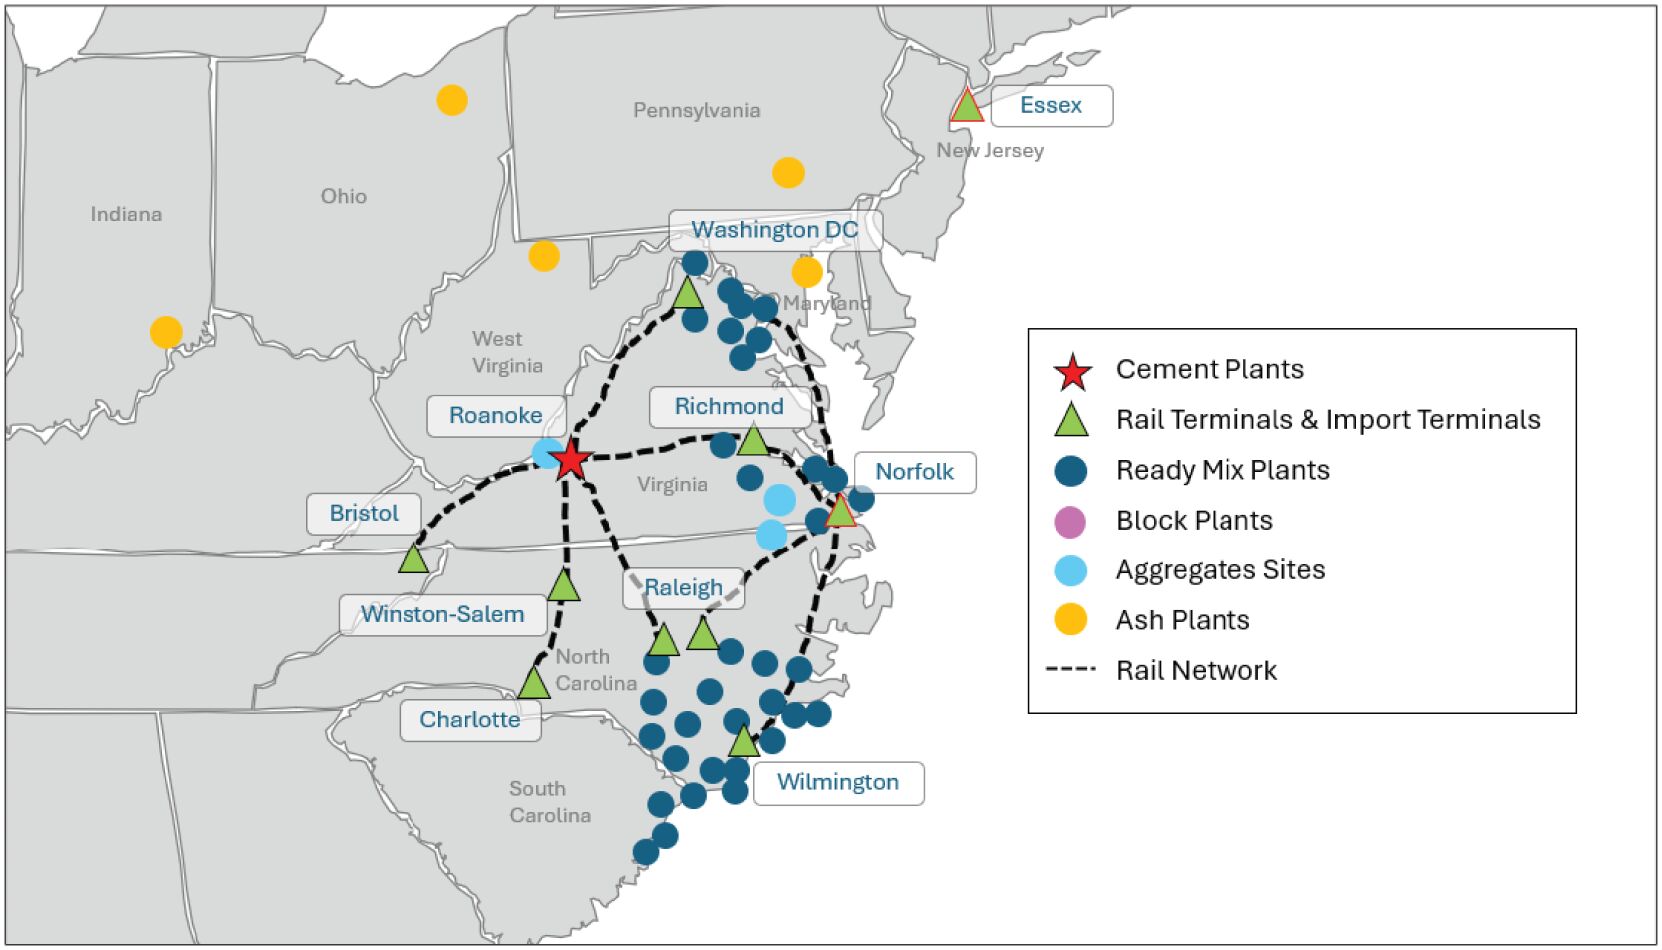
In fiscal year 2023, our Mid-Atlantic reportable segment generated $619.7 million in segment external revenue and $118.3 million in segment adjusted EBITDA, an increase of $66.4 million in segment external revenue and $45.5 million in segment adjusted EBITDA compared to fiscal year 2022. In the nine months ended September 30, 2024, our Mid-Atlantic reportable segment generated $481.0 million in segment external revenue and $100.5 million in segment adjusted EBITDA, an increase of $19.4 million in segment external revenue and $11.5 million in segment adjusted EBITDA compared to the nine months ended September 30, 2023.
Our Industry
Our products primarily serve the large and highly fragmented construction materials industry in the Eastern Seaboard. We are a well-established, leading player in the construction materials value chain where there are high barriers to entry. These barriers to entry include the capital-intensive nature of the heavy construction materials production process, as well as stringent regulations requiring new entrants to receive permits and approvals to operate, including acceptance from local communities. We primarily serve the residential, non-residential and infrastructure construction end markets.
Key End Markets of the Construction Industry
Residential Construction
Our products have broad applications in the single family and multifamily residential construction industry, with uses across the new build and renovation/refurbishment spectrum. Cement products are utilized in the concrete and mortar that forms the foundation of the house. Cement products are also leveraged to create or otherwise build concrete building blocks, pavers, driveways, sidewalks, mortar and grout.
Non-residential Construction
Our products are used in the non-residential construction industry to build commercial and industrial buildings, including, manufacturing facilities, shopping centers, data centers, warehouses, hospitals, schools, hotels and restaurants. Cement is often favored as a construction input for the non-residential sector due to its ease of use, strength, durability and versatility.
9
Table of Contents
Infrastructure Construction
Our products are used in the infrastructure construction industry to build, renovate and refurbish bridges, roads, highways, airports, military facilities, tunnels, water and sewage treatment and distribution facilities, and any other project that is funded by federal, state or local governments.
Key Trends in the Construction Industry
We believe we are at the beginning of a powerful multiyear growth cycle across our three end markets, underpinned by a structural residential housing shortage and boosted by significant federal and state spending in infrastructure and manufacturing onshoring.
Residential Housing Shortage
It is estimated that the U.S. residential market is underbuilt by 3.4 million homes as of May 2024, with the six key states in which we operate accounting for 860,000, or 25%, of the shortage, according to the PCA. We believe this shortage is the result of strong demand for housing, driven by a rapid increase in household formation by millennials and other age groups. According to the PCA, 89 million people in the United States are in the prime first-time home buyer age range of 25 to 44 as of May 2024. Housing demand is also increasing as a result of population growth including migration domestically across the United States and immigration into the United States.
Government Support and Investment in Critical U.S. Infrastructure
The Infrastructure Investment and Jobs Act of 2021 (IIJA) authorized $1.2 trillion of transportation and infrastructure spending, with $550 billion going towards new investments and programs and the rest budgeted for continued investment in existing vital infrastructure. Under the IIJA, the six key states in which we operate will receive an aggregate of $81.7 billion in additional federal funds for infrastructure projects announced as of June 11, 2024. According to the PCA, the IIJA is expected to require approximately 52 million tons of cement over the next five years across the United States, with 39% of that volume going to the construction and renovation of roads, bridges and other major projects, which we expect will result in increased demand for cement, aggregates and related products. As of May 13, 2024, improvements and repairs are underway on more than 257,000 miles of roads and 13,000 bridges across the United States, and over $300 billion is expected to be invested in roads and bridges over the life of the IIJA.
Investment in Manufacturing
According to McKinsey & Company, the U.S. manufacturing sector is poised for robust growth through 2029, driven by strong government incentives, technological innovation and a strategic focus on building more resilient supply chains and sustainable production systems. The Dodge Momentum Index (DMI), which measures non-residential building projects that are in the planning stage, has grown in recent months, indicating significant increases in manufacturing-related construction spending as a result of businesses efforts to reshape supply chains and leverage federal policies that support demand for heavy industrial projects. Key federal policies promoting domestic manufacturing include the CHIPS and Science Act and the IRA, which direct more than $422 billion in incentives.
Domestic Cement Production Deficit, Florida Aggregates Shortage
According to the United States Geological Survey (USGS), the amount of cement produced domestically in recent years has plateaued at or around 100 million tons per annum. However, domestic demand for cement has continued to grow, surpassing domestic production capacity. The amount of imported cement consumed in the
10
Table of Contents
United States has grown significantly since 2013, from 7 million tons in 2013 to 21 million tons in 2023. We believe the supply/demand imbalance in domestic cement production will drive the long-term need for import capacity.
Pricing Growth Across our Core Products
Prices for our core products have consistently risen over the last decade through economic cycles, as demand for cement, aggregates and related products has increased with ongoing growth in residential, non-residential and infrastructure construction across the United States. Factors impacting the industry-wide growth in pricing of our core products include increased energy, labor and logistics input costs, greater demand for cement and related products coupled with stagnant domestic clinker and cement production and capacity and investments in decarbonization and meeting increasingly stringent environmental regulations.
Increasing Demand for Lower-Carbon Cement and Other Green Products and Solutions
Communities, consumers and businesses increasingly have a heightened awareness and desire to embrace more sustainable practices. This social shift towards carbon reduction is not only fostering innovation but is also creating opportunities for the development of greener construction products and methods. According to S&P Global, 45% of companies included in the S&P 500 index have committed to net-zero emissions targets. These companies are often at the forefront of this shift, having committed to significant reductions in their carbon footprints, including those related to their construction activities. Additionally, metropolitan statistical areas (MSAs) such as Miami-Dade and New York have made the significant environmental commitments of being net-zero on carbon emissions by 2050 and 2040, respectively. These commitments will provide significant funding to less carbon intensive construction and product development.
In response, manufacturers of heavy construction materials, including us, are prioritizing the development and use of less carbon-intensive raw materials and SCMs, alternative fuels and carbon capture, utilization and sequestration (CCUS) technologies. These trends are expected to accelerate as more companies, municipalities and industries align with global sustainability goals, further intensifying the development of less carbon-intensive construction materials and techniques.
Our Core Products
Our core products include cement, aggregates, ready-mix concrete, concrete blocks and fly ash. We sell our products to residential, non-residential and infrastructure end markets along the Eastern Seaboard. See IndustryOur Core Products.
Cement
The cement production process leverages aggregates that are mined from quarries and transported to the cement manufacturing facility. Once quarry materials are brought to a cement production plant, they are ground into fine dust, fed into a kiln, heated by combustion of conventional and alternative fuels and transformed into small granules known as clinker. The clinker is then ground with gypsum, limestone and other additives to become cement. Companies in the cement industry manufacture multitudes of cement variations, including but not limited to, OPC, Portland-limestone, masonry, pozzolanic and other hydraulic types of cement, each with varying uses in specific construction and various applications. Companies in the cement industry sell the product primarily to concrete applications, along with various other end-use applications.
Aggregates
Aggregates products include crushed stone, sand and gravel and are primarily used in manufacturing concrete, asphalt and unbound base applications. Companies in the aggregates industry mine from quarries and sell the
11
Table of Contents
product to various end-use applications, including concrete producers. Due to the high weight-to-value ratio of aggregates, materials are typically transported economically over a limited distance.
Ready-Mix Concrete
Ready-mix concrete refers to unhardened mixed concrete delivered to job sites. Ready-mix concrete is manufactured in batching plants according to a set recipe and then delivered to construction sites in a freshly mixed state using trucks. It is mixed in specific proportions of cement, water, aggregates and sometimes additives, ensuring consistency and quality. This method allows for precise control over the concretes properties, such as strength and workability, making it a convenient option for various construction projects.
Concrete Blocks
Concrete blocks are made from a mixture of cement, water and aggregate, and are used in building construction. Florida is the largest concrete block market in the United States since concrete blocks are required by the South Florida building code due to their energy efficiency, storm and fire resistance qualities, termite resistance and design flexibility. We believe that the expected increase in severe weather events caused by climate change may continue to increase demand for concrete blocks due to their storm and fire resistance qualities.
Fly Ash
SCMs, such as fly ash, are used in cement and concrete production to enhance the durability, impermeability, workability and sustainability of concrete. Fly ash is generated as a by-product of coal combustion in the generation of electricity by utilities and can be recycled for use as a replacement to clinker in the cement production process, improving grinding efficiency and reducing the carbon footprint of the final product.
Our Competitive Strengths
We believe we are well positioned to capitalize on favorable trends for future growth because of the following competitive strengths:
Leading Market Positions in Several Fast-Growing Economic Mega-Regions of the Eastern Seaboard with Strategically Placed Facilities and Terminals
We are one of the largest suppliers of cement in Florida, Virginia and the Carolinas, and occupy a leading position in Metro New York. Based on cement imports and cement plant capacity divided by the total size of the market as reported by PCA, we occupy 31.3% of the Florida market, 30.0% of the Virginia and the North Carolina markets and 24.1% of the Metro New York market. This makes us one of the largest suppliers of building materials in three out of the 11 economic mega-regions of the United States, areas that contain multiple metropolitan areas that are densely populated and offer attractive demographics and population growth.
Our cement plants and marine and land terminals are strategically located to increase proximity and shorten transport time to our end customers across our three economic mega-regions. Our network of facilities allows us to maximize logistical efficiency while maintaining a significant geographic reach. For example, our Roanoke Plant combined with our Norfolk Terminal and an extensive logistics network of rail terminals, loadouts and storage facilities, efficiently services our markets and customers in Virginia, Tennessee, West Virginia, South Carolina and North Carolina. In Florida, our Pennsuco facility is the only plant on the FEC rail network serving the east coast of Florida, while our Port Tampa Bay Terminal supports Tampa and the west coast of Florida, one of the fastest growing regions in the country.
12
Table of Contents
Vertically Integrated Business Model Providing Strategic Flexibility and Reliable Production
We believe we have established a vertically integrated business model that allows us to reliably supply our customers with high-quality products. Additionally, our vertical integration gives us visibility into the needs of customers up and down the value chain.
Our vertically integrated manufacturing and distribution network of more than 100 facilities includes two cement plants, three marine import terminals, rail-connected logistics terminals, mines, ready-mix concrete batch plants, block production lines and fly ash processing plants across our core markets. We believe that our extensive, high-capacity logistics network provides flexible and reliable sourcing to help meet the needs of our customers, even in times of market disruptions.
Our vertical integration allows us full control of the quality, availability and supply of raw materials and intermediates for production of consistently high-quality products across the construction value chain, as evidenced by our multiple NRMCA Producer Excellence in Quality Awards. For example, we use our own limestone to produce clinker, cement and aggregates. We leverage our internally-supplied clinker and SCMs to produce our cement, which is then used together with our aggregates to manufacture our concrete products. Our ready-mix concrete and concrete block operations source nearly 100% of their cement inputs from our own internal supply.
We believe our vertically integrated business model helps us establish a strong presence in the market with increased proximity to our customers, providing a 360-degree view of their needs. In addition to providing convenience and communication, it gives us the capability to develop, test and optimize new products for the market. We believe that all of these factors differentiate us in the marketplace and, as a result, position us for customer retention and growth.
Comprehensive Logistics Network with Strategically Placed Facilities and Terminals
The construction materials sector is a localized industry due to the high cost of transportation of cement, concrete, aggregates and other products. Further, customer job sites operate on extremely time-sensitive workflows and rely on consistent and readily-available supplies of key construction products. Customers can neither rely on, nor can suppliers afford, long supply chains. Reliability and timeliness of supply are critical success factors.
Our production and import facilities and extensive intermodal logistics networks are strategically placed to increase proximity and shorten transport time to our end customers. These networks connect our aggregate sites, import terminals and cement plants to regional markets across the Eastern Seaboard. We believe our network delivers efficiency, flexibility and security of supply for our customers.
Intense Focus on Customer Service and Solutions
Through our more than 120 years of industry experience and focus on operational excellence, we believe we have fostered deep customer trust and satisfaction. We have direct access up and down the value chain, and a 360-degree view that allows us to identify emerging market trends and customer preferences and the opportunity to provide tailored, engineered solutions.
Our product development program is centered around driving innovation, productivity, performance and sustainability across our portfolio, with a keen focus on meeting emerging market demands and enhancing our competitive edge. Our initiatives are strategically designed to leverage technological advancements, optimize operational efficiency of our own operations and those of our customers and deliver high-performance, environmentally sustainable solutions to our customers and the broader concrete construction value chain.
13
Table of Contents
We offer several benefits to our customers, including high quality products, customized products and solutions, sustainable products, technical support, a reliable supply chain, innovative products and solutions and a relentless focus on serving our customers.
Significant Installed Capacity Ready to Capture Market Growth
As the industry enters what we believe to be a new multi-year growth phase, we have expanded our capacity with the goal of meeting what we expect will be a growing demand for our products and services. Our average cement sales volume over the past three years was approximately 5.6 million tons and our three marine import terminals are capable of receiving and distributing approximately 6.3 million tons of cement annually, as of December 31, 2023. This capacity is a result of significant investments that we have made to expand our import terminals along the Eastern Seaboard, including a combined $73 million to increase capacity at our Port Tampa Bay Terminal and our Norfolk Terminal.
Our Port Tampa Bay Terminal averaged over 650,000 tons of imported cement annually over the last three years, with an ability to manage approximately 2.5 million tons annually. We are also permitted and able to import, store and ship over 700,000 tons of aggregates per year at our Port Tampa Bay Terminal. At our Norfolk Terminal, we imported approximately 450,000 tons of cement annually over the last three years, and we can manage approximately 1.9 million tons annually. Our Essex Terminal averaged over 850,000 tons of cement imports annually over the last three years, with capabilities to manage approximately 1.9 million tons annually. With our differentiated multi-product capabilities, we can import different types of cements, SCMs, aggregates and other bulk products.
The Eastern Seaboard requires imports of cement, aggregates and SCMs to supplement domestic production. With construction activity expected to increase in the coming years, the need for imported construction products is expected to rise. Cement imports have always been an integral and flexible part of our business model. With our import capabilities, we are able to flex our supply to meet market demand, such as quickly increasing our imports to meet increased demand while expanding our geographic reach and the ability to cost effectively serve these market areas.
Proven Track Record of Successful Innovation Merging Global Trends with Local Needs
We believe our latest product and technology developments position us at the forefront of innovation and sustainability, directly addressing emerging market trends and enhancing our competitive strengths across the construction industry. Furthermore, we believe our focus on innovation allows us to better address high growth and high margin product and service opportunities.
Our innovation helps to solve critical industry and society needs, addressing themes such as (i) the path to net-zero emissions, (ii) construction productivity, (iii) novel construction technologies, (iv) circular economy and (v) climate adaptation. Each of these initiatives underscores our commitment to leading the market with high-performance, sustainability-minded solutions.
An Independent Business that Benefits from the Support of a Well-Established Parent Company
Established in 1902, Titan Cement International, our parent, is a leading global cement producer. Since our initial investment in the United States in 1989, we have operated as a largely independent U.S. subsidiary. While our operations are all handled domestically and our current U.S. management team has driven significant growth in the business since 2014, we benefit from intercompany loans and credit facilities made available to us through Titan Global Finance PLC (TGF), a wholly owned subsidiary of Titan Cement International. These intercompany loans and credit facilities are based on financial terms contained in the arms length agreements consummated among TGF and its third-party lenders, each of which benefit from Titan Cement Internationals credit rating.
14
Table of Contents
The intercompany loans and credit facilities made available to Titan America contain no financial or other covenants and utilize the favorable market pricing obtained by TGF as a result of Titan Cement Internationals credit rating. For these reasons, we believe the overall pricing and terms of the intercompany agreements are better than those that Titan America could independently secure in the credit markets. We also benefit from services agreements with Titan Cement International, pursuant to which Titan Cement International provides us with technical, functional and other support services, including the services of the in-house engineering team of our parent company, with whom we partner to develop proprietary technology that aims to make cement production faster, more cost-efficient and better for the environment. With essentially two teams working on developing new technology and processes to improve our operations, we believe we are at the forefront of innovation in our industry. See Certain Relationships and Related Party Transactions.
On a yearly basis, Titan America LLC enters into ordinary course of business supply agreements under the master supply agreement with Titan Cement Company S.A., an affiliate of TCI, for the purchase of a predetermined amount of cement and cementitious products for the following year at a price based on the arms length principle in accordance with the U.S. transfer pricing rules and the relevant OECD guidelines. See Certain Relationships and Related Party Transactions.
Dedicated Management Team with a Proven Track Record of Stable, Above-Market Growth and Fiscal Responsibility
Our executive management team collectively has approximately 225 years of combined experience, which is leveraged across the organization and supported by a strong set of local and regional managers who have operational expertise in the industry.
Our executive management team has successfully guided us through various economic cycles, including the COVID-19 pandemic. Under our current senior management teams leadership, we have grown our sales from $539 million in 2013 to $1.6 billion in fiscal 2023, our net income went from a loss of $65.4 million to a positive $155.2 million and our net income margin has grown from negative 12% to positive 10% during the same period.
We believe that our executive management teams experience navigating through economic cycles, as well as our diversified end markets and customer base and vertically integrated business model, provides increased stability for our business relative to other building materials manufacturers. The infrastructure, residential and non-residential end markets have historically operated on different cycles and benefit from varied demand drivers. The stability of our diversified end markets has allowed us to generate free cash flow throughout economic cycles, which our executive management team has historically deployed to manage leverage, invest in organic growth opportunities and make strategic acquisitions.
Growth Strategies
We intend to leverage our competitive strengths to create shareholder value through the following core growth strategies:
Cement Capacity Expansion
We are currently investing in the expansion of our Pennsuco facility and our Roanoke Plant that we expect will increase total cement production capacity by 29% to 4.9 million tons by 2030, compared to our current cement production capacity of 3.8 million tons as of September 30, 2024. With a goal of increasing cement production to three million tons at our Pennsuco facility and 1.8 million tons at our Roanoke Plant by 2030, we plan to invest in new grinding mills and repurpose existing assets for additional grinding capacity.
We expect that the additional cement capacity will allow us to meet higher demand with domestic production, while maintaining our flexibility provided by our import capabilities to further increase supply. The planned
15
Table of Contents
additional cement capacity includes (i) a flash calciner project at our Roanoke Plant, which will be partially funded by the DOE, and (ii) fine calcined clay production capacity, blended downstream without extra grinding, thus supporting lower carbon cement production.
We are also developing a plan to expand our Pennsuco facilitys cement storage by 30,000 tons and enhance loadout capabilities with new loading bays. We plan to engage an outside engineering firm to study upgrades to the existing systems and design the extra storage and loadout needed to handle three million tons of annual cement production.
To increase unloading capacity, Port Tampa Bay is currently investing $20 million in a new berth in front of our Port Tampa Bay Terminal. We will have priority right at this new berth with 72-hours written notice, subject to limited exceptions, as per an agreement with Tampa Port Authority, which allows us to berth our vessels without delay or restrictions in connection with other port traffic. With the goal of efficiently distributing our Pennsuco facilitys additional capacity, we plan to invest and expand existing rail terminals on the FEC railway to double existing cement rail volumes.
Supplementary Cementitious Materials: Grow Domestic Production, Imports and Volume from New Sources
We plan to invest in growth of domestic production and imports of SCMs, which are an important input in the long-term decarbonization of the cement industry. By capitalizing on our proprietary ST electrostatic separation technology, we are pursuing agreements with coal fired power plants for the reclamation and beneficiation of landfills and freshly generated fly ash sources across the Eastern Seaboard. This will provide new sources of fly ash to be utilized for the production of blended cements as well as used in engineered concrete formulations.
We expect that our investment in calcined clay, which is partially funded by the DOE, will result in additional sources of an important cementitious material utilized in the production of blended cements and other engineered concrete applications, further diversifying our product portfolio.
We plan to capitalize on our parent companys owned pozzolan reserves and our import terminals to supply pozzolan, another important element of blended cements and engineered ready-mix concrete formulations. We also will pursue long-term supply contracts to import other cementitious materials such as fly ash and slag from reliable sources around the world.
Aggregates: Strengthen Position through Investment in Reserves and Exploration
Through our exploration program we are focused on identifying and securing new coarse and fine aggregates sources that can efficiently serve our markets. In addition, we are pursuing potential new sources of aggregates outside our markets by rail and marine delivery. The size and layout of our Norfolk Terminal and Port Tampa Bay Terminal enables the inbound movements of offshore aggregates directly into our markets utilizing Panamax class vessels.
Since 2014, we have added critical reserves to our existing aggregates operations through the acquisition of incremental adjacent property, modifications to existing permits and applying new technologies, including ultra fines recovery, deploying innovative dredge equipment, recycling various construction concrete waste materials and optimizing process plant recoveries.
Strengthen Ready-Mix and Block Businesses through Focused Investment in Downstream Capabilities
To better capitalize on expected growth within our residential, non-residential and infrastructure construction end markets, we are planning to invest in expansion of the reach and capabilities of our ready-mix and block business.
16
Table of Contents
Within our ready-mix concrete business, we intend to invest in 10 to 15 new fixed and portable plants over the next five years. We specifically intend to create a mobile ready-mix concrete division to focus on serving public and private mega-projects, by installing the mobile units right at the customer job sites. We believe that this model will result in planning and operational efficiencies for both our customers and us. This will also allow us to remain close to our customers to provide tailored solutions for services and products.
We intend to expand our block business geographic footprint with at least two additional production locations in the next five years, while at the same time augmenting our existing capabilities at our 13 production lines.
We expect our success in ready-mix concrete and block to continue to help drive growth across all products of our vertically integrated model.
Tapping into New Value Pools and Accelerating Green Growth through Continued Investment in and Development of Financially Attractive, Less Carbon-Intensive Products and Solutions
We intend to continue investing in and developing our portfolio of less carbon-intensive products and solutions as we drive toward achieving our goal of carbon neutrality across the cement and concrete value chain by 2050. We believe we can grow our revenue as the demand for differentiated less carbon-intensive products and solutions is expected to accelerate over the coming years.
Our product development program is centered around driving innovation, productivity, performance and sustainability across our portfolio, with a keen focus on meeting emerging market demands and enhancing our competitive edge to drive revenue growth and margin expansion. Our initiatives are strategically designed to leverage technological advancements, optimize operational efficiency of our own operations and those of our customers and deliver high-performance, environmentally sustainable solutions to our customers.
We plan to build on the foundation of our recently developed high-performance concrete and cementitious products tailored to meet increasingly demanding construction needs for infrastructure and commercial markets. These products and solutions include:
| | High-strength and high-modulus elasticity concretes, which are designed for increasingly tall and slender high-rise buildings in major urban markets. |
| | High-durability concretes developed for projects requiring extended service life in extreme conditions, including landmark tunnels and bridges. |
| | Marine and underwater concretes, designed and specialized for corrosive environments. |
| | Our GreenCrete® product line, which offers independently validated less carbon-intensive concrete mixtures (based on third-party measurements of embodied CO2 content relative to industry benchmark specifications) while enhancing performance across all applications. |
| | BrightCem®, an industry-first performance-based cement with a reduced CO2 footprint. |
| | Proprietary 3D mortars for both residential and marine applications. |
| | Extended joint spacing concrete, which addresses specific challenges in the automation of the warehouse and distribution industry, providing a durable low joint surface to allow the use of robotic solutions. |
Our lower carbon and high performing cements and supplementary cementitious materials are critical to enable these concrete mixes. We believe that our high-performance products not only enhance the quality of construction but also support sustainable and resilient development.
Leverage our Vertically Integrated Business Model to Grow our Existing Market Positions
Externally, our ability to manufacture and deliver aggregates, cement, SCM, ready-mix concrete and concrete blocks allows us to act as a single-source supplier for customers across all construction end markets. Our
17
Table of Contents
extensive logistics network, comprised of marine and land terminals, railways, trucks, modern infrastructure and technology, enables us to service customers, including major project sites. In 2023, we completed a $73 million investment at our Port Tampa Bay Terminal and our Norfolk Terminal, constructing new domes, adding multi-product storage capacity of approximately 70,000 tons each, as well as on other repairs and refurbishments.
Customers rely on suppliers with condensed, local supply chains due to the cost-intensive nature of transporting cement products. We intend to leverage our vertically integrated business and robust logistical network to serve our existing clients and to grow our current market positions.
Drive Digitalization as a Critical Enabler for Top-Line and Margin Growth with Dynamic Manufacturing, Logistics and Customer Experience Solutions
We plan to continue investing in digital transformation and AI/ML technologies as we see it as a critical enabler to drive operational excellence and growth. We are among the first cement producers to implement a full set of AI/ML digital solutions that have improved the productivity, efficiency and reliability of our manufacturing operations. Both of our cement plants are now utilizing RTO that improves equipment throughput while minimizing energy consumption, AI/ML-based predictive maintenance tools that improve the reliability and stability of the operations and AI/ML-based predictive quality analytics that improve product quality and consistency. We believe that our position as a technological innovator in our markets positions us to take advantage of growth opportunities and develop further efficiencies in our operations.
Capitalizing on the knowledge and experience gained from the industrial digitalization applications, we are developing and implementing an AI/ML application for real-time optimization of our logistics and distribution network managing the scheduling and delivery of our concrete products. These algorithms will allow for better scheduling of daily deliveries, taking into account external disruptions like weather and traffic events and keeping the customer aware of their product delivery status. This advanced digital application coupled with a dynamic, end-to-end cloud-based customer portal will transform the way our customers interact with us, improving the overall customer experience while contributing to distribution cost reduction and productivity increases of our ready-mix concrete operations.
Enhance our Platform Capacity and Utilization through the Implementation of Internal Initiatives Supporting Growth and Profitability
Our current executive management team has a robust track record of driving improvement in the business and a proven ability to execute strategic initiatives since 2014. In addition to the above strategies, we have a slate of initiatives focused on growth, driven by operational excellence, asset utilization, pricing, raw material procurement, cost controls and freight/distribution logistics, targeting improvements in our cost structure and overall profitability. Lastly, we are making strategic investments in new assets to enhance our material storage and distribution facilities, mineral reserves and delivery capacity.
Expand into Adjacent Market Segments within the Construction Value Chain
In addition to our growth strategies pertaining to our existing geographies and core products, we are constantly evaluating opportunities to expand via greenfield development or potential acquisitions into adjacent market segments across the construction value chain. This evaluation process represents a strategic effort to capitalize on high-growth opportunities within the construction industry and emerging market needs from our customers. Successful expansion can generate additional revenue with margins that are enhancing to our core business, capitalizing on market demand and our ability to offer high-quality, durable products and services tailored to the specific needs of customers up and down the construction value chain.
For example, we are exploring an expansion into the precast market, specifically production of lintels, sills and pavers. We have the raw materials and technical capabilities to produce these high-margin products and we
18
Table of Contents
maintain commercial relationships and channels to the end user markets. These product markets represent an obvious adjacency into which we can grow.
We intend to remain disciplined in our approach with an aim to generate strong returns through capital deployment. We believe our capital resources provide us with ample financial flexibility to execute organic and inorganic growth opportunities.
The Reorganization Transactions
On May 9, 2024, Titan Cement International, our parent company, announced its intention to complete an initial public offering of its U.S. business. Prior to the date of this prospectus, Titan Cement International contributed the 1,734,440 shares it held in Titan Atlantic, representing 100% of the equity in Titan Atlantic, to TASA in exchange for 175,342,465 common shares of TASA. The Contribution was immediately preceded by a share split of TASAs then-current common shares at a 10:1 ratio. After the Contribution of Titan Atlantic to Titan America SA, on January 1, 2025, Titan America LLC divested the STET segment in a sale for cash, to be settled no later than January 31, 2025, to Titan Cement Netherlands B.V., a wholly-owned subsidiary of Titan Cement International, which is outside the scope of this offering. The STET segment is immaterial to the results of operations, financial position, and cash flows of the Company.
Additionally, we will enter into a shared services agreement with Titan Cement Company S.A., a wholly-owned subsidiary of Titan Cement International (the Shared Services Agreement). The Shared Services Agreement will govern various interim and ongoing relationships between us and Titan Cement International following the completion of this offering. For more information on the Shared Services Agreement, refer to the section titled Certain Relationships and Related Party TransactionsShared Services Agreement.
Agreements relating to the Reorganization Transactions will be made in the context of a parent-subsidiary relationship and the terms of these agreements may be more or less favorable to us than if they had been negotiated with unaffiliated third parties. See Risk FactorsRisks Related to the Reorganization Transactions and Our Relationship with Titan Cement International.
We believe, and Titan Cement International has advised us that it believes, that the Reorganization Transactions and this offering will provide a number of benefits to our business. These intended benefits include:
| | improving our strategic and operational flexibility; |
| | allowing us to adopt the capital structure, investment policy and dividend policy best suited to our financial profile and business needs; |
| | providing us with our own equity to facilitate capital investments and acquisitions; and |
| | enabling potential investors to invest directly in our business. |
However, we cannot assure you that we will be able to achieve these and other anticipated benefits of the Reorganization Transactions, and the benefits of the Reorganization Transactions may be delayed or not occur at all. See Risk FactorsRisks Related to the Reorganization Transactions and Our Relationship with Titan Cement International.
19
Table of Contents
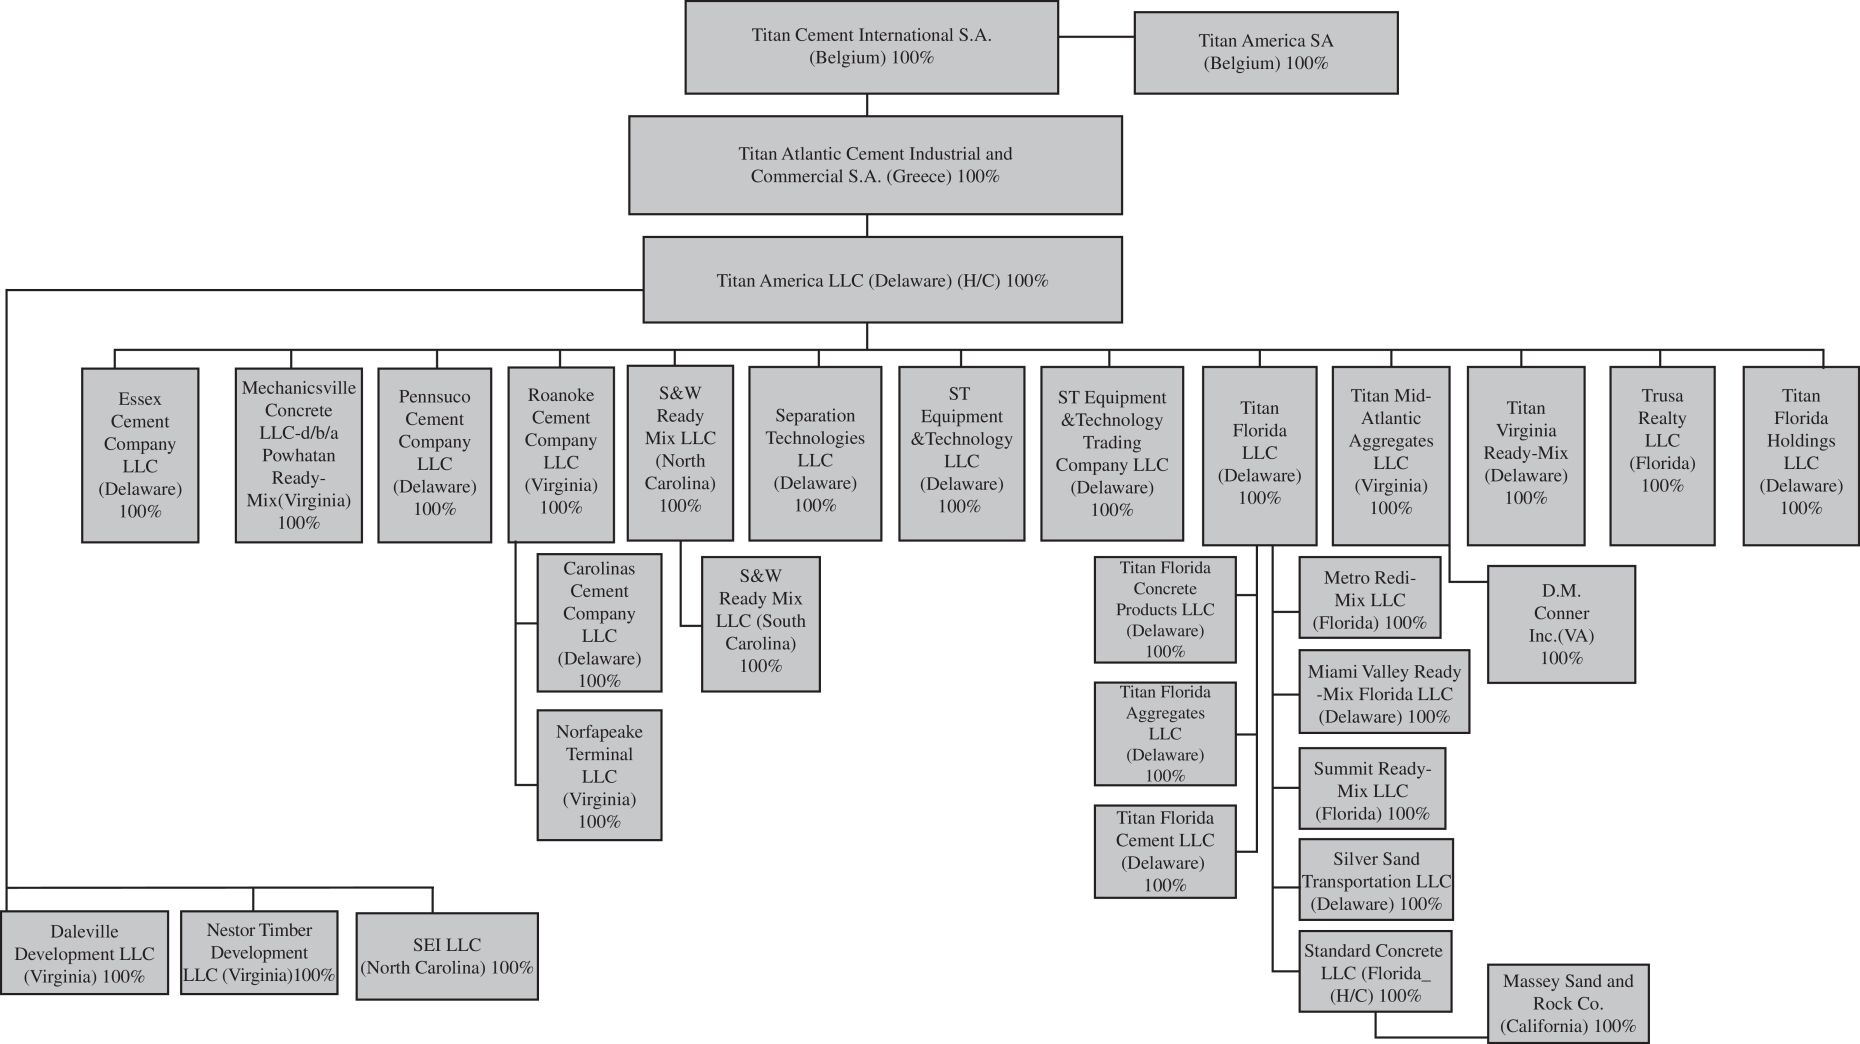
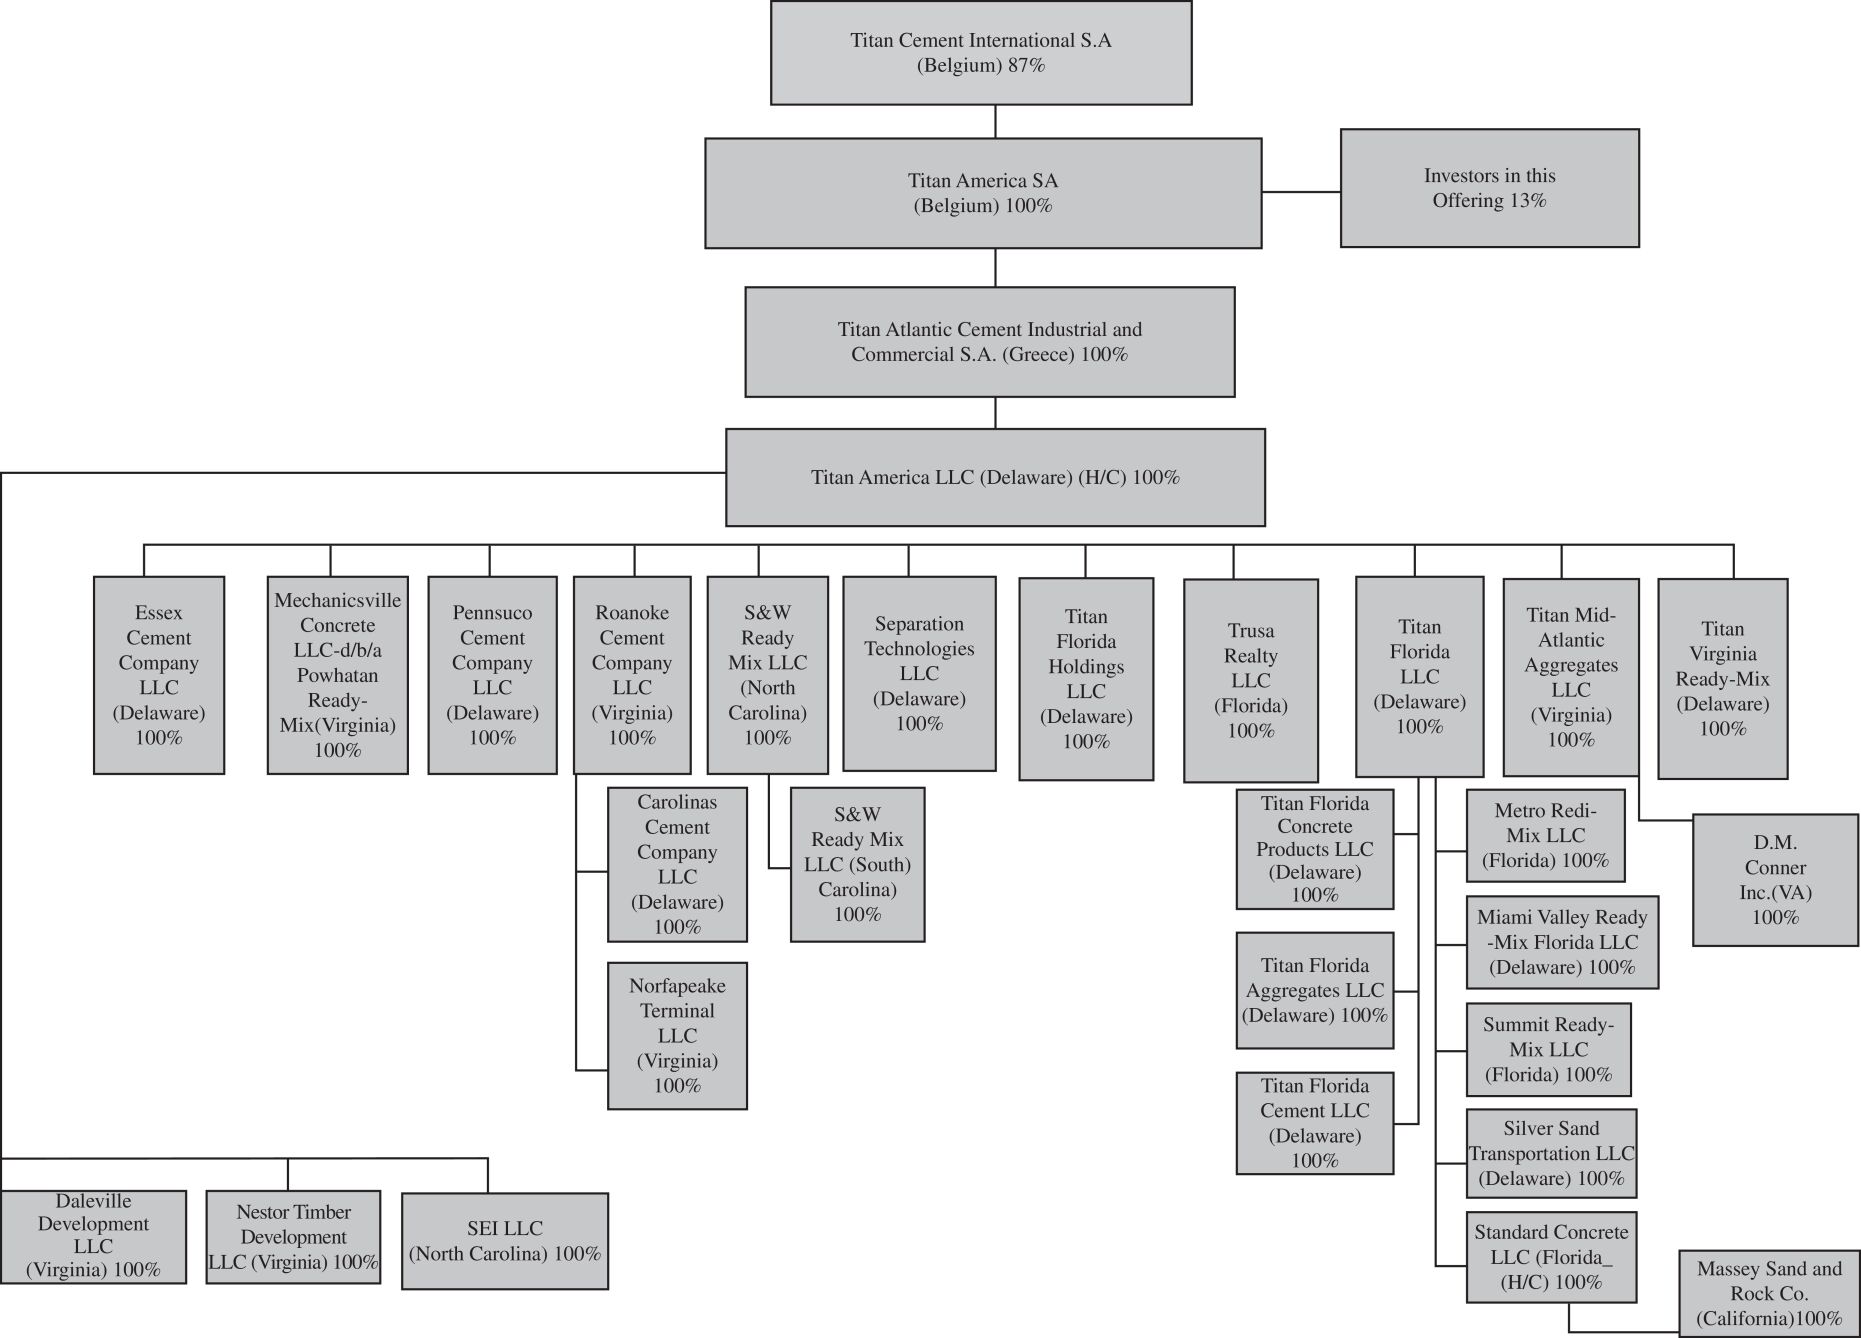
Set forth below are organizational charts displaying the corporate structure of Titan Group as follows: (i) prior to the Reorganization Transactions and the offering, (ii) after the Reorganization Transactions and before the offering and (iii) after the Reorganization Transactions and after the offering:
Organizational Chart Prior to the Reorganization Transactions and the Offering

20
Table of Contents
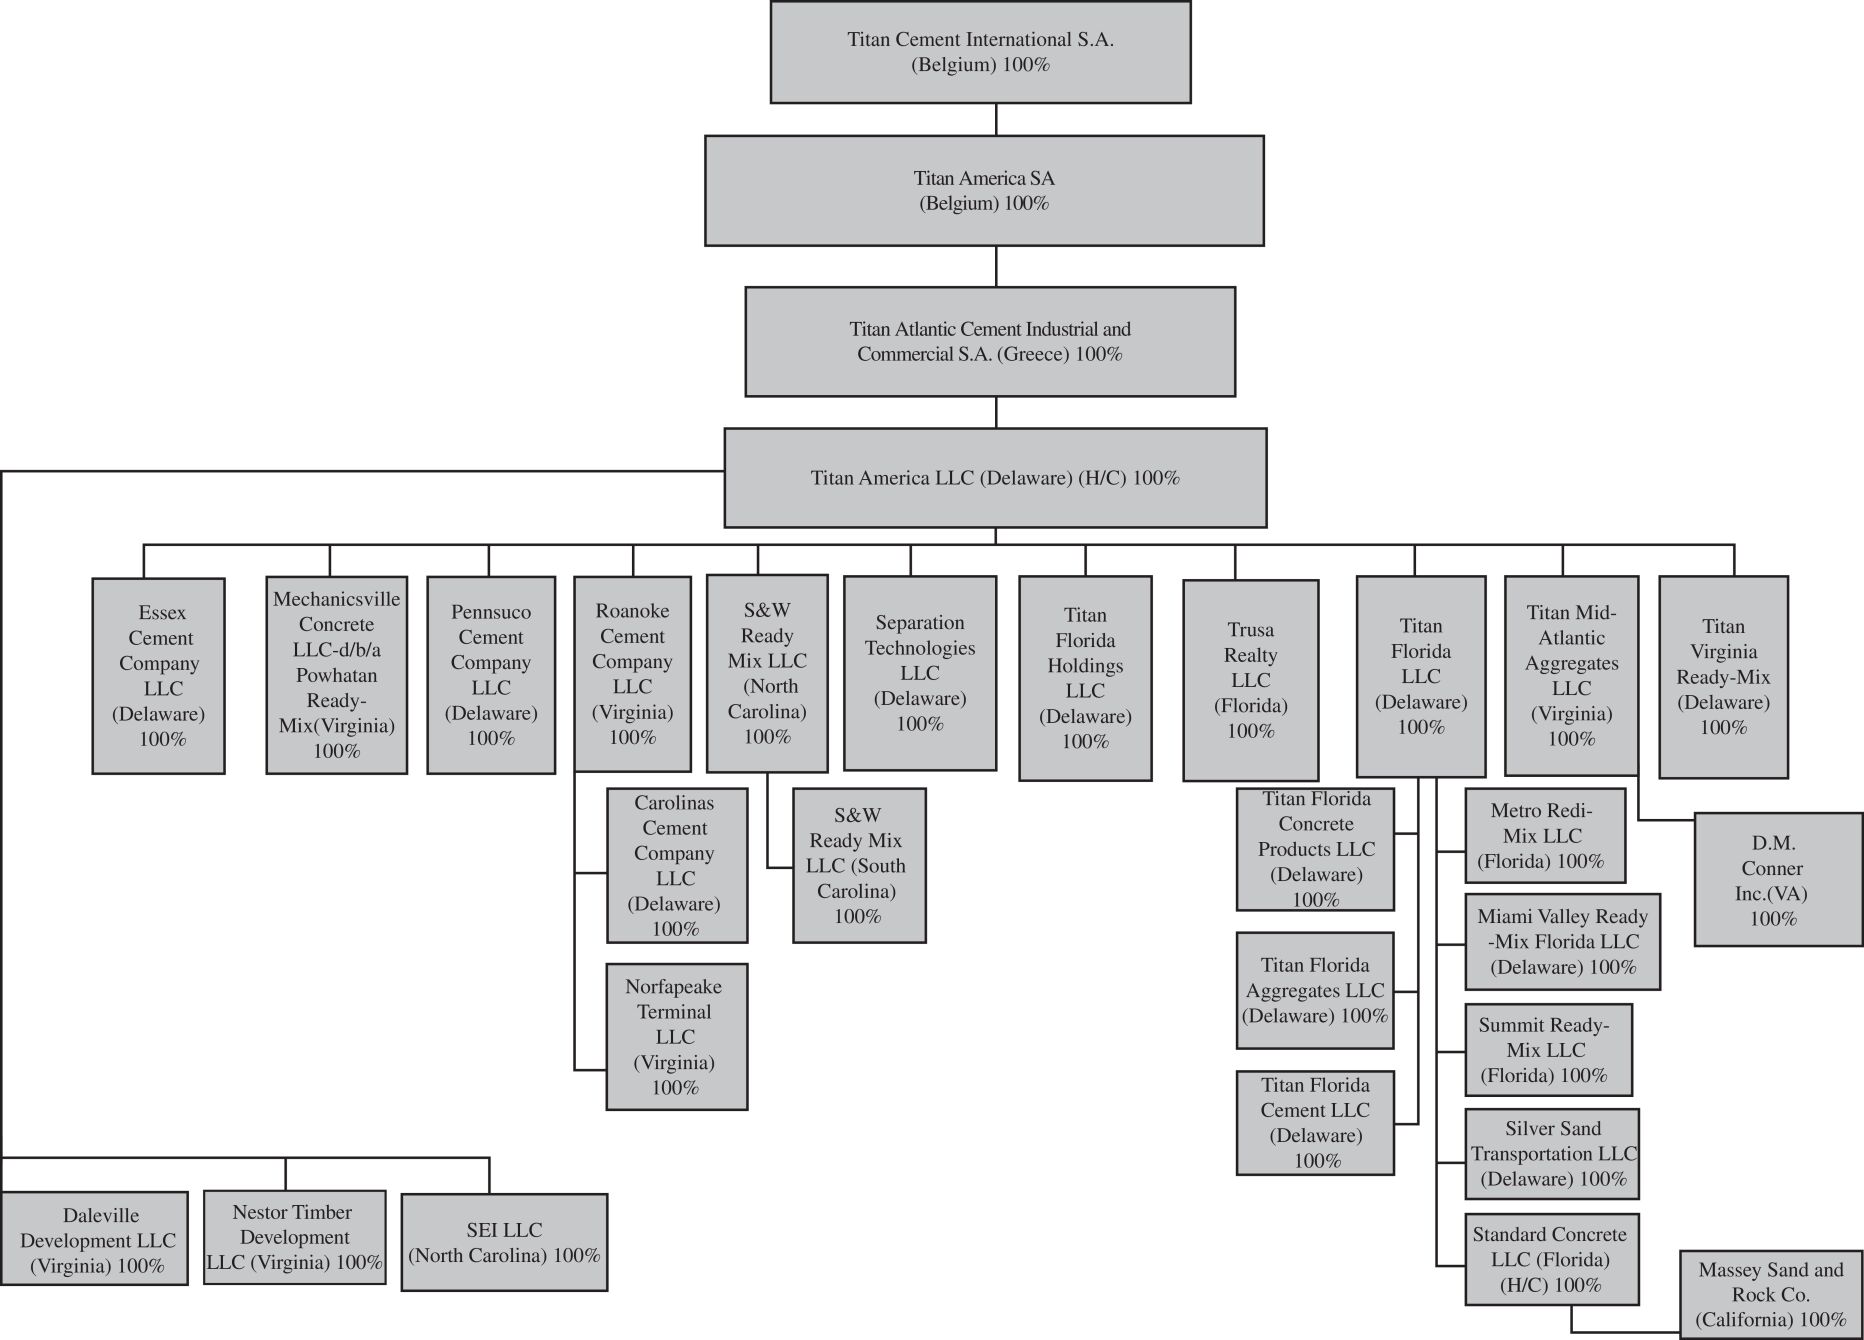
Organizational Chart After the Reorganization Transactions and Prior to the Offering
21
Table of Contents
Organizational Chart After the Reorganization Transactions and After the Offering
Corporate Information
We were incorporated on July 17, 2024 as a company with limited liability (société anonyme/naamloze vennootschap) incorporated and operating under the laws of Belgium. We are registered with the Register of Legal Entities (registre des personnes morales/rechtspersonenregister) of Brussels (French-speaking division) and are registered with the Crossroads Bank for Enterprises (Banque-Carrefour des Entreprises/Kruispuntbank van Ondernemingen) under number 1011.751.174.
Our principal executive offices are located at 1000 Bruxelles, Square de Meeûs 37, Belgium, which is also our registered office. We also have offices at 5700 Lake Wright Drive, Suite 300, Norfolk, Virginia 23502, and our telephone number is +1 (757) 858-6500. Our website is www.titanamerica.com. The information contained on, or accessible through, our website is not incorporated by reference into this prospectus, and you should not consider any information contained in, or that can be accessed through, our website as part of this prospectus or in deciding whether to purchase common shares in this offering.
22
Table of Contents
Our Shareholder
We are owned by Titan Cement International, the parent company of the Titan group of companies. Established in 1902 in Greece, Titan Cement International is a multinational cement and building materials producer with cement production facilities in ten countries, serving customers in more than 25 countries globally. Immediately prior to the completion of this offering, Titan Cement International beneficially owned 100.0% of our outstanding common shares, and will beneficially own approximately 87% of our common shares following the completion of this offering, assuming no exercise of the underwriters option to purchase additional common shares. If the underwriters exercise their option to purchase additional common shares, Titan Cement International will beneficially own approximately 85% of our common shares following the completion of this offering. We also currently expect to be a controlled company under corporate governance standards and to take advantage of certain corporate governance exceptions related thereto. See Risk FactorsRisks Related to the Offering and Ownership of our Common Shares.
Recent Developments
Preliminary, Unaudited Estimated Financial Information for the Year Ended December 31, 2024
We have presented below preliminary, unaudited estimates of certain financial information for the year ended December 31, 2024, as well as comparable information for the year ended December 31, 2023, which was derived from our financial statements for the year ended December 31, 2023, as we believe they are useful to investors in understanding our recent comparative operating performance.
We have provided ranges, rather than specific amounts, for certain information below, primarily because our financial closing and analysis procedures for the year ended December 31, 2024 are not yet completed. The unaudited financial information for the year ended December 31, 2024 set forth below is preliminary, based upon our estimates and currently available information and subject to revision based upon, among other things, our financial closing procedures, the completion of our financial statements procedures and completion of our audit for the year ended December 31, 2024. During the course of the preparation of our financial statements by management, which will be further subjected to an audit, additional items that require adjustments to the preliminary financial information presented below may be identified. The preliminary financial information for the year ended December 31, 2024 presented below should not be viewed as a substitute for financial statements prepared in accordance with IFRS. In addition, the preliminary financial information is not necessarily indicative of the results to be achieved in any future period and should be read together with the sections entitled Special Note Regarding Forward-Looking Statements and Risk Factors and our consolidated financial statements and related notes included elsewhere in this prospectus.
We will complete the preparation of our financial statements for the year ended December 31, 2024 following the completion of this offering and expect to complete such preparation no earlier than March 2025. Although we are currently unaware of any items that would require us to make adjustments to the information set forth below and do not expect that actual results will differ materially from the information set forth below, it is possible that we may identify such items as we complete our financial statements and any resulting changes could be material.
The preliminary financial data included in this prospectus has been prepared by, and is the responsibility of, Titan America SAs management. PricewaterhouseCoopers LLP has not audited, reviewed, examined, compiled,
23
Table of Contents
nor applied agreed-upon procedures with respect to the preliminary financial data. Accordingly, PricewaterhouseCoopers LLP does not express an opinion or any other form of assurance with respect thereto.
| Years Ended December 31, | ||||||||||||
| 2024 | 2024 | 2023 | ||||||||||
| ($ in thousands) | (Low) | (High) | (Actual) | |||||||||
| IFRS Results of Operations: |
||||||||||||
| Revenue |
$ | 1,625,000 | $ | 1,635,000 | $ | 1,591,601 | ||||||
| Net income |
$ | 159,000 | $ | 169,000 | $ | 155,244 | ||||||
| Non-IFRS Measures: |
||||||||||||
| Adjusted EBITDA |
$ | 365,000 | $ | 372,000 | $ | 328,373 | ||||||
We expect revenue to be between $1,625,000 and $1,635,000, representing an estimated increase of approximately 2.10% to 2.73% for the year ended December 31, 2024 compared to the year ended December 31, 2023, primarily as a result of increases in product pricing which more than offset declines in external sales volumes of cement and aggregates. Positive contributions from infrastructure and commercial construction were offset by a soft residential construction environment and adverse weather conditions in the second half of the year.
We expect net income to be between $159,000 and $169,000, representing an estimated increase of approximately 2.42% to 8.86% for the year ended December 31, 2024 compared to the year ended December 31, 2023, primarily as a result of improved gross profit which benefitted from lower energy and imported material costs. The improvement in gross profit was partially offset by higher general and administrative expenses, including costs associated with this offering. In addition, net income was affected by higher income tax expense associated with a higher level of pre-tax income and a higher expected effective tax rate.
We expect Adjusted EBITDA to be between $365,000 and $372,000, representing an estimated increase of approximately 11.15% to 13.29% for the year ended December 31, 2024 compared to the year ended December 31, 2023. Adjusted EBITDA grew at a faster rate than net income primarily as a result of the year-over-year changes in the items depicted in the table below.
Adjusted EBITDA is a supplemental financial measure that is not presented in accordance with IFRS. The following table provides a reconciliation of net income to Adjusted EBITDA for the year ended December 31, 2024 (at the low end and high end of the estimated net income range set forth above) and for the year ended December 31, 2023. Please see Managements Discussion and Analysis of Financial Condition and Results of OperationsNon-IFRS Measures for a discussion of Adjusted EBITDA.
| Years Ended December 31, | ||||||||||||
| 2024 | 2024 | 2023 | ||||||||||
| ($ in thousands) | (Low) | (High) | (Actual) | |||||||||
| Net income |
$ | 159,000 | $ | 169,000 | $ | 155,244 | ||||||
| Finance cost, net |
26,000 | 25,700 | 22,244 | |||||||||
| Income tax expense |
57,600 | 59,000 | 47,134 | |||||||||
| Depreciation, depletion and amortization |
100,500 | 99,500 | 91,079 | |||||||||
| Loss on disposal of fixed assets |
2,500 | 2,400 | 3,852 | |||||||||
| Asset impairment (recovery)/loss |
| | (609 | ) | ||||||||
| Foreign exchange loss/(gain), net |
(20,500 | ) | (21,000 | ) | 11,981 | |||||||
| Derivative financial instrument (gain)/loss, net |
22,500 | 22,000 | (10,967 | ) | ||||||||
| Fair value loss on sale of accounts receivable, net |
5,000 | 4,500 | 6,113 | |||||||||
| Share-based compensation |
3,900 | 3,800 | 3,173 | |||||||||
| IPO transaction costs(1) |
12,000 | 11,000 | | |||||||||
| Other(2) |
(3,500 | ) | (3,900 | ) | (871 | ) | ||||||
| Adjusted EBITDA |
$ | 365,000 | $ | 372,000 | $ | 328,373 | ||||||
| (1) | In connection with this offering, we have incurred incremental expenses that primarily consist of consulting, legal and accounting fees that are not indicative of our ongoing costs. |
| (2) | Other includes, but is not limited to, the impacts on provisions for long-term environmental rehabilitation costs, including provisions for quarry restoration, arising from changes in discount rates, recoveries from insurance claims and other exceptional (gains)/losses. |
24
Table of Contents
Risk Factors Summary
Our business is subject to a number of risks and uncertainties, as more fully described under Risk Factors in this prospectus. These risks could materially and adversely impact our business, financial condition, results of operations and future prospects, which could cause the trading price of our common shares to decline and could result in a loss of your investment. Some of these risks include:
Risks Related to Our Business and Industry
| | We have been, and may continue to be, adversely impacted by volatility and seasonality in the U.S. residential and non-residential construction markets. |
| | Fluctuations in energy, fuel prices and transportation costs could have an adverse effect on our costs of goods sold. |
| | Significant changes in prices for or availability of commodities, labor or other production inputs could negatively affect our costs of goods sold. |
| | Increased market demand for cement substitutes could have an adverse impact on our business. |
| | Delays in construction projects and any failure to manage our inventory could have a material adverse effect on us. |
| | A large proportion of our business, operations and assets are concentrated in parts of the Eastern Seaboard of the United States. |
| | Failure to achieve and maintain a high level of product quality as a result of our suppliers or manufacturers mistakes or inefficiencies could damage our reputation and negatively impact our revenue and results of operations. |
| | Our financial condition and operations could be adversely impacted by climate change and regulations intended to address climate change. |
| | Our operations are subject to special hazards that have caused in the past and may cause in the future personal injury or property damage, subjecting us to liabilities and possible losses, some of which may not be covered by insurance. |
| | Our customer relationships are not generally governed by long-term agreements, and, as a result, such customers have the right to change the terms under which they do business and/or terminate their relationship with us. |
| | Our business is based in part on government-funded infrastructure projects and building activities, and any reductions or reallocation of spending or related subsidies in these areas could have an adverse effect on us. |
Risks Related to the Reorganization Transactions and Our Relationship with Titan Cement International
| | We plan to rely on functions, systems and infrastructure provided by Titan Group, and if Titan Group fails to perform these transitional services we may fail to replicate or replace them. |
| | Titan Cement International and its subsidiaries are among our largest material and service providers, and we might have received better terms from unaffiliated third parties than under our agreements with Titan Cement International and its subsidiaries. |
| | If Titan Cement International sells a controlling interest in our Company to a third party in a private transaction, you may not realize any change-of-control premium on our common shares, and we may become subject to the control of a presently unknown third party. |
25
Table of Contents
Risks Related to Geological, Mining and Environmental Matters
| | Our operations are subject to environmental, health and safety laws and regulations that may increase costs, impact or limit business plans or expose us to environmental liabilities. |
| | Our business may face certain risks related to geological and mining, water management, solid waste, air quality, permitting and regulatory schemes, which could adversely impact our operations and financial position. |
Risks Related to Regulatory and Legal Matters
| | We are subject to health and safety laws and regulations and any failure to comply with any current or future laws or regulations could have a material adverse effect on us. |
| | The use of our products, including cement and supplementary cementitious materials, aggregates, ready-mix concrete, concrete block and other ancillary products, is often affected by various laws and regulations in the markets in which we operate, any of which may have a material adverse effect on us. |
Risks Related to the Offering and Ownership of Our Common Shares
| | Our results of operations and the market price of our common shares may be volatile, and the market price of our common shares after this offering may drop below the price you pay, which could result in substantial losses for investors purchasing shares in this offering. |
| | An active, liquid and orderly trading market for our common shares may not develop, and you may not be able to resell your shares at or above the initial public offering price. |
| | The rights provided to our shareholders under Belgian corporate law and our articles of association differ in certain respects from the rights that you would typically enjoy as a shareholder of a U.S. company under applicable U.S. federal and state laws. |
| | As a foreign private issuer, we are subject to different U.S. securities laws and rules than a domestic U.S. issuer, which may limit the information publicly available to our shareholders or otherwise result in less protection than is accorded to investors under rules applicable to domestic U.S. issuers. |
| | Following the completion of this offering, Titan Cement International will control a majority of the voting power of our common shares, which will prevent you and other shareholders from influencing significant decisions. |
| | We have identified material weaknesses in our internal control over financial reporting. If we are unable to maintain effective internal controls, the accuracy and timeliness of our financial reporting may be adversely affected, which could cause the market price of our common shares to decline, lessen investor confidence and harm our business. |
| | Although we may pay dividends to holders of our common shares, under Belgian law, our ability to do so is subject to the discretion of our board of directors and shareholders. |
| | We are a holding company with no operations of our own and, as such, we depend on our subsidiaries for cash to fund our operations and expenses, including future dividend payments, if any. |
Risks Related to Certain Tax Matters
| | Changes in tax laws or unanticipated tax liabilities could adversely affect our effective income tax rate and profitability. |
As a result of these risks and other risks described under Risk Factors, there is no guarantee that we will be able to successfully execute our business strategy or experience growth or profitability in the future or that our common shares will trade at or above the initial public offering price.
26
Table of Contents
The Offering
| Issuer |
Titan America SA |
| Selling shareholder |
Titan Cement International SA |
| Common shares offered by us |
9,000,000 common shares |
| Common shares offered by the selling shareholder |
15,000,000 common shares |
| Public offering price |
$16.50 per common share, which is the mid-point of the price range set forth on the cover page of this prospectus. |
| Option to purchase additional common shares from the selling shareholder |
The selling shareholder has granted the underwriters an option for a period of 30 days after the date of this prospectus to purchase up to an additional 3,600,000 common shares from the selling shareholder at the initial public offering price less the underwriting discounts and commissions. |
| Common shares outstanding immediately after this offering |
184,362,465 common shares |
| Use of proceeds |
We estimate that our net proceeds from this offering will be approximately $130.7 million from the sale of the common shares offered by us in this offering, based on an assumed initial public offering price of $16.50 per share, the midpoint of the price range set forth on the cover page of this prospectus, and after deducting underwriting discounts and commissions and estimated offering expenses paid and payable by us. |
| We intend to use the anticipated net proceeds from this offering for capital expenditures and other general corporate purposes. We may use a portion of the net proceeds for acquisitions of technologies or businesses that complement our business, although we have no present commitments or agreements to enter into any such acquisitions or investments. See Use of Proceeds for additional information. |
| We will not receive any proceeds from the sale of common shares by the selling shareholder in this offering. |
| Dividend policy |
We currently intend to pay quarterly dividends of $0.04 per share to our shareholders on a pro-rata basis. Any recommendation by our board of directors to the general shareholders meeting to declare and pay dividends and any decision by our board of directors to declare and pay interim dividends in the future will be made at its discretion and will depend on, among other things, our results of operations, financial condition, earnings, capital requirements, debt service obligations, restrictive covenants in our current and future debt |
27
Table of Contents
| agreements, industry practice, legal requirements (including those under Belgian law), cash requirements, contractual restrictions and other factors that our board of directors may deem relevant. All of the common shares offered by this prospectus will have the same dividend rights as all of our other outstanding common shares. Furthermore, we have sufficient issue premium that allows us to retain the possibility of carrying out a consistent distribution policy through the repayment of part of the issue premium per common share which can be decided by a simple majority of shareholders at our general meeting. Any recommendation by our board of directors to the general shareholders meeting to repay part of the issue premium, is contingent on the factors as set out above. Please see Dividend Policy for additional information. |
| Lock-up agreements |
We have agreed with the underwriters, subject to certain exceptions, not to offer, sell or dispose of any shares of our share capital or securities convertible into or exchangeable or exercisable for any shares of our share capital during the 180-day period following the date of this prospectus. Members of our board of directors and our executive officers and the selling shareholder have agreed to substantially similar lock-up provisions, subject to certain exceptions. See Underwriting. |
| Risk factors |
You should carefully read the section entitled Risk Factors and other information included in this prospectus for a discussion of factors that you should consider before deciding to invest in our common shares. |
| Controlled company exemption |
Immediately following the completion of this offering, Titan Cement International will own 87% of the voting power of our outstanding common shares, assuming no exercise of the underwriters option to purchase additional common shares. |
| Accordingly, we will be considered a controlled company under the NYSE rules. Under these rules, a controlled company may elect not to comply with certain corporate governance requirements. We intend to take advantage of certain of these exemptions following the completion of this offering. See ManagementCorporate GovernanceDirector Independence and Controlled Company Exception. |
| We will be exempt from certain rules that would otherwise require that our board of directors consist of a majority of independent directors and that our Nominating and Compensation Committee be composed entirely of independent directors. The controlled company exemption does not modify the independence requirements for the Audit Committee, and we intend to comply with the requirements of the Securities Exchange Act of 1934, as amended (the Exchange Act), and the listing rules of the NYSE, provided that we intend to avail ourselves of an exemption available to foreign-private issuers to allow one non-independent, non-voting observer to serve on the committee. See ManagementCorporate GovernanceDirector Independence and Controlled Company Exception. |
28
Table of Contents
| Listing |
We have applied to list our common shares on the NYSE under the symbol TTAM. |
Unless otherwise indicated or the context otherwise requires, references to the number and percentage of our common shares to be outstanding upon completion of this offering are based on 184,362,465 common shares anticipated to be outstanding upon completion of this offering.
Except as otherwise indicated, all information in this prospectus, including information regarding the number of common shares outstanding:
| | assumes an initial public offering price of $16.50 per share (the midpoint of the price range set forth on the front cover of this prospectus); |
| | assumes the underwriters option to purchase 3,600,000 additional common shares has not been exercised; |
| | gives effect to the completion of the Reorganization Transactions; |
| | gives effect to our amended articles of association, which will be in effect prior to the completion of this offering; and |
| | excludes any common shares that will be reserved under our equity incentive plan, as further described in the section entitled Executive Compensation. |
29
Table of Contents
Summary Historical Consolidated Financial Information
The following tables set forth our summary historical consolidated financial data derived from our financial statements as of the dates and for each of the periods indicated. The summary historical financial data as of December 31, 2023 and 2022 and for each of the three years ended December 31, 2023, 2022 and 2021 have been derived from our audited financial statements included elsewhere in this prospectus. The summary historical financial data as of September 30, 2024 and for each of the nine months ended September 30, 2024 and 2023 have been derived from our unaudited interim condensed consolidated financial statements included elsewhere in this prospectus. Our historical results are not necessarily indicative of the results to be expected for any future period.
You should read this summary historical financial data in conjunction with the section entitled Managements Discussion and Analysis of Financial Condition and Results of Operations and our financial statements included elsewhere in this prospectus.
| Nine Months Ended September 30, | Years Ended December 31, | |||||||||||||||||||
| 2024 | 2023 | 2023 | 2022 | 2021 | ||||||||||||||||
| Income Statement (thousands) |
||||||||||||||||||||
| Revenue |
$ | 1,244,578 | $ | 1,192,464 | $ | 1,591,601 | $ | 1,364,146 | $ | 1,152,417 | ||||||||||
| Cost of goods sold |
(923,653 | ) | (920,955 | ) | (1,228,112 | ) | (1,142,880 | ) | (956,261 | ) | ||||||||||
|
|
|
|
|
|
|
|
|
|
|
|||||||||||
| Gross profit |
$ | 320,925 | $ | 271,509 | $ | 363,489 | $ | 221,266 | $ | 196,156 | ||||||||||
|
|
|
|
|
|
|
|
|
|
|
|||||||||||
| Selling expense |
(24,913 | ) | (21,271 | ) | (31,009 | ) | (29,938 | ) | (24,724 | ) | ||||||||||
| General and administrative expense |
(91,823 | ) | (74,608 | ) | (99,909 | ) | (87,513 | ) | (76,292 | ) | ||||||||||
| Net impairment losses on financial assets |
(251 | ) | (1,136 | ) | (1,224 | ) | (3,711 | ) | (937 | ) | ||||||||||
| Fair value loss on sale of accounts receivable, net |
(4,050 | ) | (4,937 | ) | (6,113 | ) | (3,041 | ) | (1,101 | ) | ||||||||||
| Other operating income (loss), net |
1,341 | 11 | 402 | (21 | ) | 1,073 | ||||||||||||||
|
|
|
|
|
|
|
|
|
|
|
|||||||||||
| Operating income |
$ | 201,229 | $ | 169,568 | $ | 225,636 | $ | 97,042 | $ | 94,175 | ||||||||||
|
|
|
|
|
|
|
|
|
|
|
|||||||||||
| Finance cost, net |
(18,835 | ) | (19,156 | ) | (22,244 | ) | (19,078 | ) | (21,856 | ) | ||||||||||
| Income (loss) from associate |
| | | 272 | (682 | ) | ||||||||||||||
| Foreign exchange gain (loss), net |
(7,467 | ) | 1,970 | (11,981 | ) | 19,990 | 28,835 | |||||||||||||
| Derivative financial instrument gain (loss), net |
(1,482 | ) | (4,155 | ) | 10,967 | (18,534 | ) | (25,915 | ) | |||||||||||
|
|
|
|
|
|
|
|
|
|
|
|||||||||||
| Income before income taxes |
$ | 173,445 | $ | 148,227 | $ | 202,378 | $ | 79,692 | $ | 74,557 | ||||||||||
|
|
|
|
|
|
|
|
|
|
|
|||||||||||
| Income tax expense |
(43,899 | ) | (38,427 | ) | (47,134 | ) | (16,971 | ) | (15,336 | ) | ||||||||||
|
|
|
|
|
|
|
|
|
|
|
|||||||||||
| Net Income |
$ | 129,546 | $ | 109,800 | $ | 155,244 | $ | 62,721 | $ | 59,221 | ||||||||||
|
|
|
|
|
|
|
|
|
|
|
|||||||||||
| Earnings per common share: |
||||||||||||||||||||
| Basic earnings per share |
$ | 0.74 | $ | 0.63 | $ | 0.89 | $ | 0.36 | $ | 0.34 | ||||||||||
| Diluted earnings per share |
$ | 0.74 | $ | 0.63 | $ | 0.89 | $ | 0.36 | $ | 0.34 | ||||||||||
| Weighted average number of common shares basic and diluted |
175,362,465 | 175,362,465 | 175,362,465 | 175,362,465 | 175,362,465 | |||||||||||||||
30
Table of Contents
| As of September 30, | As of December 31, | |||||||||||
| 2024 | 2023 | 2022 | ||||||||||
| Financial Position (thousands) |
||||||||||||
| Cash and cash equivalents |
$ | 12,149 | $ | 22,036 | $ | 29,841 | ||||||
| Total current assets |
$ | 372,500 | $ | 372,899 | $ | 356,895 | ||||||
| Total assets |
$ | 1,547,516 | $ | 1,498,803 | $ | 1,447,232 | ||||||
| Short-term borrowings, including accrued interest |
$ | 141,816 | $ | 267,670 | $ | 74,339 | ||||||
| Lease liabilities (current portion) |
$ | 11,901 | $ | 11,737 | $ | 13,352 | ||||||
| Total current liabilities |
$ | 341,300 | $ | 491,974 | $ | 325,458 | ||||||
| Long-term borrowings |
$ | 227,858 | $ | 76,262 | $ | 320,167 | ||||||
| Lease liabilities (non-current portion) |
$ | 57,615 | $ | 53,744 | $ | 54,055 | ||||||
| Total liabilities |
$ | 784,854 | $ | 779,032 | $ | 854,505 | ||||||
| Total stockholders equity |
$ | 762,662 | $ | 719,771 | $ | 592,727 | ||||||
| Nine Months Ended September 30, |
Years Ended December 31, | |||||||||||||||||||
| 2024 | 2023 | 2023 | 2022 | 2021 | ||||||||||||||||
| Cash Flow Summary (thousands) |
||||||||||||||||||||
| Net cash provided by operating activities |
$ | 197,143 | $ | 142,415 | $ | 227,125 | $ | 178,374 | $ | 146,703 | ||||||||||
| Net cash used in investing activities |
$ | (112,121 | ) | $ | (91,125 | ) | $ | (117,653 | ) | $ | (127,301 | ) | $ | (70,298 | ) | |||||
| Net cash used in financing activities |
$ | (97,214 | ) | $ | (74,891 | ) | $ | (117,779 | ) | $ | (21,661 | ) | $ | (197,138 | ) | |||||
| As of September 30, | As of December 31, | |||||||||||
| 2024 | 2023 | 2022 | ||||||||||
| Additional Measures |
||||||||||||
| Ratio of Total Debt to Net Income(2) |
2.5 to 1.0 | 2.6 to 1.0 | 7.4 to 1.0 | |||||||||
| Nine Months Ended September 30, |
Years Ended December 31, | |||||||||||||||||||
| 2024 | 2023 | 2023 | 2022 | 2021 | ||||||||||||||||
| Non-IFRS Financial Measures(1) (thousands) |
||||||||||||||||||||
| Adjusted EBITDA |
$ | 286,878 | $ | 241,136 | $ | 328,373 | $ | 193,097 | $ | 177,585 | ||||||||||
| Free Cash Flow |
$ | 83,796 | $ | 50,602 | $ | 108,522 | $ | 50,365 | $ | 75,934 | ||||||||||
| Net Debt(2) |
$ | 427,041 | | $ | 387,377 | $ | 432,253 | | ||||||||||||
| Ratio of Net Debt to Adjusted EBITDA(2) |
1.1 to 1.0 | | 1.2 to 1.0 | 2.2 to 1.0 | | |||||||||||||||
| (1) | See Managements Discussion and Analysis of Financial Condition and Results of Operations Non-IFRS Measures for a discussion of these measures and a reconciliation of each to the most directly comparable IFRS measure. |
| (2) | Total Debt, Ratio of Total Debt to Net Income, Net Debt and Ratio of Net Debt to Adjusted EBITDA are balance sheet metrics and are presented as of the last day of each fiscal period. The Ratio of Total Debt to Net Income for the interim periods measures Total Debt at period end to Net Income for trailing twelve months for the periods presented. The Ratio of Net Debt to Adjusted EBITDA for the interim periods measures Net Debt at period end to Adjusted EBITDA for the trailing twelve months for the periods presented. |
31
Table of Contents
This offering and investing in our common shares involve a high degree of risk. You should carefully consider the risks and uncertainties described below, together with all of the other information contained in this prospectus, including our consolidated financial statements and the related notes appearing at the end of this prospectus, before deciding to invest in our common shares. Other risks and uncertainties that we do not presently consider to be material, or of which we are not presently aware, may become important factors that affect our future financial condition and financial performance. If any of those or the following risks actually occur, our business, financial condition, financial performance, liquidity and prospects could suffer materially, the trading price of our common shares could decline and you could lose all or part of your investment. See also Special Note Regarding Forward-Looking Statements.
Risks Related to Our Business and Industry
We have been, and may continue to be, adversely impacted by volatility and seasonality in the U.S. residential and non-residential construction markets.
Our business is largely dependent on demand for residential construction, public spending levels for infrastructure and large-scale projects. The U.S. residential and non-residential construction markets are volatile and subject to cyclical market pressures. The level of activity in the U.S. residential and non-residential construction markets is based on numerous factors such as availability of credit, interest rates, general economic conditions, consumer confidence and other factors that are beyond our control. As a result of macroeconomic headwinds we have faced over the past several years, such as prolonged inflationary cost pressures, supply chain disruptions, the impact of public health crises and geopolitical conflicts, U.S. residential and non-residential construction markets have been adversely affected, and may continue to be adversely affected in the future, by changes in the cost of raw materials as well as labor costs, energy costs and freight costs associated with transportation of raw materials. In addition, demand for our products could decline if companies and consumers are unable to obtain financing for construction projects or if an economic recession causes delays or cancellations to infrastructure projects. A significant downturn in activity in either the U.S. non-residential or residential construction markets could have a material adverse effect on our business, financial position, results of operations and cash flows.
We cannot predict the market conditions that will impact the residential or non-residential construction industry or the timing of residential or non-residential construction activity. We also cannot provide any assurances that the operational strategies we have implemented to address current market conditions will be successful. Weakness in the non-residential or residential construction industry could have a material adverse effect on our business, financial position, results of operations and cash flows. Due to the potential volatility in the residential and non-residential construction markets, there may be fluctuations in our operating results, and the results for any historical period may not be indicative of results for any future period. Any uncertainty about current economic conditions can pose a risk to our business, financial position, results of operations and cash flows, as participants in the U.S. non-residential and residential construction industries may postpone spending in response to tighter credit, negative financial news or declines in income or asset values, which could have a material negative effect on the demand for our products.
A significant portion of our business is seasonal, with results of operations affected by weather conditions. For the Mid-Atlantic region, construction material production and related contracting services typically follow the activity in the construction industry, with heavier workloads in the spring, summer and fall. Accordingly, we typically experience a decrease in sales in our Mid-Atlantic reportable segment during the first and fourth quarters reflecting the effect of the winter season in North America and an increase in sales in the second and third quarters reflecting the effect of the summer season in North American markets. Besides the seasonal effects of weather conditions, extreme or unusually adverse weather conditions, which have occurred and may reoccur, such as extreme temperatures, heavy or sustained rainfall or snowfall, wildfires, hurricanes and storms may affect the demand for products and the ability to perform services on construction work. Heavy or sustained rainfall may particularly impact operations of our ready-mix concrete business. Extreme or unusually adverse weather conditions could negatively affect our results of operations, financial position and cash flows.
32
Table of Contents
Fluctuations in energy, fuel prices and transportation costs could have an adverse effect on our costs of goods sold.
A significant proportion of our cost of goods sold are incurred in connection with the consumption of thermal and electric energy necessary to produce our products, and in connection to transportation costs incurred for the distribution of our products. Cement production consumes a large quantity of energy, especially for the kilning and grinding processes.
Energy is also required for the transportation, both within our facilities and externally, of our products through our trucks in addition to the operation of our equipment. The principal elements of these energy costs are fuel expenses and electricity expenses (which include, inter alia, costs for coal, petroleum coke, natural gas and alternative fuels). Due to their size and weight, aggregates are costly and difficult to transport efficiently. Our products and services are generally localized around our aggregate sites and served by truck or in certain markets by rail or barge. We could be negatively impacted by freight costs due to rising fuel costs; rate increases for third-party freight; truck, railcar or barge shortages, including shortages of truck drivers and rail crews; rail service interruptions; and minimum tonnage requirements, among other things. To the extent price increases or other mitigating factors are not sufficient to offset these increased costs adequately or timely, or if the price increases result in a significant decrease in sales volumes, our results of operations, financial position and cash flows could be negatively impacted. Increases or significant fluctuations in energy and fuel costs, freight rates or other transportation costs could adversely affect our results of operations, business and financial condition, especially if we are unable to pass along higher input costs to our customers. Energy prices may vary significantly in the future, largely due to market forces and other factors beyond our control, including changes in the relevant regulatory regime or governmental policy applicable to energy prices. We may also, particularly in the case of coal, experience time lags between movements in energy prices and movements in production costs since the supply of a substantial proportion of energy resources is secured pursuant to long-term purchase agreements. Risks related to fluctuations in energy and fuel costs are increased due to the fact we do not use any long-term hedging instruments to mitigate the effects of such fluctuations. Legal requirements, as well as a heightened awareness of environmental sustainability, have placed increased pressure on energy-intensive industries such as the cement industry to increase their energy efficiency and to transition to more environmentally friendly sources of energy, such as renewables, which could further increase our cost of goods sold. Changes in the availability of energy sources to meet these demands could adversely impact our ability to operate, and changes in energy prices as a result could significantly increase our operating costs.
Significant changes in prices for or availability of commodities, labor or other production inputs could negatively affect our costs of goods sold.
Our manufacturing operations are exposed to fluctuations in costs for labor, energy and raw materials, among other things. These inputs are also subject to supply chain fluctuations and other general economic and market conditions beyond our control. However, the primary key raw materials used in the manufacturing of cement or aggregates are controlled through a combination of owned and leased reserves. Since 2021, we have experienced elevated commodity and supply chain costs and other inputs used in the production and distribution of our products and services. Recent inflationary pressures have increased our costs above historical averages.
Availability of key natural resources used in the manufacturing of our products is one of the factors that significantly affect our operations and profitability. Therefore, continued active management of our quarries and production plants and the related permits, licenses, rights and titles is key to controlling manufacturing cost escalations in the long term. While the primary source of the key raw material of limestone is from owned reserves adjacent to the cement plants, there can be no assurance that we will be able to maintain or renew these land and mining rights or that we will have similar cost containment for other inputs used in the production process.
Our access to natural resources could be adversely affected by the closure of one or more of our quarries due to unforeseen circumstances related to changes in regulatory environment, disruptions to available transportation networks, or the cancellation of freight agreements or other key contract terminations. If any of our suppliers
33
Table of Contents
ceases to operate, or if we would need to incur additional costs to obtain such materials from other sources, such limitations on our ability to obtain the various inputs required, or to obtain those inputs without additional costs, could have a material adverse effect on our results of operations. Moreover, as we pursue less carbon-intensive inputs for cement, we may experience similar difficulties with alternative inputs such as SCMs.
Increased market demand for cement substitutes could have an adverse impact on our business.
We specialize in the production of cement, aggregates, ready-mix concrete and related products and derive substantially all of our revenue therefrom. Materials such as wood, steel, gypsum, plastic, aluminum and ceramics can be used in construction as a substitute for cement. Other existing construction techniques, such as the use of drywall, as well as any new construction techniques and modern materials, could decrease the demand for cement, ready-mix concrete and mortars. In addition, new construction techniques and modern materials that could replace the use of cement may be introduced in the future. To the extent such products are perceived as having superior environmental or other sustainability characteristics, this may cause customers to be more willing or quick to replace their use of cement. The use of substitutes for cement could cause a significant reduction in the demand and prices for our products and may have a material adverse effect on our business, results of operations and financial condition.
We operate in a highly competitive industry.
The markets for cement, aggregates and other construction materials and services are very competitive. Competition in these segments is based largely on price and on the quality of the material, service provided, logistics and innovative solutions offered. Similarly, our products are fairly commoditized and our ability to price them in a profitable manner is constrained by a competitive price environment, restricting our profitability levels. Competition, whether from established market participants or new entrants, could cause us to lose market shares, increase expenditures or reduce pricing, any one of which could have an adverse effect on our business, results of operations or financial condition.
We compete in each of the markets in which we operate with domestic and international cement producers, as well as importers. Each of these markets we serve are highly fragmented and we compete with a number of regional and national companies. These producers may have greater financial and other resources than we do. Some others are smaller and more specialized and concentrate their resources in particular areas of expertise. We could face increased competition, which would result in lower prices and decreased volumes, either from existing players or new entrants to the markets in which we operate. Further, our profitability is generally dependent on the level of demand for such building materials and services as a whole as well as on our ability to maximize efficiencies and control operating costs. Prices in these markets are subject to material changes in response to relatively minor fluctuations in supply and demand, general economic conditions and other market conditions beyond our control.
In order to maintain or further reinforce our competitive position, we rely on periodic investments in the areas of production and innovation, and on regular maintenance of our production facilities. In the future, we may not have adequate resources to continue to make such investments, and, as a result, may not be able to continue to successfully compete in the markets in which we operate. In addition, competitors could react more quickly to the changing needs of customers, differentiate themselves more effectively, or improve the functionality or performance of their products more quickly than us or in a more cost-effective manner. Therefore, we may face significant price, margin or volume declines in the future, which could have an adverse effect on our business, results of operations or financial condition in particular in markets where cement overcapacity or oversupply is prevalent.
A material disruption at one or more of our facilities or in our supply chain could have a material adverse effect on us.
We own and operate manufacturing facilities of various ages and levels of automated control and rely on a number of third parties and affiliates as part of our supply chain, including for the efficient distribution of products to our customers. Any disruption at one of our manufacturing facilities or within our supply chain could
34
Table of Contents
prevent us from meeting demand or require us to incur unplanned capital expenditures. Older facilities are generally less energy efficient and are at an increased risk of breakdown or equipment failure, resulting in unplanned downtime. Newly commissioned facilities are also subject to unforeseen breakdowns or failures related to mistakes in engineering and equipment selection, poor workmanship during fabrication and/or installation, accidents during the construction and/or commissioning phases, mistakes during initial operation and other related issues that can cause significant delays in the project implementation and facility start up. Any unplanned downtime at our facilities may cause delays in meeting customer timelines, result in liquidated damages claims or cause us to lose or harm customer relationships. Additionally, we require specialized equipment to manufacture certain of our products, and if any of our manufacturing equipment fails, the time required to repair or replace this equipment could be lengthy, which could result in extended downtime at the affected facility. Any unplanned repair or replacement work can also be very expensive. Moreover, manufacturing facilities can unexpectedly stop operating because of events unrelated to us or beyond our control, including fires and other industrial accidents, floods and other severe weather events, natural disasters, environmental incidents or other catastrophes, utility and transportation infrastructure disruptions, shortages of raw materials, and acts of war or terrorism. Work stoppages, whether union-organized or not, can also disrupt operations at manufacturing facilities. Furthermore, while we are generally responsible for delivering products to the customer, in some instances, we do not maintain our own fleet of delivery vehicles and outsource this function to third parties. Any shortages in trucking or rail capacity, any increase in the cost thereof or any other disruption to the highway systems could limit our ability to deliver our products in a timely manner or at all. Any material disruption at one or more of our facilities or those of our customers or suppliers or otherwise within our supply chain, whether as a result of downtime, facility damage, an inability to deliver our products or otherwise, could prevent us from meeting demand, require us to incur unplanned capital expenditures or cause other material disruption to our operations, any of which could have a material adverse effect on our business, financial condition and results of operations. While we maintain insurance policies covering, among other things, physical damage, business interruptions and product liability, these policies may not cover all our losses. In addition, there is no assurance that insurance will continue to be available on terms acceptable to us.
Delays in construction projects and any failure to manage our inventory could have a material adverse effect on us.
Many of our products are used in large-scale construction projects which generally require a significant amount of planning and preparation before construction commences. However, construction projects can be delayed and rescheduled for several reasons, including unanticipated soil conditions, adverse weather or flooding, changes in project priorities, financing issues, difficulties in complying with environmental and other government regulations or obtaining permits and additional time required to acquire rights-of-way or property rights. These delays or rescheduling may occur with too little notice to allow us to replace those projects in our manufacturing schedules or to adjust production capacity accordingly, creating unplanned downtime, increasing costs and inefficiencies in our operations and increased levels of obsolete inventory. Any delays in construction projects and our customers orders or any inability to manage our supply could have a material adverse effect on our business, financial condition and results of operations.
Our investments may not result in expanded capacity at our facilities at the expected levels or timeline, or at all, which could result in a variety of inefficiencies in our business and hinder our ability to generate revenue and profits. If our investments do not result in expanded capacity at our facilities at the levels or timeline that is expected, or at all, we could incur additional costs or experience delays.
We have recently expanded, and made significant investments to further expand, the capacity of our various facilities. However, it is difficult to predict whether our investments will result in expanded capacity at our facilities at the expected levels or within the expected timeline, or at all, and we may have limited insight into trends that may emerge and affect our business. If our investments do not result in expanded capacity at the levels or timeline that is expected, or at all, we could incur additional costs or experience delays. Inaccurate predictions regarding these levels or timelines may prevent us from increasing our production levels, thereby hindering our ability to meet higher demands. Failure to increase capacity and meet higher demands may harm our business, prospects, financial condition, results of operations, and cash flows.
35
Table of Contents
The estimates of a multi-year growth phase in our industry included in this prospectus may prove to be inaccurate, and even if the markets in which we operate achieve the forecasted growth, our business could fail to grow at similar rates, or at all, and we could have over-capacity of our products.
The estimates of a multi-year growth phase in our industry included in this prospectus may prove to be inaccurate. Market opportunity estimates and growth forecasts are subject to significant uncertainty and are based on assumptions and estimates that may not prove to be accurate, including as a result of any of the risks described in this prospectus.
The variables that go into the calculation of multi-year growth are subject to change over time, and there is no guarantee that any particular number or percentage of addressable customers covered by the multi-year growth estimates will purchase our products at all or generate any particular level of revenues for us. Even if the markets in which we compete meet the size estimates and growth forecasted in this prospectus, our business could fail to grow at similar rates, or at all, and we could have over-capacity of our products, especially in light of the investments we have made to further expand the capacity at our various facilities. Our growth is subject to many factors, including our success in implementing our business strategy, which is subject to many risks and uncertainties. Accordingly, the forecasts of multi-year growth of our industry included in this prospectus should not be taken as indicative of our future growth.
Any delay or problem with operating or upgrading our existing information technology infrastructure could cause a disruption in our business and adversely impact our financial results.
Our ability to operate our business on a day-to-day basis largely depends on the efficient operation of our information technology infrastructure and our cloud providers, the largest of which is Microsoft Azure. We may be susceptible to hacks into our systems or other security breaches by unauthorized third parties. We are also susceptible to errors in connection with any systems upgrade or migration to a different hardware or software system, errors or incidents of our cloud providers, bugs or other problems for any of the software we use, either developed in-house or provided by third parties. Security breaches, financial, regulatory or other developments that might prevent these third parties from providing services to us or our users could harm our business. Our systems and our information technology infrastructure are vulnerable to damage or interruption from natural or man-made disasters, power loss, computer viruses, telecommunication and other operational failures, ransomware attacks or any other kind of denial of service related attacks, physical or electronic break-ins, sabotage, intentional acts of vandalism, terrorism, public health crises (including pandemics), extreme weather (including as a result of climate change) and similar events. The public cloud providers could also decide to close their facilities. Any steps that we may take to upgrade and improve the stability and efficiency of our information technology may not be sufficient to avoid defects or disruptions in our technology infrastructure, which could cause a disruption in our business and adversely impact our financial results. Our systems are not fully redundant, and our disaster recovery planning may not be sufficient. Any errors, defects, disruptions, interruptions, delays or cessation of service could result in significant disruptions to our business that could ultimately be more expensive, time consuming and resource intensive than anticipated. We may experience defects or disruptions in our technology infrastructure, including system interruptions and delays that make our site and services unavailable or slow to respond for periods of time, which could adversely impact our ability to fulfill orders, which could reduce our revenue, adversely affect our reputation with or result in the loss of users and negatively impact our financial results. Although we are insured against cyber risks and security breaches up to an annual aggregate limit, our liability insurance may be inadequate and may not fully cover the costs of any claims or damages that we might be required to pay. In the future, we may not be able to obtain adequate liability insurance on commercially desirable or reasonable terms or at all.
In September 2021, we implemented a new version of Titan Cement Internationals enterprise resource planning software, SAP, as part of a plan to integrate and upgrade our systems and processes. As we are dependent on the SAP of Titan Cement International, we lack control over system updates, maintenance schedules and overall system management, which could lead to delays or disruptions that impact our operations. The SAP of Titan
36
Table of Contents
Cement International might also not fully meet our unique needs, which might make our systems potentially less effective or inefficient. Any of these consequences could have a material adverse effect on our business, results of operations and financial condition.
Our aggregate resource and reserve calculations are estimates and subject to uncertainty.
We estimate aggregate reserves and resources based on available data. The estimates depend upon the interpretation of surface and subsurface investigations, major assumptions and other supporting data, which can be unpredictable. The quantity must be considered only an estimate until reserves are actually extracted and processed. This uncertainty in aggregate resource and reserve calculation may adversely impact our results of operations.
We may not be able to secure, permit or economically mine strategically located aggregate reserves.
As discussed above, aggregates are bulky and heavy and therefore difficult to transport efficiently. Because of the nature of the products, the freight costs can quickly surpass production costs. Therefore, except for geographic regions that do not possess commercially viable deposits of aggregates and are served by rail, barge or ship, the markets for our products tend to be very localized around our quarry sites and are served by truck. New quarry sites often take several years to develop. Our strategic planning and new site development must stay ahead of actual growth. Additionally, we may not be able to locate new ready-mix concrete sites and secure the necessary governmental, operating and environmental permits to operate such new sites. In a number of urban and suburban areas in which we operate, it is increasingly difficult to permit new sites or expand existing sites due to community resistance. Therefore, our future success is dependent, in part, on our ability to accurately forecast future areas of high growth in order to locate optimal facility sites and on our ability to either acquire existing quarries or secure governmental, operating, mining and environmental permits to open new quarries and/or ready-mix concrete sites. If we are unable to accurately forecast areas of future growth, acquire existing quarries or secure the necessary permits to open new quarries and/or ready-mix concrete sites, our financial condition, results of operations and liquidity may be materially adversely affected.
We may not be successful in implementing our growth strategy, which could have a material adverse effect on us.
Our long-term strategy includes both organic growth such as investment in lower carbon products, strengthening of market positions through our vertically integrated business model and digitalization of our operations and growth via acquisitions. We use these strategies to strengthen and develop our existing activities, particularly in growth areas, and as a means of reducing market-specific risk via geographic diversification. The successful implementation of such a growth strategy depends on a range of factors both within and outside of our control.
Any failures to execute our growth strategy or successfully integrate acquired assets and businesses could have a material adverse effect on our business, prospects, financial condition and results of operations.
A large proportion of our business, operations and assets are concentrated in parts of the Eastern Seaboard of the United States.
A large proportion of our business, operations and assets is concentrated in Virginia, Florida, North Carolina, South Carolina and the New York Metro Area (as defined below). Currently, approximately 60% of our operations are concentrated in Florida. Despite positive trends and forecasts for the construction segments growth in Florida, there can be no assurance that it will not experience a downturn that will significantly affect our results of operations. For example, the state could experience a decrease in gross domestic product growth, an increase of unemployment or a decrease in consumer confidence, increased property taxes, successive periods of adverse weather conditions, sea level rise or other impacts to infrastructure we rely on, any of which could have a negative effect on our results of operations in Florida. Should positive market trends continue, foreign or national competitors could enter the Florida market to benefit from the increased prices, which could result in a
37
Table of Contents
lower market share, which currently ranks second in the Florida market. There can be no certainty that the positive trends in the U.S. market will continue in the medium- to long-term, in particular given that the U.S. market has been steadily growing since 2011, increasing the risk of a market downturn. Should the U.S. market experience a downturn, demand for our products would decrease and imports from Titan Cement International and their affiliates operations in Greece to the United States would be substantially reduced. In addition, our kilns could be required to operate at lower utilization rates and the rest of our assets could remain idle because of lower demand.
Failure to achieve and maintain a high level of product quality as a result of our suppliers or manufacturers mistakes or inefficiencies could damage our reputation and negatively impact our revenue and results of operations.
To continue to be successful, we must continue to preserve, grow and capitalize on the value of our brand in the marketplace. Reputational value is based in large part on perceptions of subjective qualities. Even an isolated incident, such as an out of specification product delivered to a construction site, or the aggregate effect of individually insignificant incidents, can erode trust and confidence. In particular, product quality issues as a result of our suppliers (including our affiliates) acts or omissions could negatively impact customer confidence in our brands and our products. As we do not have direct control over the quality of the products manufactured or supplied by such third-party and affiliated suppliers, we are exposed to risks relating to the quality of the products we distribute. If our product offerings do not meet applicable safety standards or customers expectations regarding safety or quality, or are alleged to have quality issues or to have caused personal injury or other damage, we could experience lower revenue and increased costs and be exposed to legal, financial and reputational risks, as well as governmental enforcement actions. For example, product quality concerns could result in costly rip and tear expenses for removing previously laid concrete. The termination of key supplier relationships may have a material adverse effect on our business, financial condition and results of operations.
While we regularly test samples of our products before shipment, there can be no assurance that such testing will be adequate to identify all deficient products.
Our financial condition and operations could be adversely impacted by climate change and regulations intended to address climate change.
Severe weather events, such as tornadoes, hurricanes, rain, drought, ice and snowstorms and high- and low- temperature extremes, occur in regions in which we operate and maintain infrastructure. Climate change could change the frequency and severity of these weather events or result in chronic changes to water levels or meteorological patterns, any of which may create physical and financial risks to us. Such risks could have an adverse effect on our financial condition, results of operations and cash flows. Increases in severe weather conditions, extreme temperatures or chronic climatic changes (such as sea level rise or changes in meteorological or hydrological patterns) may also cause infrastructure construction projects to be delayed or cancelled and may limit resources available for such projects, resulting in decreased revenue or increased project costs. Climate change may impact a regions economic health, which could impact our revenues as our financial performance is tied to the health of the regional economies we serve. For example, if ports or other infrastructure on which we rely become less usable due to climate impacts, it may affect demand for, or our ability to provide, our products.
The price of energy also has an impact on the economic health of communities and our production costs. The cost of additional regulatory requirements related to climate change, such as regulation of greenhouse gas (GHG) emissions under the federal Clean Air Act, requirements to replace fossil fuels with renewable energy or to obtain emissions credits or other environmental regulation or taxes could impact the availability of goods and the prices charged by suppliers, which would normally be borne by consumers through higher prices for energy and purchased goods. The costs of such regulations could increase the costs of our products and could adversely impact economic conditions of areas we serve. Such regulations could also increase our cost of doing business by requiring us to install additional pollution control technologies, acquire emissions offsets, or modify
38
Table of Contents
or curtail our operations. Various financial market participants also consider climate-related risks in their decision-making. To the extent financial markets believe we are not well positioned to manage any such risk, our ability to access capital markets or to receive competitive terms and conditions could be negatively affected.
Moreover, in many of the jurisdictions in which we operate, governmental bodies are increasingly proposing or enacting legislative and regulatory initiatives to address the potential impacts of climate change, such as cap-and-trade systems, limits on GHG emissions and requirements to disclose GHG emissions and other climate change-related information, which are expected to become more stringent in the future. These laws and regulations have the potential to impact our operations directly or indirectly and may result in additional compliance requirements by us. For example, we monitor, analyze and report on GHG emissions from our operations and products in response to laws and customer inquiries. In addition, our manufacturing processes have been and may be affected by new laws and regulations in response to climate change. Compliance with such laws and regulations could have a material adverse effect on our business, financial condition and results of operations.
The cement industry is under increasing regulatory pressure to reduce carbon emissions and achieving significant emissions reductions may involve high costs and technical challenges associated with carbon capture and storage. Due to the uncertain availability of technologies to control GHG emissions and the unknown obligations that potential GHG emission legislation or regulations may create, we cannot determine the potential financial impact on our operations.
In addition, the increasing focus on climate change and stricter regulatory requirements may result in our business facing adverse reputational risks associated with certain of our operations producing GHG emissions. Although we have not yet experienced material difficulties in these areas, if we are unable to satisfy the increasing climate-related expectations of certain stakeholders, we may suffer reputational harm, which may cause the market price of our common shares to decrease, difficulty in accessing the capital or insurance markets or interference with our business operations and ability to make capital expenditures. For further information, please see our risk factor titled Increasing scrutiny and activism from stakeholders and regulators with respect to ESG matters, including those most relevant to the cement industry, could impact our reputation and the cost of our operations which could adversely affect our business and results of operations.
Any of the above risks may also impact our customers or suppliers, which could augment existing or result in different risks, including risks that may not yet be known to us.
Our operations are subject to special hazards that have caused in the past and may cause in the future personal injury or property damage, subjecting us to liabilities and possible losses, some of which may not be covered by insurance.
Hauling and ready-mix trucks, particularly when loaded, expose our drivers and others to traffic hazards. Our drivers are subject to the usual hazards associated with providing services on construction sites, while our plant personnel are subject to the hazards associated with moving and storing large quantities of heavy raw materials. Operating hazards can cause personal injury and loss of life, damage to or destruction of property, plant and equipment and environmental damage, and such hazards have in the past, and could result in the future, with us being named in the litigation in the future. Liabilities for such events are difficult to assess and estimate due to unknown factors, including the severity of an injury, the determination of our liability in proportion to other parties, the number of incidents not reported and the effectiveness of our safety program. Provisions for losses are recognized when we have a legal or constructive obligation as a result of past events, it is probable that an outflow of resources will be required to settle the obligation and a reliable estimate of the amount can be made. If we were to experience claims or costs above our estimates, we might also be required to use working capital to satisfy these claims rather than using the working capital to maintain or expand our operations.
We maintain insurance coverage in amounts and against the risks we believe are consistent with industry practice, but this insurance may not be adequate to cover all losses or liabilities we may incur in our operations.
39
Table of Contents
Our insurance policies are subject to varying levels of deductibles. Where we expect to be reimbursed under an insurance contract, the reimbursement is recognized as a separate asset but only when reimbursement is virtually certain.
We are subject to certain operational risks, including risks regarding safety at work.
Cement production and the operation of quarries can be a hazardous industry, and factors outside our control, such as weather and temperature, can increase the risks related to cement production and operation of quarries. Although we have strict safety policies and training programs intended to systematically educate employees on safety as well as detailed procedures and systems, these programs may fail to prevent all such accidents and, as a result, we have been and could be in the future subject to administrative or legal proceedings arising as a result of breaches of health and safety by our employees, any of which may have an adverse effect on our operations and reputation. The cement production process also generates environmental impacts, including dust, noise or other pollutants, and may require the storage of waste materials. Contamination resulting from waste materials or significant dust, noise or other pollution from site operations could also have the potential of affecting our employees, communities and the environment near our operations, and also negatively affect our business, results of operations and financial condition.
Our customer relationships are not generally governed by long-term agreements, and, as a result, such customers have the right to change the terms under which they do business and/or terminate their relationship with us.
The bulk of our customer relationships are not generally governed by long-term agreements. Consequently, despite the length of our relationships with these customers and our low historical customer turnover rates, there can be no assurance that our customer base will remain stable in the future. If our customers do not renew orders, our business, financial position, results of operations and cash flows could be negatively affected.
Relationships with our customers are based on and involve a high degree of trust that the customer(s) will continue to transact with us for a long period of time. However, under certain of these agreements, we would have no recourse against certain customers if they determined to terminate the agreement or they utilized other service providers that may compete with us. These customers could additionally underperform, not perform at all under these agreements and even walk away entirely. Our lack of recourse and ability to prevent customers from walking away from our agreements could have a material effect on our financial performance.
Our business is based in part on government-funded infrastructure projects and building activities, and any reductions or reallocation of spending or related subsidies in these areas could have an adverse effect on us.
We often serve as a subcontractor and depend on government spending for infrastructure and other similar building activities. As a result, demand for some of our products is influenced by local, state and federal government fiscal policies, tax incentives and other subsidies and other general macroeconomic and political factors. Projects in which we participate may be funded directly by governments or privately funded but are otherwise tied to or impacted by government policies and spending measures.
Government spending is often approved only on a short-term basis and some of the projects in which our products are used require longer-term funding commitments. If government funding is not approved or funding is lowered as a result of poor economic conditions, lower than expected revenues, competing spending priorities or other factors, it could limit infrastructure projects available, increase competition for projects, result in excess inventory and decrease sales, all of which could adversely affect our profitability.
Additionally, certain regions or states may require or possess the means to finance only a limited number of large infrastructure projects and periods of high demand may be followed by years of little to no activity. There can be no assurances that governments will sustain or increase current infrastructure spending and tax incentive and other subsidy levels, and any reductions thereto or delays therein could affect our business, liquidity and financial condition and results of operations.
40
Table of Contents
If we are unable to accurately estimate the overall risks, requirements or costs when we bid on or negotiate contracts that are ultimately awarded to us, we may achieve lower than anticipated profits or incur contract losses.
Even though the majority of our contracts for public projects as a subcontractor contain raw material escalators to protect us from certain input material price increases, a portion of the contracts are often on a fixed cost basis. The costs incurred and profit realized, if any, on our contracts can vary, sometimes substantially, from our original projections due to a variety of factors, including, but not limited to: failure to include materials or work in a bid, or the failure to estimate properly the quantities or costs needed to complete a lump sum contract; delays caused by weather conditions or otherwise failing to meet scheduled acceptance dates; contract or project modifications or conditions creating unanticipated costs that are not covered by change orders; changes in availability, proximity and costs of materials, including cement, aggregates and other construction materials (such as stone, gravel, sand and oil for asphalt paving), as well as fuel and lubricants for our equipment; to the extent not covered by contractual cost escalators, variability and inability to predict the costs of purchasing coal, diesel, natural gas and cement; availability and skill level of workers; fraud, theft or other improper activities by our suppliers, subcontractors, designers, engineers, customers or our own personnel; failure by our suppliers, subcontractors, designers, engineers or customers to perform their obligations; mechanical problems with our machinery or equipment; citations issued by any governmental authority, including the Occupational Safety and Health Administration (OSHA) and Mine Safety and Health Administration (MSHA); difficulties in obtaining required governmental permits or approvals; changes in applicable laws and regulations; uninsured claims or demands from third parties for alleged damages arising from the design, construction or use and operation of a project of which our work is part; and public infrastructure customers may seek to impose contractual risk-shifting provisions more aggressively which may result in us facing increased risks.
These factors, as well as others, may cause us to incur losses, which could have a material adverse effect on our financial condition, results of operations and liquidity.
Our industry is capital intensive, and we have significant fixed and semi-fixed costs. Therefore, our profitability is sensitive to changes in volume.
The property and machinery needed to produce our products can be very expensive. Therefore, we need to spend a substantial amount of capital to purchase and maintain the equipment necessary to operate our business. Although we believe that our current cash balance, along with our projected internal cash flows and our available financing resources, will provide sufficient cash to support our currently anticipated operating and capital needs, if we are unable to generate sufficient cash to purchase and maintain the property and machinery necessary to operate our business, we may be required to reduce or delay planned capital expenditures or incur additional debt. In addition, given the level of fixed and semi-fixed costs within our business, particularly at our cement production facility, decreases in volumes could negatively affect our financial position, results of operations and liquidity.
An inability to successfully identify, consummate and integrate acquisitions, divestitures and other significant transactions could have an adverse impact on our business and financial results.
A portion of our historical growth has occurred through acquisitions, and we will likely execute acquisition transactions in the future. Acquisitions involve risks including, among other things, that the businesses acquired will not perform as expected. We are presently evaluating, and we expect to continue to evaluate on an ongoing basis, possible acquisition transactions. We are presently engaged, and at any time in the future we may be engaged, in discussions or negotiations with respect to possible acquisitions, including larger transactions that would be significant to us. We regularly make, and we expect to continue to make, non-binding acquisition proposals, and we may enter into letters of intent, in each case allowing us to conduct due diligence on a confidential basis. There can be no assurances that we will be able to recover the current carrying amount of our investments, and in some circumstances, assets or businesses may result in additional impairment expenses or other losses. In addition, we may become subject to certain contractual indemnity or other obligations or may fail
41
Table of Contents
to successfully deploy sale proceeds. We cannot predict the timing of any contemplated transactions. To successfully acquire a significant target, we may need to raise additional capital through additional equity issuances, additional indebtedness or a combination of equity and debt issuances. Our results of operations from these acquisitions could, in the future, result in impairment charges for any of our intangible assets, including goodwill or other long-lived assets, particularly if economic conditions worsen unexpectedly. As a result of these changes, our financial condition, results of operations and liquidity could be materially adversely affected. There can be no assurance that we will enter into definitive agreements with respect to any contemplated transactions or that they will be completed. Our acquisitions and portfolio optimization efforts have placed, and may continue to place, significant demands on our management and operational and financial resources.
Acquisitions may require integration of the acquired companies sales and marketing, distribution, production, purchasing, information technology, finance and administrative organizations. We may not be able to integrate successfully any business we may acquire or have acquired into our existing business and any acquired businesses may not be profitable or as profitable as we had expected. Factors affecting the successful integration of acquired businesses include, but are not limited to, the following: we may become liable for certain, and potentially significant, liabilities of any acquired business, whether or not known to us; substantial attention from our executive management and the management of the acquired business may be required, which could decrease the time that they have to service and attract customers; capital equipment at acquired businesses may require additional maintenance or need to be replaced sooner than we expected; the complete integration of acquired companies depends, to a certain extent, on the full implementation of our financial systems and policies; and the ability to retain key employees. Our inability to complete the integration of new businesses in a timely and orderly manner could increase costs and lower profits.
A lowering or withdrawal of the ratings, outlook or watch assigned to our business or our debt by rating agencies or the credit rating of Titan Cement International may increase our future borrowing costs and reduce our access to capital.
Titan Cement International both provides intercompany loans to us and guarantees our third-party debt. Any change in the credit rating of Titan Cement International, which is out of our control, could have a material adverse effect on our ability to borrow and our cost of capital.
The rating, outlook or watch assigned to Titan Cement International or to our debt could be lowered or withdrawn entirely by a rating agency if, in that rating agencys judgment, current or future circumstances relating to the basis of the rating, outlook or watch such as adverse changes to Titan Cement Internationals or our business, so warrant. Additionally, we do not have credit history without the guarantee of Titan Cement International. Without an operating history, we may be unable to or find it difficult to obtain our own credit score. Our credit ratings may also change as a result of the differing methodologies or changes in the methodologies used by the rating agencies. Any future lowering of our debts ratings, outlook or watch likely would make it more difficult or more expensive for us to obtain debt financing.
Holders of our common shares will have no recourse against us or any other parties in the event of a change in or suspension or withdrawal of such ratings. Any lowering, suspension or withdrawal of such ratings may have a material adverse effect on the market price or marketability of our common shares.
Our ability to repay or refinance our indebtedness on time and distribute dividends and share capital to our shareholders depends upon our future cash flows from operations, as well as prevailing market conditions.
Our indebtedness primarily consists of intercompany loans, short-term bank borrowings and lease liabilities.
Our ability to make payments on and refinance our indebtedness and to fund working capital, capital expenditures and other expenses will depend on our future operating performance and ability to generate cash from operations. Our ability to generate cash from operations is subject, in large part, to general economic,
42
Table of Contents
competitive, legislative and regulatory factors and other factors that are beyond our control. We may not be able to generate sufficient cash flow from operations or obtain enough capital to service our debt or fund our planned capital expenditures.
Similarly, we are a holding company and our ability to repay our debt, pay dividends or make other contributions to our shareholders depends on our subsidiaries ability to pay cash to us pursuant to dividend payments and/or other obligations. The ability of our subsidiaries to pay dividends to us in the future will depend on their earnings, covenants contained in future financing or other agreements and on regulatory restrictions. Similarly, we may be unable to distribute dividends in order to maintain our credit rating and avoid any potential credit downgrade. Thus, we may not have sufficient funds to pay our debt or distribute dividends.
Our ability to refinance our debt will depend in part on our financial position at such time. Any refinancing of our debt could be at higher interest rates than our current debt and may require us to comply with more onerous covenants, which could further restrict our business operations. In particular, certain intercompany loans and credit facilities with TGF, are based on financial terms contained in the arms length agreements consummated among TGF and its third party lenders. There is no guarantee that TGF will be willing to continue to enter into debt agreements with us on similar terms or at all. Refinancing such debt with third parties may increase our cost of capital and may subject us to more onerous covenants. The terms of existing or future debt instruments may restrict us from adopting some of these alternatives.
The economic environment has in the past been marked by a scarcity of financing for periods of time, in particular with regard to long-term financing. If financial and economic conditions were to deteriorate, including as a result of political and economic uncertainty or instability, or if interest rates were to increase, it may be more costly and more difficult for us to access new credit or to refinance our debts on terms that are acceptable to us, or at all. This could have a material adverse effect on our business, results of operations and financial condition.
We are exposed to risk of loss resulting from the nonpayment and/or nonperformance by our customers and counterparties.
Our customers include public and private entities that have been, and may continue to be, negatively impacted by the changing landscape in the global economy. A recessionary construction economy can increase the likelihood that we will not be able to collect on all accounts receivable or may experience a delay in payment from some customers. If our customers or counterparties experience financial difficulties, which has occurred and may reoccur, we could experience difficulty in collecting receivables. We face collection risk as a normal part of business where we perform services and subsequently bill clients for such services. In the event that we have concentrated credit risk from clients in a specific geographic area or industry, continuing negative trends or a worsening in financial conditions in that specific geographic area or industry could make us susceptible to disproportionately high levels of default. Nonpayment and/or non-performance by our customers and counterparties could have a negative impact on our results of operations and cash flows.
Fluctuations in foreign exchange rates may have an adverse effect on our business.
We have foreign exchange rate risk as a result of euro-denominated fixed-rate loans and short-term euro-denominated variable rate loans. We enter into foreign exchange derivatives with notional amounts closely aligned with the underlying borrowings, but cannot be assured that our hedging will adequately protect us against foreign exchange fluctuation risk. If the U.S. dollar weakens as compared to the euro, our cost of capital will increase, and our business may be adversely affected.
We are subject to impairment losses related to non-financial assets.
The cement, aggregates and, to a lesser extent, other construction materials business is capital intensive. Due to the heavy weight of the product and our high distribution costs, shifts in local markets and/or product ranges might lead to impairment of the assets concerned as the investment in those assets may not yield the return that was expected when the investment was made. Impairment losses impact negatively on profitability and equity.
43
Table of Contents
We may fail to retain and attract qualified and skilled employees, including management, engineering and technical personnel, or fail to maintain satisfactory labor relations with our unions.
While we aim to attract and retain the best possible candidates from domestic and international markets, we may be unable to recruit and retain experienced, capable and reliable personnel, especially senior and middle management and skilled technical personnel with appropriate professional qualifications. If members of our executive management team were to depart, we might not be able to implement a successful succession program in a timely manner, if at all. Additionally, without a sufficient number of skilled employees, our operations and manufacturing quality could suffer. The resulting labor shortages, as well as competition from other industries, or other factors, could increase our labor costs and could negatively affect our results of operations.
From time to time, we enter into discussions and collective bargaining agreements with labor unions, which represent less than five percent of our workforce as of September 30, 2024. Although we maintain good relations with our unions and have not faced a material strike that affected our operations, there can be no assurance that we will not experience labor unrest, difficulty in negotiating collective bargaining agreements or disputes or actions in the future, some of which may be significant and could adversely affect our business, prospects, financial condition, reputation and results of operations.
Artificial intelligence presents risks and challenges that can impact our business by posing security risks to our confidential information, proprietary information and personal data.
Issues in the development and use of artificial intelligence, combined with an uncertain regulatory environment, may result in reputational harm, liability or other adverse consequences to our business operations. As with many technological innovations, artificial intelligence presents risks and challenges that could impact our business. We work with vendors that incorporate artificial intelligence tools into their offerings and the providers of these artificial intelligence tools may not meet existing or rapidly evolving regulatory or industry standards with respect to privacy and data protection and may inhibit our or our vendors ability to maintain an adequate level of service and experience. If we, our vendors, or our third-party partners experience an actual or perceived breach or privacy or security incident because of the use of generative artificial intelligence, we may lose valuable intellectual property and confidential information and our reputation and the public perception of the effectiveness of our security measures could be harmed. Further, bad actors around the world use increasingly sophisticated methods, including the use of artificial intelligence, to engage in illegal activities involving the theft and misuse of personal information, confidential information and intellectual property. Any of these outcomes could damage our reputation, result in the loss of valuable property and information and adversely impact our business.
Risks Related to the Reorganization Transactions and Our Relationship with Titan Cement International
We plan to rely on functions, systems and infrastructure provided by Titan Group, and if Titan Group fails to perform these transitional services we may fail to replicate or replace them.
Since our inception, we have received services from Titan Group and will continue to receive services under the Shared Services Agreement from Titan Group. Under the Shared Services Agreement, Titan Group has agreed to continue to provide us with certain services currently provided to us by or through Titan Group. The Shared Services Agreement does not continue indefinitely and will last for five years with an option to renew for additional two-year periods, and services provided under the Shared Services Agreement may generally terminate at various times specified in the agreement and the schedules thereto.
If Titan Group ceases to provide these services to us, either as a result of the termination of the Shared Services Agreement or individual services thereunder or a failure by Titan Group to perform its obligations under the Shared Services Agreement, our costs of performing or procuring these services or comparable replacement services could increase as a result of replicating the services ourselves or contracting with a third-party for the services at a higher cost.
44
Table of Contents
There is a risk that an increase in the costs associated with replicating and replacing the services provided to us by Titan Group prior to the Reorganization Transactions and under the Shared Services Agreement, or continuing to provide services to Titan Group, and the diversion of managements attention to these matters could have a material adverse effect on our business, results of operations, financial condition and liquidity. We may fail to replicate the services we currently receive from Titan Group on a timely basis, without interruption to or degradation of ongoing operations, or at all, which may put further constraints on our human resources, capital and other resources that are simultaneously working on the retention and replacement of the services and ongoing efforts to implement new technological developments and innovations; such additional constraints could jeopardize our ability to execute on any one of these specific work streams. In addition, Titan Group will be working on similar initiatives which may impact the level and quality of transition services we receive from them. Additionally, we may not be able to operate effectively if the transition to the replacement services causes interruptions to or degradation of operations or the quality of replacement services is inferior to the services we are currently receiving.
Titan Cement International and its subsidiaries are among our largest material and service providers, and we might have received better terms from unaffiliated third parties than under our agreements with Titan Cement International and its subsidiaries.
For the year ended December 31, 2023, our Parent was among our largest material and service providers supplying cement for our marine import terminals valued at $107.1 million and management services valued at $11.0 million. We expect that a substantial portion of our purchases will continue to be derived from Titan Cement International, and their inability to perform under their contracts, or their default in delivery or performance, could have a substantial effect on our operations, revenues and profits. There is no guarantee that we can replace these materials and services on commercially reasonable terms or at all. For additional information, refer to the section titled Certain Relationships and Related Party Transactions.
We may be affected by any negative effects on Titan Cement Internationals brand and reputation.
Our brand and reputation and that of our Parents within the construction sector in all areas and markets of operation are important intangible assets and could be affected by errors and/or omissions concerning product quality, adherence to health and safety standards, exposure to social media and other brand management measures and environmental performance. Such risks are amplified due to the strict standardization to which building materials are subject to and a failure to meet the prescribed quality standards or the specific quality requirements of our or Titan Cement Internationals, and our or its affiliates, customers could negatively affect our or our Parents reputations. Should Titan Cement International have a negative impact on its brand and reputation, it could hurt our brand or reputation in the marketplace if market participants connect us with our Parent. Moreover, given the international presence of our Parent, damage to our Parent or an affiliate of our Parents brand in one of the markets in which we operate could negatively affect our reputation in the markets in which they operate. Any damage to our or our Parents reputations may have a material adverse effect on our financial condition and results of operations.
If Titan Cement International sells a controlling interest in our Company to a third party in a private transaction, you may not realize any change-of-control premium on our common shares, and we may become subject to the control of a presently unknown third party.
Following the completion of this offering, Titan Cement International will continue to own a controlling equity interest in our Company. Titan Cement International will have the ability, should it choose to do so, to sell some or all of our common shares in a privately negotiated transaction, which, if sufficient in size, could result in a change of control of our Company.
Belgian law provisions on mandatory public takeover bids that are applicable to Belgian companies listed on a regulated market in the European Economic Area do not apply to us.
45
Table of Contents
The ability of Titan Cement International to privately sell our common shares, with no requirement for a concurrent offer to be made to acquire all of the common shares that will be publicly traded hereafter, could prevent you from realizing any change-of-control premium on your common shares that may otherwise accrue to Titan Cement International on its private sale. Additionally, if Titan Cement International privately sells its controlling interest in our Company, we may become subject to the control of a presently unknown third party. Such third party may have conflicts of interest with those of other shareholders. Titan Cement International may terminate the Shared Services Agreement, and our other commercial agreements and relationships could be impacted, all of which may adversely affect our ability to run our business as described herein and may have an adverse effect on our operating results and financial condition.
After the Reorganization Transactions, certain members of management, directors and shareholders hold common shares in both Titan America and Titan Cement International, and as a result may face actual or potential conflicts of interest.
After the Reorganization Transactions, the management and directors of each of Titan America and Titan Cement International may own both Titan America common shares and Titan Cement International common shares. This ownership overlap could create, or appear to create, potential conflicts of interest when Titan Americas management and directors and Titan Cement Internationals management and directors face decisions that could have different implications for Titan America and Titan Cement International. For example, potential conflicts of interest could arise in connection with the resolution of any dispute between Titan America and Titan Cement International regarding the terms of the agreements governing the Reorganization Transactions and the relationship with Titan Cement International thereafter. These agreements include the Shared Services Agreement and any commercial agreements between the parties or their affiliates. Potential conflicts of interest may also arise out of any commercial arrangements that Titan America or Titan Cement International may enter into in the future. Although we have procedures to minimize potential conflicts of interest, these procedures may not adequately address all of the conflicts of interest that may arise with respect to our activities with Titan Cement International, and any conflicts of interest may not be resolved in Titan Americas interests. See Conflicts of interest and disputes may arise between Titan Cement International and us that could be resolved in a manner unfavorable to us.
Under Belgian company law, the directors of Titan America are subject to a general duty of loyalty, pursuant to which they are always required to act in Titan Americas interests, regardless of whether or not they have been appointed by a shareholder of Titan America (such as Titan Cement International). Directors are always required to put the interests of the company in which they serve above their own interests in the exercise of their mandate.
The directors of Titan America will be subject to the rules under Belgian company law on financial conflicts of interest (article 7:96 of the Belgian Code on Companies and Associations) when such director would have a personal financial conflict of interest with Titan America, be it directly or indirectly, with regard to any contemplated decision under the powers of the board of directors. Under these rules, it is required that (i) the conflicted director discloses his or her conflict prior to the board of directors resolving on the conflicted decision, (ii) the declaration and clarification as to the nature of the conflicting interest declared by the conflicted director(s) is included in the meetings minutes, (iii) the board (consisting of the non-conflicted directors) sets out the contemplated decision or transaction, its financial consequences and justifies the contemplated decision or transaction. In resolving on the conflicted decisions, directors with a financial conflict are prohibited from taking part in both the deliberation as well as the decision-making on the conflicted decision.
In cases where all directors of Titan America would be conflicted with regard to a certain resolution, said resolution will be escalated to the shareholders meeting of Titan America for shareholder approval (under a simple majority vote). If the shareholders meeting approves the resolution, the board of directors will be able to carry out the approved resolution on behalf of Titan America.
Titan Americas annual report, as well as the yearly report prepared by Titan Americas statutory auditor, will contain certain information about the application of the conflicts of interest procedure during the financial year.
46
Table of Contents
General Belgian company law does not contain any provisions that seek to prevent directors from voting or deliberating on matters in which they would have a functional conflict of interest (which could, for example, arise due to cross-directorships). Given that Titan America does not qualify as a listed company for the purposes of Belgian company law, the procedure under Belgian law that relates to transactions with related parties, as set out in article 7:97 of the Belgian Code on Companies and Associations, will not apply to Titan America as regards any transaction with a related party (under International Account Standards (IAS) 24).
Belgian law offers no express protection against conflicts of interest at the level of Titan Americas management.
Risks Related to Geological, Mining and Environmental Matters
Our operations are subject to environmental, health and safety laws and regulations that may increase costs, impact or limit business plans or expose us to environmental liabilities.
Our operations are subject to extensive environmental, health and safety (EHS) laws and regulations, as interpreted by the relevant governmental agencies and the courts, in the jurisdictions in which we operate. Such regulations affect many aspects of our operations and may impose increasingly stringent obligations and restrictions regarding, among other things, land use, permitting, remediation, mine reclamation, operation and closure of landfills, air emissions, the generation, transportation and disposal of solid waste and hazardous substances, contamination, water quality, wastewater discharge and other environmental considerations, as well as mine safety and occupational and community health and safety. The costs of complying with these laws and regulations are likely to increase over time and a failure to comply with these laws and regulations may result in the assessment of sanctions, including administrative, civil or criminal penalties, natural resource damages, the imposition of investigatory or remedial obligations, and the issuance of orders limiting or prohibiting some or all of our operations. For a description of specific environmental and health and safety laws and regulations applicable to operations, see Our business may face certain risks related to geological and mining, water management, solid waste, air quality, permitting and regulatory schemes, which could adversely impact our operations and financial position and We are subject to health and safety laws and regulations and any failure to comply with any current or future laws or regulations could have a material adverse effect on us.
The nature of certain of our business activities exposes us to risks of environmental costs and liabilities arising from the importing, manufacture, use, storage, disposal, maritime and inland transport and sale of products, raw materials, wastes, byproducts and fuels that may be regulated or considered to be contaminants when released into the environment from our properties and stormwater. Environmental laws and regulations may impose investigation and remediation obligations, require us to install pollution control equipment at our facilities, clean up spills and other contamination and correct environmental hazards, including payment of all or part of the cost to remediate sites where our past activities, or the activities of other parties, caused environmental contamination. Liability or other investigation and remediation obligations may also arise through certain transactions, including the acquisition, divestiture or ownership or operation of properties and businesses, especially properties or operations where hazardous materials were used historically. We have sold properties and businesses pursuant to agreements which include indemnification and cost sharing provisions related to the assets that were divested. Consequently, we will continue to be subject to risks under environmental laws that impose investigation and remediation obligations or liability for historical releases of hazardous substances at existing sites or ones for which we have indemnity obligations.
In addition, our operations require numerous governmental approvals and permits. Environmental operating permits are subject to modification, renewal and revocation and can require us to make capital, maintenance and operational expenditures to comply with the applicable requirements. New environmental initiatives or permit program requirements, public opposition to permits, or changes in interpretation of existing laws and regulations, could result in significant additional expenditures (including capital expenditures, investment in new plant facilities or improvements to existing plants) or reduction or termination of certain operations, which may, in turn, have a material adverse effect on our financial condition and results of operations. Noncompliance with EHS permits laws and regulations could subject our operations to regulatory enforcement, including the imposition of civil and/or criminal penalties, and even the partial or total shutdown of operations.
47
Table of Contents
Some environmental laws impose substantial penalties for noncompliance, and others, such as the federal Comprehensive Environmental Response, Compensation, and Liability Act (CERCLA), the Resource Conservation and Recovery Act (RCRA), or similar state laws, may impose strict, retroactive and joint and several liabilities for the remediation of releases of hazardous substances. Liability under CERCLA, RCRA or similar state and local laws, may be imposed as a result of conduct that was lawful at the time it occurred or for the conduct of, or conditions caused by, prior operators or other third parties. Failure to properly handle, transport, store or dispose of hazardous materials or otherwise conduct our operations in compliance with RCRA and other EHS laws or similar state and local laws could expose us to liability for governmental penalties, cleanup costs and civil or criminal liability associated with releases of such materials into the environment, damages to property, natural resources and other damages, as well as potentially impair our ability to conduct our operations.
EHS laws and regulations continue to evolve and are becoming increasingly stringent. Future EHS laws and regulations could restrict our ability to expand our facilities or extract materials from our quarries or could require us to acquire costly equipment or to incur other significant expenses in connection with our business. Future events, including adoption of new, or changes in any existing, EHS requirements (or their interpretation or enforcement) and the costs associated with complying with such requirements, could have a material adverse effect on us. The ultimate impact of complying with such laws and regulations is not always clearly known or determinable because regulations under some EHS laws have not yet been promulgated, some are the subject of ongoing litigation or are undergoing revision and new versions or interpretations of existing laws may take effect.
As a result, we cannot assure you that any costs relating to future capital and operating expenditures to maintain compliance with EHS laws, as well as costs to address contamination or environmental claims, will not exceed any current estimates and reserves or adversely affect our business, financial position, results of operations and cash flows. In addition, any unanticipated liabilities or obligations arising, for example, out of the discovery of previously unknown conditions or changes in law or enforcement policies, could materially and adversely affect our business, financial position, results of operations and cash flows.
Our business may face certain risks related to geological and mining, water management, solid waste, air quality, permitting and regulatory schemes, which could adversely impact our operations and financial position.
Geological and Mining Environmental Risks
The rock underlaying quarries and associated plants includes materials at risk of forming voids or sinkholes. Surface disturbances such as sinkholes can interrupt operations and increase the risk of releases directly to groundwater. Quarry blasting may produce dust, seismic and noise impacts beyond our property line with risks of meeting regulatory limits. In addition, we have from time to time been subject to complaints alleging nuisance and property damage related to blasting activities.
Such blasting activities at our open quarries create risks of fugitive dust impacts affecting visibility and groundwater contamination from components of the explosives we use and from mechanical equipment we operate using oil, lubricants or fuels. Some of our quarries operate adjacent to public drinking water supplies under more restrictive requirements. In addition, some quarries store and manage water we use to provide process water and cooling water to co-located equipment. Also, disruption of mechanical systems and synthetic liners for these ponds can cause releases, flood property and curtail significant operations at the co-located sites.
Reclamation and Post-Closure Obligations
We incur post-closure obligations to reclaim quarry sites and other similar post-closure obligations for owned and leased property. Reclamation methods and requirements can differ depending on the quarry and state rules and regulations in existence for certain locations. This differentiation affects the potential obligation required at each individual site. Please refer to Note 21 to our audited consolidated financial statements included elsewhere in this prospectus for further information about restoration, environmental and remediation provisions.
48
Table of Contents
Water Management Risks
The Clean Water Act (CWA) and analogous state laws impose restrictions and strict controls with respect to the discharge of pollutants, including spills and leaks of oil and other substances, into state waters or waters of the United States. The discharge of pollutants into regulated waters is prohibited, except in accordance with the terms of a permit issued by the U.S. Environmental Protection Agency (EPA) or an analogous state agency. The CWA and regulations implemented thereunder also prohibit the discharge of dredge and fill material into regulated waters, including jurisdictional wetlands, unless authorized by the U.S. Army Corps of Engineers (USACE) pursuant to an appropriately issued permit. In addition, the CWA and analogous state laws require individual permits or coverage under general permits for discharges of stormwater runoff from certain types of facilities.
Our operations store and use chemicals and fuels with the risk of exposure to surface or groundwater. These operations include both storage tanks and fuel-burning equipment and are present at coastal terminals and inland operations. Additionally, some operations generate process wastewater. Both weather events and mechanical equipment failure can result in onsite or offsite releases. Lastly, risks exist from mechanical equipment failure for our stormwater management and treatment systems. A release from any of these systems can result in temporary interruption of operations and additional costs for new mitigation equipment.
Some operations are sited within basins of waterways designated with an impaired waters listing by state authorities. Impaired water mitigation planning is led by local authorities and includes monitoring of water quality, submerged lands and on-site sediment sampling. Compliance with the CWA and any new rules and legislation could require us to face increased costs and delays with respect to obtaining permits for expansion activities. Federal and state regulatory agencies can impose administrative, civil and criminal penalties as well as other enforcement mechanisms for non-compliance with discharge permits or other requirements of the CWA and analogous state laws and regulations.
Solid and Hazardous Waste Risks
Principal non-product material streams from our largest sites includes cement kiln dust (CKD), a by-product of our cement production operations. We may become subject to potential U.S. environmental legislation regulating discarded impoundments and landfills of CKD. The U.S. EPA has been evaluating the regulatory status of CKD under RCRA and certain environmental groups have asked the U.S. EPA to regulate discarded CKD as a hazardous waste. Although legislation related to CKD has not yet been implemented, any obligation to manage CKD as a hazardous waste under RCRA would negatively affect our operations.
Our operating landfills are bound with closure plans and post-closure monitoring. Monitoring activity below the surface may not completely foresee risks associated with waste, leachate and groundwater interaction. Post-closure monitoring may identify conditions that trigger additional mitigation costs including potential linings and removal. Please refer to Note 21 to our audited consolidated financial statements included elsewhere in this prospectus for further information about restoration, environmental and remediation provisions.
Risks from the generation of waste include onsite and offsite spills. Our over the road and rail transport systems can spill product from moving accident or infrastructure failures. Off-site spills of our products increase risks of contamination of public and private property, impacting our distribution costs.
As discussed above, liability under CERCLA, or similar state and local laws, may be imposed as a result of conduct that was lawful at the time it occurred or for the conduct of, or conditions caused by, prior operators or other third parties. Failure to properly handle, transport, store or dispose of hazardous materials or otherwise conduct our operations in compliance with environmental laws could expose us to liability for governmental penalties, cleanup costs and civil or criminal liability associated with releases of such materials into the environment, damages to property, natural resources and other damages, as well as potentially impair our ability to conduct our operations.
49
Table of Contents
Air Quality Risks
Our operations are subject to the federal Clean Air Act (CAA) and related state and local laws, which restrict the emission of air pollutants and impose permitting, monitoring and reporting requirements on various sources. Over the next several years, we may be required to incur certain capital expenditures for air pollution control equipment or to address other air emissions-related issues. Changing and increasingly stringent requirements, future non-compliance or failure to maintain necessary permits or other authorizations could require us to incur substantial costs or suspend or terminate our operations. We aim to mitigate air quality risks for compliance requirements with engineering design, mechanical equipment, operating procedures and monitoring equipment; however, such measures can fall short of mitigating all risks.
Future emission standards that may apply to our operations include the National Emission Standards for Hazardous Air Pollutants (NESHAP) for Portland cement. Although the U.S. EPA concluded a technological review of Portland cement under NESHAP in 2018, and concluded that no new requirements or changes to emission limits were warranted at that time, the U.S. EPA is scheduled to finalize new emission limitations and other potential requirements in 2025. These regulations apply to a portion of our cement operations. There can be no assurance that future requirements will not potentially increase our compliance costs and adversely affect our operating performance and profitability. Similarly, additional future emission standards to protect the ozone through increasingly stringent National Ambient Air Quality Standards (NAAQS) may be finalized and add costs for NOx emission control.
The EPAs regulations also target GHG emissions from industrial sources identified by the EPA as large GHG emission sources, including cement manufacturing. Since December 29, 2009, the EPAs Mandatory Reporting of GHGs Rule requires certain industrial sectors exceeding certain emission thresholds to report their GHG emissions annually. In 2010, the EPA set GHG thresholds for the New Source Review Prevention of Significant Deterioration (PSD) and Title V Operating Permit programs for facilities with emissions above certain thresholds. Cement plants must obtain these permits if they exceed the limits, and new major sources or significant modifications at major sources must secure pre-construction permits that include pollution limits based on Best Available Control Technology (BACT). Applying for, complying with, reporting under, renewing and maintaining these permits can involve significant costs and delays.
Similarly, the GHG regulations for electric utilities under the CAA were finalized in 2024 though may become stayed by court orders pending the resolution of ongoing legal actions, including recent challenges to the 2024 final rule regulating GHG emissions from new, modified and reconstructed fossil fuel-fired power plants. The ultimate disposition of the GHG regulations for the electric utilities will set precedent for what may come for other industries (including cement) in subsequent regulatory action. The imposition of GHG regulations on the cement industry would negatively affect our operations and could result in higher capital and operating expenditures to comply with such regulations, any of which would adversely affect our operating performance and profitability.
Mechanical failure of pollution control equipment may result in offsite impacts including dusting episodes that expose the public to contaminants exhausts by our processes. Other operations that use procedures to mitigate impacts may cause offsite impacts of air pollutants during periods of high wind or heavy traffic periods.
Any such developments could have an adverse effect on our business, financial position, results of operations and cash flows.
Permitting Risks
In addition to the risks of actual releases, public opposition to environmental permits presents a significant risk to the business. Public opposition to environmental permits reflects our case-by-case engagements and the permit preparations by the regulatory authority. Public opposition has the potential to overwhelm viability of a capital project and lead to cancelling improvements or expansions of operations.
50
Table of Contents
For example, the implementation of the 2024 NAAQS for fine particulate (PM2.5) will authorize local permit authorities to increase regulation on PM2.5 emissions. The implementation will encourage more source testing and air sampling from our sources and in our communities, respectively. These air pollution studies may result in new requirements of our sites including new or modified mitigation equipment or ambient monitoring equipment. NAAQS implementation is a regulatory process performed under public review. Public disclosure of air pollution studies also carries potential reputational risk.
There can be no assurance that future approvals, licenses and permits will be granted or that we will be able to maintain and renew the approvals, licenses and permits we currently hold. Failure to do so could have a material adverse effect on our results of operations and cash flows. Furthermore, compliance with environmental permitting and approval requirements may be costly and time consuming and could result in delays or other adverse impacts on planned projects, our results of operations and cash flows.
Additional Regulatory Risks
Connected to GHG and Environmental, Social and Governance (ESG) risks are potential environmental or pollution tariffs on materials we import. Both legislative and executive branches of the U.S. government have proposed or are striving to propose tariff programs to penalize imports of cement and other products from countries with higher GHG emissions per unit of production. These programs would potentially level significant tariffs on imports to our cement distribution networks.
Moreover, there can be no assurance that a scheme similar to the EU-wide cap and trade emissions scheme, namely the European Trading Scheme, will not be introduced in the United States or at the state level in jurisdictions in which we operate, potentially significantly increasing our compliance costs. Further, there may be increasing political support for the implementation of other stringent environmental rules that would increase our production costs. Compliance with changes in laws, regulations or emissions trading schemes could result in higher capital expenditures requirements and reduced profitability for us due to increased production costs and may also have an impact on our ability to grow our business, pursue strategic growth opportunities and remain competitive. If we are unable to find solutions that reduce our GHG emissions for new and existing projects or products, future international agreements, government regulation or challenges from society could lead to additional costs as well as compliance and operational risks.
Both tariff and trading scheme programs include higher monitoring and public disclosure of GHG emissions. These disclosures present additional reputational risks to us.
Due to the uncertain availability of technologies to control GHG emissions and the unknown obligations that potential GHG emission legislation or regulations may create, we cannot determine the potential financial impact on our operations. In addition, the increasing focus on climate change and stricter regulatory requirements may result in our business facing adverse reputational risks associated with certain of our operations producing GHG emissions. Although we have not experienced material difficulties in these areas, if we are unable to satisfy the increasing climate-related expectations of certain stakeholders, we may suffer reputational harm, which may cause our stock price to decrease or difficulty in accessing the capital or insurance markets. Such efforts, if successfully directed at us, could increase the costs of or access to capital or insurance and interfere with business operations and ability to make capital expenditures.
Increasing scrutiny and activism from stakeholders and regulators with respect to ESG matters, including those most relevant to the cement industry, could impact our reputation and the cost of our operations which could adversely affect our business and results of operations.
Stakeholder actions and increased regulatory activity related to environmental, social and governance matters, including climate change and reducing GHG emissions, diversity, equity, and inclusion (DEI), biodiversity and natural capital, water stewardship, circular economy, responsible supply chain, human rights, and other matters could adversely impact our operations, costs of or access to capital and impact or limit business plans.
51
Table of Contents
We could face stakeholder scrutiny and activism related to ESG. There has been an increased focus from stakeholders and regulators related to ESG matters across all industries in recent years, with investors (including institutional investors), proxy advisory firms, customers, employees and lenders placing increasing importance on the impacts and social cost associated with climate change, as well as ESG practices and policies of companies, including sustainability performance and risk mitigation efforts. There is also risk that we could be perceived as, or accused of, greenwashing, i.e., the process of conveying misleading information or making false claims regarding the ESG profile of, e.g., a product, activity, or company operations, which could lead to reputational harm, litigation, or other adverse impacts. In particular, actions or statements we take may be based on expectations, assumptions, methodologies, or information that we currently believe to be reasonable but that is subsequently determined to be erroneous or not in keeping with best practice, particularly as ESG standards continue to evolve. If we fail to, or are perceived to fail to, to advance our ESG initiatives or to align with best practices, we may be subject to various adverse impacts. For example, both we and the Titan Group have implemented various voluntary initiatives to improve the ESG profile of our operations and products; however, such initiatives may be costly and may not have the desired effect. Our emissions reduction goals are ambitious and subject to various contingencies, calculations and, in certain cases, the actions of third-parties. As such, we may not achieve them, either according to specific standards or stakeholder expectations and timelines, or at all. Achieving our emission reduction goals depends in significant part on the adoption of Lower-Carbon Cement and other less carbon-intensive products by our customers, which may be impacted by cost, regulatory restrictions, customers own perception on the sustainability of our products, or other factors.
In addition, some investors use ESG criteria to guide their investment strategies, and may not invest in our common shares, or may divest their holdings of our common shares, if they believe our policies relating to ESG matters are inadequate or, on the other hand, have a negative response to such policies as a result of anti-ESG sentiment. Customers and other stakeholders may also make similar determinations. Concern that GHG emissions contribute to global climate change has led to international, federal, state and local legislative and regulatory proposals to reduce or mitigate the effects of GHG emissions. We monitor, analyze and report GHG emissions from our operations and products as required by applicable laws and regulations and to satisfy customer inquiries. We will continue to monitor GHG regulations and their potential impact on operations.
The cement industry is under increasing regulatory pressure to reduce carbon emissions and achieving significant emissions reductions may involve high costs and technical challenges associated with carbon capture and storage. Due to the uncertain availability of technologies to control GHG emissions and the unknown obligations that potential GHG emission legislation or regulations may create, we cannot determine the potential financial impact on our operations.
In addition, the increasing focus on climate change and stricter regulatory requirements may result in our business facing adverse reputational risks associated with certain of our operations producing GHG emissions. Although we have not yet experienced material difficulties in these areas, if we are unable to satisfy the increasing climate-related expectations of certain stakeholders, we may suffer reputational harm, which may cause the market price of our common shares to decrease, difficulty in accessing the capital or insurance markets or interference with our business operations and ability to make capital expenditures. Simultaneously, some stakeholders and policymakers are looking to reduce consideration of climate and ESG factors, which could impact the degree to which customers purchase less carbon-intensive products. Navigating these competing interests is complex, and failure to successfully do so may adversely impact our business. Any of the above risks may also impact our customers or suppliers, which could augment existing or result in different risks, including risks that may not yet be known to us.
We are subject to a series of risks regarding ESG regulation.
We expect there will likely be increasing levels of regulation, disclosure-related and otherwise, with respect to ESG matters. For example, policymakers such as the SEC and European Union have adopted, and other policymakers such as the Federal Acquisition Regulatory Council and the State of New York are considering adopting, requirements for significant additional disclosures of climate- or other sustainability-related
52
Table of Contents
information. For instance, the European Commission has established the Corporate Sustainability Reporting Directive (the CSRD), which will require in-scope companies to report on a number of sustainability topics in accordance with the European Sustainability Reporting Standards. We may be considered an in-scope company if we are no longer a subsidiary of the Titan Group and may then be subject to such reporting requirements. Our current programs, reporting frameworks and principles may not be in compliance with any new environmental and social laws and regulations, or novel interpretations of existing laws and regulations, that may be promulgated in the United States and elsewhere. Such regulation may therefore require us to incur substantial costs or otherwise make changes for compliance, and any noncompliance may result in investigations, fines, termination of contracts or other adverse impacts.
Risks Related to Regulatory and Legal Matters
We are subject to health and safety laws and regulations and any failure to comply with any current or future laws or regulations could have a material adverse effect on us.
Manufacturing and construction sites are inherently dangerous workplaces. Our sites often put our employees and others in close proximity with large pieces of mechanized equipment, moving vehicles, chemical and manufacturing processes, heavy products and items and highly regulated materials. As a result, we are subject to a variety of health and safety and mine safety laws and regulations dealing with occupational health and safety, particularly those administered by OSHA and MSHA, which are subject to change and may be interpreted differently or become stricter over time. Failure to comply with these requirements can result in sanctions such as fines and penalties and claims for personal injury and property damage. These requirements may also result in increased operating and capital costs in the future. We cannot guarantee that violations of such requirements will not occur, and any violations could result in additional costs. See also Risks Related to Geological, Mining and Environmental Matters above for a further description of risks related to environmental laws and regulations.
Unsafe work sites have the potential to increase employee turnover and raise our operating costs. Our safety record can also impact our reputation. We maintain functional groups whose primary purpose is to ensure we implement effective work procedures throughout our organization and take other steps to ensure the health and safety of our work force, but there can be no assurances these measures will be successful in preventing injuries or violations of health and safety laws and regulations. Any failure to maintain safe work sites or violations of applicable law could expose us to significant financial losses and reputational harm, as well as civil and criminal liabilities, any of which could have a material adverse effect on our business, financial condition and results of operations.
Specific future risks include potable water systems at our sites which may be further regulated for per- and polyfluoroalkyl substances, lead and copper with requirements to treat water and ensure potable water delivered satisfies water quality criteria. In addition, MSHA has begun implementation of a tighter standard for silica dust exposure to our workers. Future monitoring may identify conditions of exposure that require additional mitigation and expense to ensure work protection meets MSHA standards.
As a result, we cannot assure you that any costs relating to future capital and operating expenditures to maintain compliance with environmental, health and safety and mine safety laws and regulations, as well as costs to address contamination or environmental claims, will not exceed any current estimates and reserves or adversely affect our business, financial position, results of operations and cash flows. In addition, any unanticipated liabilities or obligations arising, for example, out of the discovery of previously unknown conditions or changes in law or enforcement policies, could materially and adversely affect our business, financial position, results of operations and cash flows.
We face risks from potential and ongoing litigation, and the nature of our business exposes us to product liability, construction defect and warranty claims in particular.
In the ordinary course of our business, we are involved, and may in the future become involved, in a number of legal proceedings incidental to our operations, including personal injury, product liability, commercial, warranty, antitrust, ownership disputes, competition, EHS matters, social security and tax claims.
53
Table of Contents
Although our management aims to resolve these matters without any significant impact on our business, financial position or results of operations, the actual outcome of these legal proceedings is uncertain and in the case of an adverse final decision in any of these legal proceedings, our business, financial position and results of operations may be adversely affected. Furthermore, such proceedings can divert the attention of our management from our business and any negative publicity resulting from such proceedings or other disputes may result in substantial expenses and adversely affect our business, reputation, prospects, financial condition and results of operations. Any claims or proceedings, particularly those in which we are unsuccessful or for which we did not establish adequate reserves, could have a material adverse effect on our business, financial condition and results of operations. We generally maintain insurance against many product liability risks, but there can be no assurance that this coverage will be adequate for any liabilities ultimately incurred. In addition, there is no assurance that insurance will continue to be available on terms acceptable to us.
Our existing compliance controls, although considered sufficient by our management, may fail to prevent or detect inadequate practices, fraud and violations of law by our intermediaries, customers, suppliers, partners or employees.
We are subject to various legal and regulatory requirements and risks in the markets in which we operate, such as antitrust, anti-money laundering, anti-bribery and anti-corruption or other sanctions laws and regulations imposed by international organizations or individual nations. Our existing compliance controls may not be sufficient in order to prevent or detect inadequate practices, fraud and violations of law by our intermediaries, customers, suppliers, partners, affiliates or employees. Should any of our intermediaries, customers, suppliers, partners, affiliates or employees receive or grant inappropriate benefits or use corrupt, fraudulent or other unfair business practices, we could be confronted with legal sanctions, penalties, loss of orders, detention or seizure of any imports, claims by injured parties or harm to our reputation. This could have a material adverse effect on our business, financial position and results of operations.
We may fail to obtain or renew, or may experience material delays in obtaining, requisite approvals, licenses and permits from the relevant national and/or regional governments or authorities for the conduct of our business. Failure to obtain or renew, or comply with the requirements of, such permits could also adversely affect our results of operations.
We require various approvals, licenses, permits and certificates from the relevant national and/or regional governments or authorities in the markets in which we operate, in particular in connection with operating our limestone quarries. Many such permits are long-term, ranging from 10 to 15 years, and are automatically renewed five years before their expiration. We cannot provide assurance or guarantee that we will not encounter problems in obtaining new or renewing existing licenses, permits and certificates required in the conduct of our businesses, or provide assurance that we will continue to satisfy the conditions to which such licenses, permits and certificates are granted. There may also be delays on the part of regulatory and administrative bodies in reviewing applications and granting approvals, which could result in delays or increased costs to our operations. If we fail to obtain or maintain the necessary permits, licenses and certificates required for the conduct of our business, we may be required to incur substantial costs, which could have a material adverse effect on our business, financial position and results of operations.
In addition to the regulatory matters described above, we and our customers are subject to extensive governmental regulation on matters such as approvals, licenses, permits and certificates requirements; plant and wildlife protection; wetlands protection; waste management; reclamation and restoration activities at mining properties after mining is completed; the discharge of materials into the environment; and the effects that mining has on groundwater quality and availability. Compliance with these regulatory requirements is expensive and significantly lengthens the time needed to develop a project. The denial of an approval, license, permit or certificate that is essential to our operations or the imposition of conditions with which it is not practicable or feasible to comply could impair or prevent our ability to operate, develop or expand a project. Additionally, failure to comply with such approvals, licenses, permits and certificates could result in enforcement action and have a material adverse effect on our business, financial position and results of operations.
54
Table of Contents
The use of our products, including cement and supplementary cementitious materials, aggregates, ready-mix concrete, concrete block and other ancillary products, is often affected by various laws and regulations in the markets in which we operate, any of which may have a material adverse effect on us.
The use of many of our products, which include cementitious materials, aggregates, ready-mix concrete, concrete block and other ancillary products, is subject to approvals by municipalities, state departments of transportation, engineers and developers as they are used in construction projects and thus subject to construction laws and performance specifications. These approvals and specifications, including building codes, may affect the decisions of our customers, and, consequently, failure to obtain or maintain such approvals or changes in building codes may affect the sale of our products. Changes in applicable regulations governing the sale of some of our products or the failure of any of our products to comply with such requirements could increase our costs of doing business, reduce sales or otherwise have a material adverse effect on our business, financial condition and results of operations.
Any inability to protect our intellectual property or claims that we infringe on the intellectual property rights of others could have a material adverse effect on us.
We rely on a combination of patents, trademarks, trade names, confidentiality and nondisclosure clauses and agreements, and other unregistered rights to define and protect our rights to our brand and the intellectual property used in certain of our products. We also rely on product, industry, manufacturing and market know-how that cannot be registered and may not be subject to any confidentiality or nondisclosure clauses or agreements. To the extent that our innovations, products and name are not protected by patents or other intellectual property rights, third parties, including competitors, may be able to commercialize our innovations or products or use our know-how, which could result in a loss of our competitive advantage. Additionally, we have faced in the past and may in the future face claims that we are infringing the intellectual property rights of others. If any of our products are found to infringe the patents or other intellectual property rights of others, the potential risks and uncertainties of intellectual property-related litigation and an assertion of an infringement claim against us may cause us to spend significant amounts to defend the claim, and possibly pay significant money damages. In the event of a settlement or adverse judgment, our manufacture and sale of such products could be significantly restricted or prohibited and we may be required to pay substantial damages or ongoing licensing fees. Any inability to protect our intellectual property rights or any misappropriation of the intellectual property of others could have a material adverse effect on our business, financial condition and results of operations. Even in instances where we believe that claims and allegations of intellectual property infringement against us are without merit, defending against such claims may be time consuming and expensive and may result in the diversion of time and attention of our management and employees.
Changes in tariffs and other trade restrictions could have a material adverse effect on our business, financial position, results of operations and cash flows.
If significant tariffs or other restrictions are placed on foreign imports by the United States or any related countermeasures are taken by impacted foreign countries, it could have a material adverse effect on our business, financial position, results of operations and cash flows. We may not be able to pass any resulting price increase on to our customers, and even if we are able to pass along such price increases, we may face decreased demand for our products and we may lose customers. Additionally, future federal or state infrastructure projects may include a Buy American provision to restrict a percentage of materials sourced from outside the United States (not excluding cement), which could have a material adverse effect on our business, financial position, results of operations and cash flows. Conversely, if significant tariffs or other restrictions are removed on foreign imports by the United States, we may be forced to lower the prices we charge our customers for our products in order to remain competitive in our markets, which could also have a material adverse effect on our business, financial position, results of operations and cash flows.
It remains unclear what additional actions, if any, will be taken by the United States or other governments with respect to international trade agreements, the imposition or removal of tariffs on goods imported into the United
55
Table of Contents
States, the creation or removal of barriers to trade, tax policy related to international commerce, or other trade matters. The current tariffs and trade restrictions, along with any additional tariffs and restrictions that may be implemented by the United States or other countries in the future, may result in further increased prices, decreased available supply of steel and other materials used in our business and worsened economic conditions affecting the market for our products and services more broadly. As a result, our business, financial position, results of operations and cash flows may be materially and adversely affected.
Risks Related to the Offering and Ownership of Our Common Shares
Our results of operations and the market price of our common shares may be volatile, and the market price of our common shares after this offering may drop below the price you pay, which could result in substantial losses for investors purchasing shares in this offering.
The market price of our common shares could be subject to significant fluctuations after this offering, and it may decline below the initial public offering price. Some of the factors that may cause the market price of our common shares to fluctuate include:
| | likely fluctuation in our future results of operations; |
| | significant volatility in the market price and trading volume of comparable companies; |
| | actual or anticipated changes or fluctuations in our operating results or in the expectations of market analysts; |
| | adverse market reaction to any indebtedness we may incur or securities we may issue in the future; |
| | short sales, hedging and other derivative transactions in our shares; |
| | announcements of technological innovations, new products, strategic alliances or significant agreements by us or by our competitors; |
| | failure to meet or exceed financial estimates and projections of the investment community or that we provide to the public; |
| | issuance of new or updated research or reports by securities analysts; |
| | fluctuations in the valuation of companies perceived by investors to be comparable to us; |
| | currency fluctuations; |
| | changes in the prices of our products or the prices of our competitors products; |
| | litigation or regulatory action against us; |
| | investors general perception of us and the publics reaction to our press releases, our other public announcements and our filings with the U.S. Securities and Exchange Commission (SEC); |
| | publication of research reports or news stories about us, our competitors or our industry, or positive or negative; |
| | recommendations or withdrawal of research coverage by securities analysts; |
| | changes in general political, economic, industry and market conditions and trends; |
| | sales of our common shares by our directors, executive officers and existing shareholders; |
| | recruitment or departure of key personnel; and |
| | the other risk factors described in this section of this prospectus. |
In addition, stock markets have historically experienced substantial price and volume fluctuations. Broad market and industry factors may harm the market price of our common shares and our results of operations. Hence, the market price of our common shares and our results of operations could fluctuate based upon factors that have
56
Table of Contents
little or nothing to do with us, and these fluctuations could materially reduce the market price of our common shares regardless of our operating performance and could limit or prevent investors from readily selling their common shares and may otherwise negatively affect the market price and liquidity of our common shares.
In addition, in the past, when the market price of a share has been volatile, holders of that share have sometimes instituted securities class action litigation against the company that issued the shares. If any of our shareholders brought a lawsuit against us, we could incur substantial costs defending the lawsuit. Such a lawsuit could also divert the time and attention of our management from our business, which could significantly harm our profitability and reputation.
An active, liquid and orderly trading market for our common shares may not develop, and you may not be able to resell your shares at or above the initial public offering price.
Before this offering, there was no public trading market for our common shares, and we cannot assure you that one will develop or be sustained after this offering. If a market does not develop or is not sustained, it may be difficult for you to sell your common shares. Public trading markets may also experience volatility and disruption. This may affect the pricing of the common shares in the secondary market, the transparency and availability of trading prices, the liquidity of the common shares and the extent of regulation applicable to us. We cannot predict the prices at which our common shares will trade. The initial public offering price for our common shares will be determined through our negotiations with the underwriters and may not bear any relationship to the market price at which our common shares will trade after this offering or to any other established criteria of the value of our business. It is possible that, in future quarters, our results of operations may be below the expectations of securities analysts and investors. As a result of these and other factors, the price of our common shares may decline.
Future sales or distributions of our common shares by Titan Cement International could depress the market price of our common shares.
After this offering, and subject to the lock-up period described in this prospectus, Titan Cement International may sell all or a portion of its remaining shares of our common shares or distribute those shares to its shareholders. Additional sales by Titan Cement International in the public market or distributions to its shareholders of substantial amounts of our common shares could depress the market price of our common shares.
The rights provided to our shareholders under Belgian corporate law and our articles of association differ in certain respects from the rights that you would typically enjoy as a shareholder of a U.S. company under applicable U.S. federal and state laws.
We are, and will upon the completion of this offering be, a Belgian company with limited liability (naamloze vennootschap/société anonyme). Our corporate affairs are governed by our articles of association and by the Belgian Code on Companies and Associations. From a Belgian corporate law point of view, we do not qualify as a listed company (genoteerde vennootschap/société cotée) because none of our securities are listed on any regulated market in the European Economic Area. The Belgian corporate law provisions that are applicable to Belgian companies listed on a regulated market in the European Economic Area do therefore not apply to us. We are not subject to most of the disclosure obligations applicable to Belgian companies listed on a regulated market in the European Economic Area. Furthermore, Belgian law provisions on mandatory public takeover bids that are applicable to Belgian companies listed on a regulated market in the European Economic Area do not apply to us. Therefore, under Belgian law, no mandatory takeover bid can be imposed on a person acquiring a significant or even controlling stake of our shares and thus the shareholders may not be granted the opportunity to sell their shares at a premium (which is typically offered in the framework of a takeover bid) in the event our parent, Titan Cement International, would sell its shares to a third party. As a result, shareholders of our Company may not enjoy certain of the rights and protection generally afforded to shareholders of a Belgian company listed on a regulated market in the European Economic Area.
57
Table of Contents
Also, the rights of shareholders and the responsibilities of members of our board of directors may be different from the rights and obligations of shareholders and boards of directors in companies governed by the laws of U.S. jurisdictions.
In the performance of its duties, our board of directors is required by the Belgian Code on Companies and Associations to consider the corporate interest of our Company, which requires our board to act not only in the financial interest of the shareholders, but also to take into account of the consequences of their actions on our employees and other stakeholders, in all cases with due observation of the principles of reasonableness. It is possible that some of these parties will have interests that are different from, or in addition to, the interests of our shareholders. See Description of Share CapitalArticles of Association and Other Share Information.
As a result of these differences between Belgian corporate law, on the one hand, and U.S. federal and state laws, on the other hand, in certain instances, you could receive less protection as a shareholder of our Company than you would as a shareholder of a U.S. corporation.
As a foreign private issuer, we are subject to different U.S. securities laws and rules than a domestic U.S. issuer, which may limit the information publicly available to our shareholders or otherwise result in less protection than is accorded to investors under rules applicable to domestic U.S. issuers.
Upon the completion of this offering, we will report under the Exchange Act as a non-U.S. company with foreign private issuer status. Because we qualify as a foreign private issuer under the Exchange Act, we are exempt from certain provisions of the Exchange Act that are applicable to domestic U.S. public companies, including (i) the sections of the Exchange Act regulating the solicitation of proxies, consents or authorizations in respect of a security registered under the Exchange Act; (ii) the sections of the Exchange Act requiring insiders to file public reports of their share ownership and trading activities and liability for insiders who profit from trades made in a short period of time; and (iii) the rules under the Exchange Act requiring the filing with the SEC of quarterly reports on Form 10-Q containing unaudited financial and other specified information. In addition, foreign private issuers are not required to file their annual report on Form 20-F until 120 days after the end of each fiscal year, while domestic U.S. issuers that are accelerated filers are required to file their annual report on Form 10-K within 75 days after the end of each fiscal year and domestic U.S. issuers that are large accelerated filers are required to file their annual report on Form 10-K within 60 days after the end of each fiscal year. Foreign private issuers are also exempt from Regulation FD, which is intended to prevent issuers from making selective disclosures of material information. As a result of all of the above, you may not have the same protections afforded to shareholders of a company that is not a foreign private issuer.
As a foreign private issuer and as permitted by the listing requirements of the NYSE, we rely on certain home country corporate governance practices rather than the corporate governance requirements of the NYSE.
As a foreign private issuer, we have the option to follow certain home country corporate governance rules rather than those of the NYSE, provided that we disclose the requirements we are not following and describe the home country practices we are following. We intend to rely on this foreign private issuer exemption but cannot make any assurances that we will continue to do so in the future. If we were to lose our status as a foreign private issuer, we may avail ourselves of the controlled company exemption which exempts us from certain governance requirements of the NYSE. As a result, our shareholders may not have the same protections afforded to shareholders of companies that are subject to all NYSE corporate governance requirements.
We may lose our foreign private issuer status in the future, which could result in significant additional costs and expenses to us.
As discussed above, we are a foreign private issuer, and therefore, we are not required to comply with all of the periodic disclosure and current reporting requirements of the Exchange Act. The determination of foreign private issuer status is made annually on the last business day of an issuers most recently completed second fiscal quarter, and, accordingly, the next determination will be made with respect to us on June 30, 2025. In the future,
58
Table of Contents
we would lose our foreign private issuer status if (i) more than 50% of our outstanding voting securities are owned by U.S. residents and (ii) a majority of our directors or executive officers are U.S. citizens or residents, or we fail to meet additional requirements necessary to avoid loss of foreign private issuer status. If we lose our foreign private issuer status, we would be required to file with the SEC periodic reports and registration statements on domestic U.S. issuer forms, which are more detailed and extensive than the forms available to a foreign private issuer. We would be required to report under U.S. GAAP, which could alter our results of operations or depict different trends of results of operations. We would also have to comply with U.S. federal proxy requirements, and our officers, directors and principal shareholders would become subject to the short-swing profit disclosure and recovery provisions of Section 16 of the Exchange Act. In addition, we would lose our ability to rely upon exemptions from certain corporate governance requirements under the listing rules of the NYSE. As a U.S. listed public company that is not a foreign private issuer, we would incur significant additional legal, accounting and other expenses that we will not incur as a foreign private issuer, and accounting, reporting and other expenses in order to maintain a listing on a U.S. securities exchange. These expenses would relate to, among other things, the obligation to present our financial information in accordance with U.S. GAAP in the future.
We will be a controlled company within the meaning of the rules of the NYSE and, as a result, will qualify for, and intend to partially rely on, exemptions from certain corporate governance requirements. You will not have the same protections afforded to shareholders of companies that are subject to such requirements.
A controlled company under the NYSE corporate governance requirements is a company of which more than 50% of the voting power is held by an individual, group or another company. Following this offering, Titan Cement International will control a majority of the voting power of our outstanding common shares, making us a controlled company within the meaning of the NYSE corporate governance requirements. Because we qualify as a controlled company, we are not required to have a majority of our non-executive directors be independent, nor are we required to have an independent compensation committee or an independent nominating function. We expect that a majority of our directors will be independent; however, in light of our status as a controlled company, our nominating and compensation committee will not be independent. Our status as a controlled company could make our common shares less attractive to some investors or otherwise harm the price of our common shares.
Following the completion of this offering, Titan Cement International will control a majority of the voting power of our common shares, which will prevent you and other shareholders from influencing significant decisions.
After giving effect to the sale of our common shares pursuant to this offering, Titan Cement International will control (directly or indirectly) 87% (or 85% if the underwriters exercise their option to purchase additional common shares from the selling shareholder in full) of our aggregate voting power. For so long as Titan Cement International continues to control a majority of the voting power, it will generally be able to significantly influence the outcome of all corporate actions requiring approval of the general meeting.
So long as Titan Cement International continues to control a majority of the voting power of our shares, it will be able to influence the composition of our board of directors and thereby influence our policies and operations, including the appointment of management, future issuances of shares or other securities, the payment of dividends, if any, on shares, the incurrence or modification of debt by us, amendments to our articles of association and the entering into extraordinary transactions, and its interests may not in all cases be aligned with our other shareholders interests. In addition, Titan Cement International may have an interest in pursuing acquisitions, divestitures and other transactions that, in its judgment, could enhance its investment or improve its financial condition, even though such transactions might involve risks to our other shareholders. For example, Titan Cement International could cause us to make acquisitions that increase our indebtedness or cause us to sell revenue-generating assets.
59
Table of Contents
In addition, Titan Cement International will be able to cause or prevent a change of control of our Company and could preclude any unsolicited acquisition of our Company. The concentration of ownership could deprive our other shareholders of an opportunity to receive a premium for their common shares as part of a sale of our Company and ultimately may affect the market price of our common shares.
As a result, Titan Cement International and its affiliates interests may not be the same as, or may conflict with, the interests of our other shareholders or our interests. Investors in this offering will not be able to affect the outcome of a shareholder vote while Titan Cement International controls the majority of the voting power in the general meeting. Because Titan Cement Internationals interests may differ from those of our other shareholders, actions that Titan Cement International takes with respect to us, as our controlling shareholder, may not be favorable to us or to our other shareholders.
Conflicts of interest and disputes may arise between Titan Cement International and us that could be resolved in a manner unfavorable to us.
Questions relating to conflicts of interest and actual disputes may arise between Titan Cement International and us in a number of areas relating to our past and ongoing relationships. Areas in which conflicts of interest or disputes between Titan Cement International and us could arise include, but are not limited to, the following:
| | Competing business activities and business opportunities. Titan Cement International is a large global company with businesses spanning a wide range of industries, including other businesses relating to cement manufacturing. In the ordinary course of its business activities, Titan Cement International may engage in activities where its interests conflict with our interests or those of our other shareholders. In addition, our directors who are employed by or otherwise affiliated with Titan Cement International may have or make investments in other companies that may compete with us. Titan Cement International also may pursue acquisition opportunities that may be complementary to our business, and, as a result, those acquisition opportunities may not be available to us. As a result, our future competitive position and growth potential could be adversely affected. |
| | Cross officerships, directorships and share ownership. The ownership interests of our directors or executive officers in the equity shares of Titan Cement International or service as a director or officer of both Titan Cement International and us could create, or appear to create, conflicts of interest when directors and executive officers are faced with decisions that could have different implications for the two companies. For example, these decisions could relate to (i) disagreement over the desirability of a potential business or acquisition opportunity or business plans, (ii) employee retention or recruiting (iii) our dividend policy or (iv) terms of cement purchase agreements. |
As set out above, the Belgian Code on Companies and Associations sets out a mandatory procedure on financial conflicts of interest that is applicable to the members of the board of directors of Titan America but does not provide any express protection against conflicts of interest at the level of Titan Americas management.
Any such conflicts of interest or disputes that are not resolved in favor of our business could adversely affect our financial condition and results of operations.
If you purchase common shares in this offering, you will suffer immediate and substantial dilution in the net tangible book value of your investment.
The initial public offering price of our common shares is substantially higher than the net tangible book value per share. Therefore, if you purchase our common shares in this offering, you will pay a price per share that substantially exceeds our pro forma as adjusted net tangible book value per share after this offering. Based on the initial public offering price of $16.50 per common share, which is the midpoint of the price range set forth on the cover page of this prospectus, you will experience immediate dilution of $13.29 per share, representing the difference between our pro forma as adjusted net tangible book value per share after giving effect to this offering at the initial public offering price. See Dilution for more detail.
60
Table of Contents
We have identified material weaknesses in our internal control over financial reporting. If we are unable to maintain effective internal controls, the accuracy and timeliness of our financial reporting may be adversely affected, which could cause the market price of our common shares to decline, lessen investor confidence and harm our business.
As a privately-held company, we were not required to evaluate our internal control over financial reporting in a manner that meets the standards of publicly traded companies required by Section 404(a) of the Sarbanes-Oxley Act (Section 404). As a public company, we will be subject to significant requirements for enhanced financial reporting and internal controls. The process of designing and implementing effective internal controls is a continuous effort that requires us to anticipate and react to changes in our business and the economic and regulatory environments and to expend significant resources to maintain a system of internal controls that is adequate to satisfy our reporting obligations as a public company. In addition, we will be required, pursuant to Section 404, to furnish a report by management on, among other things, the effectiveness of our internal control over financial reporting, and our auditors will be required to issue an attestation report on the effectiveness of our internal controls on an annual basis.
The rules governing the standards that must be met for our management to assess our internal control over financial reporting are complex and require significant documentation, testing, and possible remediation. Testing and maintaining internal controls may divert our managements attention from other matters that are important to our business.
During the preparation of our financial statements included elsewhere in this prospectus we identified material weaknesses in our internal control over financial reporting. The Public Company Accounting Oversight Board (the PCAOB) defines a material weakness as a deficiency, or a combination of deficiencies, in internal control over financial reporting, such that there is a reasonable possibility that a material misstatement of the companys annual or interim financial statements will not be prevented or detected on a timely basis.
A description of the material weaknesses identified is included under Managements Discussion and Analysis of Financial Condition and Results of OperationsCritical Accounting Policies and EstimatesMaterial Weaknesses.
We are in the process of developing a remediation plan designed to remediate each of the identified material weaknesses; however the material weaknesses will not be considered remediated until the action items arising out of the plan have been implemented and the new controls and procedures have been operating effectively for a sufficient period of time. While we will work to remediate the material weaknesses as quickly and efficiently as possible, we cannot at this time provide an expected timeline in connection with any remediation plan. These remediation measures may be time-consuming and costly, and might place significant demands on our financial and operational resources.
As permitted under the U.S. securities laws, neither we nor our independent registered public accounting firm have performed or are required to perform an evaluation of the effectiveness of our internal control over financial reporting. In the future, we may identify additional material weaknesses or significant deficiencies in our internal control over financial reporting.
Our ability to comply with the annual internal control reporting requirements will depend on the effectiveness of our financial reporting and data systems and controls across our company. Any weaknesses or deficiencies or any failure to implement new or improved controls, or difficulties encountered in the implementation or operation of these controls, could harm our operating results and cause us to fail to meet our financial reporting obligations, or result in material misstatements in our consolidated financial statements, which could adversely affect our business and reduce the price of our common shares.
If we are unable to conclude on an ongoing basis that we have effective internal control over financial reporting in accordance with Section 404, our independent registered public accounting firm may not issue an unqualified
61
Table of Contents
opinion. If we are unable to conclude that we have effective internal control over financial reporting, investors could lose confidence in our reported financial information, which could have a material adverse effect on the trading price of our common shares. Failure to remedy any material weakness in our internal control over financial reporting, or to implement or maintain other effective control systems required of public companies, could also restrict our future access to the capital markets.
As a public reporting company, we will be subject to rules and regulations established from time to time by the SEC regarding our internal control over financial reporting. If we fail to put in place appropriate and effective internal control over financial reporting and disclosure controls and procedures, we may not be able to accurately report our financial results, or report them in a timely manner, which may adversely affect investor confidence in us and, as a result, the value of our common shares.
Our management is responsible for establishing and maintaining adequate internal control over financial reporting and will also, as a public company, be responsible for evaluating and reporting on our system of internal control. Our internal control over financial reporting is a process designed to provide reasonable assurance regarding the reliability of financial reporting and the preparation of financial statements for external purposes in accordance with IFRS. As a public company, we will be required to report, among other things, control deficiencies that constitute a material weakness or changes in internal controls that, or that are reasonably likely to, materially affect internal control over financial reporting. During the preparation of our financial statements included elsewhere in this prospectus we identified material weaknesses in our internal control over financial reporting.
If our executive management is unable to conclude that we have effective internal control over financial reporting, or to certify the effectiveness of such controls, or if our independent registered public accounting firm cannot render an unqualified opinion on our internal control over financial reporting, when required, if we fail to remediate the material weaknesses identified or if additional material weaknesses or deficiencies in our internal controls are identified, we could be subject to sanctions or investigations by the SEC or other regulatory authorities, investors may lose confidence in the accuracy and completeness of our financial reports, we may face restricted access to the capital markets and our share price may be adversely affected.
We will incur increased costs and regulatory burden and devote substantial management time as a result of being a public company listed on the NYSE.
Prior to this offering we were not subject to the disclosure requirements of U.S. securities laws or the rules, regulations and policies of the NYSE. As a public company listed on the NYSE, we will incur increased legal, accounting and other costs not incurred as a private company operating as a wholly-owned subsidiary of Titan Cement International. In particular, as a public company, we will be required to, among other things:
| | comply with the rules and regulations implemented by the SEC, the Sarbanes-Oxley Act, the Dodd-Frank Act, the PCAOB and the NYSE; |
| | maintain an internal audit function; |
| | enhance our own financial reporting function; |
| | establish an investor relations function; and |
| | establish certain internal policies, including those relating to trading in our securities. |
We expect that compliance with these requirements will increase our legal and financial compliance costs and will make some activities more time consuming and costly. In addition, we expect that our management and other personnel will need to divert attention from operational and other business matters to devote substantial time and other resources to these requirements. We have made, and will continue to make, changes to our financial management control systems and other areas to manage our obligations as a public company listed on the NYSE, including corporate governance, corporate controls, disclosure controls and procedures and financial
62
Table of Contents
reporting and accounting systems. However, we cannot assure you that these and other measures that we might take will be sufficient to allow us to satisfy our obligations as a public company on a timely basis. As a result of these additional costs and other requirements, our historical financial information included in this prospectus is not necessarily indicative of our future results of operations, financial condition or cash flows, nor does it reflect what our results of operations, financial condition or cash flows would have been as a public company during the periods presented.
As a result of becoming a public company in the United States, we will become subject to additional regulatory compliance requirements, including Section 404 of the Sarbanes-Oxley Act.
As a foreign private issuer listed on the NYSE, we will incur legal, accounting and other expenses that we did not previously incur. We will be subject to the reporting requirements of the Exchange Act, the Sarbanes-Oxley Act, the Dodd-Frank Wall Street Reform and Consumer Protection Act of 2010, the listing requirements and other applicable securities rules and regulations, as well as the U.S. Foreign Corrupt Practices Act. Compliance with these rules and regulations will increase our legal and financial compliance costs, make some activities more difficult, time consuming or costly and increase demand on our systems and resources. The Exchange Act requires that, as a public company, we file or furnish annual and certain other reports with respect to our business, financial condition and results of operations. We are currently evaluating these rules and regulations and cannot predict or estimate the amount of additional costs we may incur or the timing of such costs. These rules and regulations are often subject to varying interpretations, in many cases due to their lack of specificity, and, as a result, their application in practice may evolve over time as new guidance is provided by regulatory and governing bodies. This could result in continuing uncertainty regarding compliance matters and higher costs necessitated by ongoing revisions to disclosure and governance practices. We cannot predict or estimate the amount of additional costs we may incur as a result of becoming a public company or the timing of such costs. Any changes we make to comply with these obligations may not be sufficient to allow us to satisfy our obligations as a public company on a timely basis, or at all. These reporting requirements, rules and regulations, coupled with the increase in potential litigation exposure associated with being a public company, could also make it more difficult for us to attract and retain qualified persons to serve on our board of directors or board committees or to serve as executive officers, or make it more difficult or expensive for us to obtain certain types of insurance, including directors and officers insurance, on acceptable terms.
Effective internal control over financial reporting is necessary for us to provide reliable financial reports. Effective internal controls, together with adequate disclosure controls and procedures, are designed to prevent or detect material misstatement due to fraud or error and to provide reasonable assurance as to the reliability of financial reporting. Deficiencies in our internal controls may adversely affect our managements ability to record, process, summarize and report financial data on a timely basis. As a public company, we will be required by Section 404 of the Sarbanes-Oxley Act to include a report of managements assessment on our internal control over financial reporting and, beginning with our annual report for the year ending December 31, 2025, compliance with Section 404 of the Sarbanes-Oxley Act will significantly increase our compliance costs and managements attention may be diverted from other business concerns, which could adversely affect our financial performance. We may need to hire more team members in the future or engage outside consultants to comply with these requirements, which would further increase expenses. If we fail to comply with the applicable requirements of the Sarbanes-Oxley Act in the required timeframe, we may be subject to sanctions, investigations or other enforcement actions by regulatory authorities, including the SEC.
Prior to this offering, neither we nor our independent registered public accounting firm were required to deliver an opinion on the effectiveness of our internal control over financial reporting. We, and our independent registered public accounting firm, were not required to perform an evaluation of our internal control over financial reporting as of December 31, 2023 and December 31, 2022 in accordance with the provisions of the Sarbanes-Oxley Act.
63
Table of Contents
Although we may pay dividends to holders of our common shares, under Belgian law, our ability to do so is subject to the discretion of our board of directors and shareholders.
We currently intend to distribute dividends to our shareholders on a pro-rata basis. Although we intend to pay dividends pursuant to this policy, our common shares will have no contractual or other legal right to dividends. Any recommendation by our board of directors to the general shareholders meeting to declare and pay dividends and any decision by our board of directors to declare and pay interim dividends in the future will be made at its discretion and will depend on, among other things, our results of operations, financial condition, earnings, capital requirements, debt service obligations, restrictive covenants in our current and future debt agreements, industry practice, legal requirements (including those noted below under Belgian law), cash requirements, contractual restrictions and other factors that our board of directors may deem relevant. In addition, our ability to pay dividends is, and may continue to be, limited by covenants of our current and future indebtedness, and on our ongoing ability to generate cash from operations and access to the capital markets. Accordingly, we may not declare or make, or may have to reduce or eliminate, payments of any dividends. As a result, investors in this offering may not receive future dividends and the market price of our common shares may be adversely affected. See Dividend Policy.
Furthermore, pursuant to Belgian law, the calculation of amounts available for distribution to shareholders, as dividends or otherwise, must be determined on the basis of our statutory non-consolidated Belgian GAAP (as defined below) financial statements. In addition, in accordance with Belgian law and our articles of association, we must allocate each year an amount of at least 5% of our annual net profit under our statutory non-consolidated accounts (prepared in accordance with accounting principles generally accepted in Belgium (Belgian GAAP)) to a legal reserve until the reserve equals 10% of our share capital.
In addition, any dividends will generally be subject to Belgian withholding tax. See Material Belgian Federal Income Tax Considerations for a more detailed description of Belgian taxes which may be imposed on dividends.
We are a holding company with no operations of our own and, as such, we depend on our subsidiaries for cash to fund our operations and expenses, including future dividend payments, if any.
As a holding company, our principal source of cash flow will be distributions or payments from our operating subsidiaries. Therefore, our ability to fund and conduct our business, service our debt and pay dividends, if any, in the future will depend on the ability of our subsidiaries and intermediate holding companies to make upstream cash distributions or payments to us, which may be impacted, for example, by their ability to generate sufficient cash flow or limitations on the ability to repatriate funds whether as a result of currency liquidity restrictions, monetary or exchange controls or otherwise. Our operating subsidiaries and intermediate holding companies are separate legal entities, and although they are directly or indirectly wholly-owned and controlled by us, they have no obligation to make any funds available to us, whether in the form of loans, dividends or otherwise. To the extent the ability of any of our subsidiaries to distribute dividends or other payments to us is limited in any way, our ability to fund and conduct our business, service our debt and pay dividends, if any, could be harmed.
If securities or industry analysts do not publish or cease publishing research or reports about us, our business or our market, or if they change their recommendations regarding our common shares adversely, the market price and trading volume of our common shares could decline.
The trading market for our common shares is influenced by the research and reports that industry or securities analysts publish about us, our business, our market or our competitors. If any of the securities or industry analysts who cover us or may cover us in the future change their recommendation regarding our common shares adversely, or provide more favorable relative recommendations about our competitors, the price of our common shares would likely decline. If any securities or industry analyst who covers us or may cover us in the future were to cease coverage of us or fail to regularly publish reports on us, we could lose visibility in the financial markets, which in turn could cause our share price or trading volume of our common shares to decline.
64
Table of Contents
We have broad discretion over the use of the net proceeds from this offering and may use them in ways with which you do not agree and in ways that may not enhance our operating results or the market price of our common shares.
Our board of directors and executive management will have broad discretion over the application of the net proceeds that we receive from this offering. We may spend or invest these proceeds in ways with which our shareholders disagree or that do not yield a favorable return, if at all. We intend to use the net proceeds from this offering, together with our existing cash resources as described in Use of Proceeds. However, our use of these proceeds may differ substantially from our current plans. Failure by our management to apply these funds effectively could harm our business, results of operations, cash flows, financial condition and/or prospects. Pending their use, we may invest the net proceeds from this offering in a manner that does not produce income or that loses value.
It may be difficult for investors outside Belgium to serve process on, or enforce foreign judgments against, us or our directors and executive management.
We are a Belgian public limited liability company. Less than a majority of the members of our board of directors are residents of the United States and all or a substantial portion of the assets of such non-resident persons are located outside the United States. As a result, it may not be possible for investors to effect service of process upon such persons or on us or to enforce against them or us a judgment obtained in U.S. courts. Original actions or actions for the enforcement of judgments of U.S. courts relating to the civil liability provisions of the federal or state securities laws of the United States are not directly enforceable in Belgium.
The United States and Belgium do not currently have a multilateral or bilateral treaty providing for reciprocal recognition and enforcement of judgments, other than arbitral awards, in civil and commercial matters. In order for a final judgment for the payment of money rendered by U.S. courts based on civil liability to produce any effect on Belgian soil, it is accordingly required that this judgment be recognized or be declared enforceable by a Belgian court in accordance with Articles 22 to 25 of the 2004 Belgian Code of Private International Law. Recognition or enforcement does not imply a review of the merits of the case and is irrespective of any reciprocity requirement. A U.S. judgment will, however, not be recognized or declared enforceable in Belgium, unless (in addition to compliance with certain technical provisions) the Belgian courts are satisfied of the following:
| | the effect of the recognition or enforcement is not manifestly incompatible with Belgian public policy; |
| | the judgment did not violate the rights of defense; |
| | the judgment was not rendered with the sole purpose of avoiding the application of the law applicable according to Belgian private international law, in a matter where parties cannot freely dispose of their rights; |
| | the judgment is not subject to further recourse under the applicable laws in the state where the judgment was issued; |
| | the judgment is not incompatible with a judgment rendered in Belgium or with an earlier judgment rendered abroad that might be recognized in Belgium; |
| | the claim to which the judgment relates was not filed after a claim that is still pending between the same parties and concerning the same subject matter was filed in Belgium; |
| | the Belgian courts did not have exclusive jurisdiction to rule on the matter; |
| | the relevant U.S. court did not accept its jurisdiction solely on the basis of the presence of the plaintiff or the location of goods not directly linked to the dispute in the state in which the court is located; and |
| | an issuance of the judgment that meets the requirement of authenticity under the applicable laws in the state where the judgment was rendered is provided; in case of a judgment in absentia, it can be shown that under the applicable laws in the state where the judgment was rendered, the invitation to appear in |
65
Table of Contents
| court was properly served on, or notified to, the defendant; a document can be produced showing that the judgment is, under the applicable laws in the state where it was rendered, enforceable and was properly served on the defendant. |
In addition to recognition or enforcement, a judgment by a federal or state court in the United States against us may also serve as evidence in a similar action in a Belgian court if it meets the conditions required for the authenticity of judgments under the applicable laws in the state where the judgment was rendered. The findings of a federal or state court in the United States will not, however, be taken into account to the extent they would have consequences that are manifestly incompatible with Belgian public policy.
Based on the lack of a treaty as described above, U.S. investors may not be able to enforce against us or members of our board of directors or our executive management any judgments obtained in U.S. courts in civil and commercial matters, including judgments under the U.S. federal securities laws.
Our articles of association contain exclusive forum provisions for certain shareholder litigation matters, which would limit our shareholders ability to obtain a favorable judicial forum for disputes with us or our directors, officers, associates or shareholders or make the litigation of such disputes more costly for shareholders.
Our articles of association provide that, subject to limited exceptions, to the fullest extent permitted by law, Belgian courts will be the sole and exclusive forum for any dispute relating to corporate matters of the Company and the implementation of our articles of association between the Company, our shareholders, our directors, statutory auditors or liquidators. This provision does not apply to suits brought to enforce any duty or liability created by the Securities Act or Exchange Act, or rules and regulations thereunder.
Any person or entity purchasing or otherwise acquiring any interest in our common shares shall be deemed to have had notice of and consented to the choice of forum provisions of our articles of association. This choice of forum provision may limit a shareholders ability to bring a claim in a judicial forum that it finds favorable for disputes with us or any of our directors, officers, other associates or shareholders, which may discourage lawsuits with respect to such claims or impose additional costs or other burdens on such shareholder. Alternatively, if a court were to find the choice of forum provision contained in our articles of association to be inapplicable or unenforceable in an action, we may incur additional costs associated with resolving such action in other jurisdictions, which could harm our business, operating results and financial condition.
Risks Related to Certain Tax Matters
Changes in tax laws or unanticipated tax liabilities could adversely affect our effective income tax rate and profitability.
We are subject to income taxes in the United States, Greece and Belgium. Our effective income tax rate could be adversely affected in the future by a number of factors, including changes in the valuation of deferred tax assets and liabilities, changes in tax laws and regulations or their interpretations and application and the outcome of income tax audits in any of the jurisdictions in which we operate or are otherwise subject to tax.
A significant change in the United States, Greece or Belgian tax law, or that of other countries where we may operate or have a presence, may materially and adversely impact our income tax liability, provision for income taxes and effective tax rate. We regularly assess all of these matters to determine the adequacy of our income tax provision, which is subject to significant judgment.
In the ordinary course of our business, there are many transactions and calculations where the ultimate tax determination is uncertain. Although we believe our tax estimates are reasonable, the final outcome of tax audits and related litigation could be materially different than that reflected in our historical income tax provisions and accruals. There can be no assurance that the resolution of any audits or litigation will not have an adverse effect on future operating results.
66
Table of Contents
The Organisation for Economic Cooperation and Development (the OECD) is conducting a project focused on base erosion and profit shifting in international structures, which seeks to establish certain international standards for taxing the worldwide income of multinational companies. In addition, the OECD is working on a BEPS 2.0 initiative, which is aimed at (i) shifting taxing rights to the jurisdiction of the consumer and (ii) ensuring all companies pay a global minimum tax. In December 2022, the member states of the European Union unanimously voted to adopt the OECDs minimum tax rules and phase them into national law, and in February 2023 the OECD released technical guidance on the global minimum tax which was agreed by consensus of the BEPS 2.0 Pillar Two signatory jurisdictions. Under the European Unions minimum tax directive (the EU Directive 2022/2523), member states are to adopt domestic legislation implementing the minimum tax rules effective for periods beginning on or after December 31, 2023, with the under-taxed profit rule to take effect for periods beginning on or after December 31, 2024. Belgium and other countries where Titan Group is active, have adopted the BEPS 2.0 rules and as a result, these rules will impact Titan Group going forward. As a result of these developments, the tax laws relevant to our operations and cashflow could change on a prospective or retroactive basis, and any such changes could increase our liabilities for taxes, interest and penalties, and therefore could harm our business, cash flows, results of operations and financial position. Belgium implemented EU Directive 2022/2523 into its national legislation with the law of December 19, 2023. This law has entered into effect as from January 1, 2024. The law of May 12, 2024 has further provided for some technical corrections to these rules.
In August 2022, the United States passed IRA, which imposed, among other things, a corporate alternative minimum tax on book income on certain large U.S. corporations, including certain U.S. subsidiaries of certain large multinational corporate groups, and a 1% excise tax on net stock repurchases by certain publicly traded corporations, including publicly-traded non-U.S. corporations in certain circumstances. These provisions became effective on January 1, 2023. Although we do not currently believe that the IRA will have a material impact on our consolidated financial statements, the full effects of these rules and other provisions of the IRA on us are uncertain until further regulations and guidance from the U.S. Internal Revenue Service (IRS) and the U.S. Department of the Treasury (U.S. Treasury) are released.
If a U.S. Holder is treated as owning at least 10% of our common share capital, such holder may be subject to adverse U.S. federal income tax consequences.
If a U.S. Holder (as defined below under Material U.S. Federal Income Tax Considerations) is treated as owning, directly, indirectly or constructively, at least 10% of the value or voting power of our share capital, such U.S. Holder may be treated as a United States shareholder with respect to each controlled foreign corporation in our group, if any. Because of certain attribution rules, we and/or any non-U.S. subsidiary may be treated as a controlled foreign corporation. A United States shareholder of a controlled foreign corporation generally will be required to annually report and include in its U.S. taxable income, as ordinary income, its pro rata share of Subpart F income, global intangible low-taxed income and investments in U.S. property by controlled foreign corporations, whether or not we make any distributions to such United States shareholder. An individual United States shareholder generally would not be allowed certain tax deductions or foreign tax credits that would be allowed to a corporate United States shareholder with respect to a controlled foreign corporation. A failure by a United States shareholder to comply with its reporting obligations may subject the United States shareholder to significant monetary penalties, loss of foreign tax credits and may extend the statute of limitations with respect to the United States shareholders U.S. federal income tax return for the year for which such reporting was due. We cannot provide any assurances that we will assist investors in determining whether we or any of our non-U.S. subsidiaries are controlled foreign corporations for any given year or whether any investor is a United States shareholder with respect to any such controlled foreign corporations. We also cannot guarantee that we will furnish to United States shareholders information that may be necessary to comply with the aforementioned reporting and tax paying obligations. The IRS has provided limited guidance on situations in which investors may rely on publicly available information to comply with their reporting and tax paying obligations with respect to controlled foreign corporations. U.S. investors should consult their tax advisors regarding the potential application of these rules to their investment in our shares.
67
Table of Contents
U.S. Holders may suffer adverse tax consequences if we are characterized as a passive foreign investment company for U.S. federal income tax purposes.
We will be classified as a passive foreign investment company (a PFIC) for U.S. federal income tax purposes for any taxable year if either: (1) at least 75% of our gross income for the taxable year is passive income for purposes of the PFIC rules, or (2) at least 50% of the value (generally determined on the basis of a quarterly average) of our assets is attributable to assets that produce, or are held for the production of, passive income. Based on our financial statements and our expectations about the nature and amount of our income, assets and activities and the market value of our equity, we do not believe that we were a PFIC for our most recent taxable year, and we do not expect to become a PFIC for our current taxable year or in the foreseeable future. The determination of PFIC status, however, is made annually, at the end of each taxable year, and is dependent upon a number of factors, some of which are beyond our control, including the relative values of our assets and subsidiaries, and the amount and type of our income. As a result, there can be no assurance that we will not be a PFIC for our current taxable year or any subsequent year or that the IRS will agree with our conclusion regarding PFIC status and would not successfully challenge our position. U.S. Holders (as defined in Material U.S. Federal Income Tax Considerations) should consult their tax advisors about the potential application of the PFIC rules to their investment in the common shares. For further discussion, see Material U.S. Federal Income Tax ConsiderationsPassive Foreign Investment Company Status.
68
Table of Contents
SPECIAL NOTE REGARDING FORWARD-LOOKING STATEMENTS
This prospectus contains forward-looking statements, as that term is defined in the U.S. federal securities laws, concerning our business, operations and financial performance and condition, as well as our plans, objectives and expectations for our business operations and financial performance and condition. Any statements contained herein that are not statements of historical facts may be deemed to be forward-looking statements. In some cases, you can identify forward-looking statements by terminology such as aim, anticipate, assume, believe, contemplate, continue, could, due, estimate, expect, goal, commit, commitment, intend, may, objective, plan, predict, potential, positioned, pioneer, seek, should, target, will, would and other similar expressions that are predictions of or indicate future events and future trends, or the negative of these terms or other comparable terminology.
Before making a decision to purchase our common shares, you should carefully consider all of the factors identified in this prospectus that could cause actual results to differ from these forward-looking statements. Such factors include, among other things:
| | increases in the cost or fluctuations in the availability of labor, fuel and energy, raw materials and other production inputs; |
| | fluctuations in energy, fuel prices and transportation costs changes in prices for or availability of commodities, labor or other production inputs; |
| | increases in market demand for cement substitutes; |
| | impacts of climate change and regulations intended to address climate change; |
| | fluctuations in public spending for infrastructure and large-scale projects, construction levels and urbanization trends; |
| | the timing or likelihood of regulatory approvals, licenses and permits, as well as delays in construction projects; |
| | our ability to protect our intellectual property, the confidentiality of our know-how, trade secrets, technology and other proprietary information; |
| | regulatory developments in the United States, Europe and other jurisdictions, including those relating to the protection of the environment, health and safety; |
| | our expectations about market trends; |
| | our ability to accurately forecast demand for our products and manage our inventory; |
| | developments relating to our competitors and our industry, including demand for cement substitutes; |
| | our ability to effectively manage our anticipated growth; |
| | our ability to attract and retain key management and other qualified personnel; |
| | union disputes and other employee relations issues; |
| | our ability to realize the anticipated benefits of strategic investment in research and development, digitalization and logistical capabilities; |
| | our expected use of proceeds of this offering; |
| | the future trading price of our common shares and impact of securities analysts reports on these prices; |
| | the risk that an active, liquid trading market for our common shares may not develop or that the market for our common shares may be volatile; |
69
Table of Contents
| | increased costs and regulatory burdens resulting from being a public company listed on the NYSE following this offering; |
| | our ability to operate as a standalone public company after the Reorganization Transactions; |
| | conflicts of interest and disputes arising between Titan Cement International and us that could be resolved in a manner unfavorable to us; |
| | our ability to remediate the identified material weaknesses in our internal control over financial reporting; and |
| | other risks and uncertainties, including those listed under the caption Risk Factors. |
We caution you that the foregoing list does not contain all of the forward-looking statements made in this prospectus.
You should not rely upon forward-looking statements as predictions of future events. We have based the forward-looking statements contained in this prospectus primarily on our current expectations and projections about future events and trends that we believe may affect our business, financial condition, results of operations and prospects. The outcome of the events described in these forward-looking statements is subject to risks, uncertainties and other factors, including those described above, in Risk Factors, Managements Discussion and Analysis of Financial Condition and Results of Operations, and elsewhere in this prospectus. Moreover, we operate in a competitive environment, and new risks and uncertainties may therefore emerge from time to time, and it is not possible for us to predict all risks and uncertainties that could have an impact on the forward-looking statements contained in this prospectus. We cannot guarantee that the results, events and circumstances reflected in the forward-looking statements will be achieved or occur, and actual results, events or circumstances could differ materially from those described in the forward-looking statements.
Neither we nor any other person assumes responsibility for the accuracy and completeness of any of these forward-looking statements. Moreover, the forward-looking statements made in this prospectus relate only to events as of the date on which the statements are made. We undertake no obligation to update any forward-looking statements made in this prospectus to reflect events or circumstances after the date of this prospectus or to reflect new information or the occurrence of unanticipated events, except as required by law. We may not actually achieve the plans, intentions or expectations disclosed in our forward-looking statements and you should not place undue reliance on our forward-looking statements. Our forward-looking statements do not reflect the potential impact of any future acquisitions, mergers, dispositions, joint ventures or investments we may make.
In addition, statements that we believe and similar statements reflect our beliefs and opinions on the relevant subject. These statements are based upon information available to us as of the date of this prospectus, and while we believe such information forms a reasonable basis for such statements, such information may be limited or incomplete, and our statements should not be read to indicate that we have conducted an exhaustive inquiry into, or review of, all potentially available relevant information. These statements are inherently uncertain, and investors are cautioned not to unduly rely upon these statements.
The forward-looking statements contained in this prospectus are excluded from the safe harbor protection provided by the Private Securities Litigation Reform Act of 1935 and Section 27A of the Securities Act of 1933, as amended (the Securities Act).
You should carefully consider the Risk Factors and subsequent public statements, or reports filed with or furnished to the SEC, before making any investment decision with respect to our securities. If any of these trends, risks or uncertainties actually occurs or continues, our business, financial condition or operating results could be materially adversely affected, the trading prices of our securities could decline, and you could lose all or part of your investment. All forward-looking statements attributable to us or persons acting on our behalf are expressly qualified in their entirety by this special note. Additionally, our discussion of various information, including ESG matters, both here and in other locations is information by various standards and the interests of various stakeholders. As such, not all such information may be material and references to materiality and any related assessment of ESG materiality may differ from the definition applicable for relevant reporting purposes.
70
Table of Contents
We estimate that the net proceeds from the sale of 9,000,000 common shares that we are selling in this offering will be approximately $130.7 million, based on an assumed initial public offering price of $16.50 per share, which is the midpoint of the price range set forth on the cover page of this prospectus, after deducting the estimated underwriting discounts and commissions and estimated offering expenses paid and payable by us.
Each $1.00 increase or decrease in the assumed initial public offering price would increase or decrease, respectively, the net proceeds to us by approximately $8.6 million, assuming the number of shares offered by us, as set forth on the cover page of this prospectus, remains the same and after deducting the estimated underwriting discounts and commissions. Similarly, a decrease of one million common shares sold in this offering by us would decrease our net proceeds by $15.8 million, assuming the initial public offering price of $16.50 per share (the midpoint of the estimated public offering price range set forth on the cover page of this prospectus), remains the same and after deducting the estimated underwriting discounts and commissions. Any increase in common shares sold in this offering would be sold by the selling shareholder. We do not expect that a change in the initial price to the public or the number of shares by these amounts would have a material effect on uses of the proceeds from this offering, although it may change the time at which we will need to seek additional capital.
The principal purposes of selling our common shares in this offering are to increase our financial flexibility, obtain additional capital, to create a public market for our common shares and to facilitate our future access to the public equity markets. We have not quantified or allocated any specific portion of the net proceeds for any particular purpose. We anticipate that we will use the net proceeds from this offering for capital expenditures and other general corporate purposes, including to fund investments in technologies, for working capital to fund our growth strategies described elsewhere in this prospectus and to pursue strategic acquisitions that complement our business, although we have no present commitments, agreements or understandings to enter into any such transactions.
The amounts and timing of any expenditures will vary depending on the amount of cash generated by our operations, competitive and technological developments and the rate of growth, if any, of our business. Accordingly, our management will have significant flexibility in applying the net proceeds from this offering, and investors will be relying on the judgment of our management regarding the application of these net proceeds. Pending the uses described above, we intend to invest the net proceeds from this offering in short-term, interest-bearing obligations, investment-grade instruments, certificates of deposit or direct or guaranteed obligations of the U.S. government. The goal with respect to the investment of these net proceeds will be capital preservation and liquidity so that these funds are readily available to fund our operations.
We will not receive any proceeds from the sale of common shares by the selling shareholder in the offering, including any shares sold by the selling stockholders pursuant to the underwriters option to purchase additional shares.
71
Table of Contents
We currently intend to pay quarterly dividends of $0.04 per share to our shareholders on a pro-rata basis. Any recommendation by our board of directors to the general shareholders meeting to declare and pay dividends and any decision by our board of directors to declare and pay interim dividends in the future will be made at its discretion and will depend on, among other things, our results of operations, financial condition, earnings, capital requirements, debt service obligations, restrictive covenants in our current and future debt agreements, industry practice, legal requirements (including those noted below under Belgian law), cash requirements, contractual restrictions and other factors that our board of directors may deem relevant. In addition, our ability to pay dividends is, and may continue to be, limited by covenants of our current and future indebtedness, and on our ongoing ability to generate cash from operations and access to the capital markets. Accordingly, we may not declare or make, or may have to reduce or eliminate, payments of any dividends. Investors should not purchase our common shares with the expectation of receiving cash dividends.
Furthermore, we have sufficient issue premium that allows us to retain the possibility of carrying out a consistent distribution policy, through the repayment of (part) of the issue premium per common share (which can be decided upon by our general meeting subject to a simple majority). Any recommendation by our board of directors to the general shareholders meeting to repay (part of) the issue premium, is contingent on the factors as set out above.
All of the common shares offered by this prospectus will have the same dividend rights as all of our other outstanding common shares. In general, distributions of dividends proposed by our board of directors require the approval of our shareholders at a shareholders meeting, although our board of directors may declare interim dividends without shareholder approval, subject to the terms and conditions of the Belgian Code on Companies and Associations.
Our ability to distribute dividends in the future is also subject to availability of sufficient distributable profits as defined under Belgian law on the basis of our stand-alone statutory accounts prepared in accordance with Belgian GAAP. In particular, dividends can only be distributed if following the declaration and issuance of the dividends the amount of our net assets on the date of the closing of the last financial year as follows from the statutory non-consolidated financial statements (i.e., summarized, the amount of the assets as shown in the balance sheet, decreased with provisions and liabilities, all in accordance with Belgian accounting rules, and, save in exceptional cases, to be mentioned and justified in the notes to the annual accounts, decreased with the non-amortized costs of incorporation and extension and the non-amortized costs for research and development), does not fall below the amount of the paid-up capital (or, if higher, the issued capital), increased with the amount of non-distributable reserves (which include, as the case may be, the unamortized part of any revaluation surpluses).
In addition, pursuant to Belgian law and our articles of association, we must allocate an amount of 5% of our Belgian GAAP annual net profit to a legal reserve in its stand-alone statutory accounts, until the legal reserve amounts to 10% of our share capital. Our legal reserve currently does not meet this requirement nor will it meet the requirement at the time of the completion of this offering, as it is still being formed and as we have not yet allocated any results for Titan America (which is a recently incorporated company). Accordingly, 5% of our Belgian GAAP annual net profit during future years will need to be allocated to the legal reserve, further limiting our ability to pay out dividends to our shareholders.
For information regarding the Belgian withholding tax applicable to dividends and related U.S. reimbursement procedures, see Material Belgian Federal Income Tax Considerations.
72
Table of Contents
The following table sets forth our cash and cash equivalents and capitalization as of September 30, 2024:
| | on an actual basis; |
| | on an as adjusted basis to give effect to: |
| | the Contribution effected prior to the completion of this offering. |
| | the 10 for 1 split of our common shares effected prior to the completion of this offering. |
| | the issuance and sale by us of 9,000,000 common shares in this offering at an assumed initial public offering price of $16.50 per share, which is the midpoint of the price range set forth on the cover page of this prospectus, after deducting underwriting discounts and commissions and estimated offering expenses paid and payable by us and the application of the net proceeds from this offering as described in Use of Proceeds. |
| | the declaration and payment on October 25, 2024 of a $51.6 million return of capital to Titan Cement International. The return of capital was funded through a combination of drawdowns on short-term third party and short-term and long-term related party credit facilities. |
The as adjusted information set forth in the table below is illustrative only and will be adjusted based on the actual initial public offering price and other terms of this offering determined at pricing. You should read this information together with our audited annual consolidated financial statements, and the accompanying notes thereto appearing elsewhere in this prospectus and the sections titled Prospectus SummarySummary Historical Consolidated Financial Information and Managements Discussion and Analysis of Financial Condition and Results of Operations. The following amounts are in millions, except per share data.
| As of September 30, 2024 | ||||||||
| Actual | As Adjusted | |||||||
| (in thousands) | ||||||||
| Cash and Cash Equivalents(1) |
$ | 12,149 | 144,914 | |||||
|
|
|
|
|
|||||
| Debt: |
||||||||
| Short-term borrowings, including accrued interest(3) |
141,816 | 175,816 | ||||||
| Long-term borrowings(3) |
227,858 | 245,449 | ||||||
| Lease liabilities (current and non-current) |
69,516 | 69,516 | ||||||
|
|
|
|
|
|||||
| Total Debt |
$ | 439,190 | 490,781 | |||||
|
|
|
|
|
|||||
| Stockholders equity: |
||||||||
| Common stock(1)(2) |
25,419 | 1,843,625 | ||||||
| Share premium(1)(2)(3) |
168,605 | 933,943 | ||||||
| Capital reserves |
4,039 | 4,039 | ||||||
| Retained earnings(1) |
560,269 | 555,878 | ||||||
| Common control reserve(2) |
| (2,497,498 | ) | |||||
| Accumulated other comprehensive income/ (loss) |
4,330 | 4,330 | ||||||
|
|
|
|
|
|||||
| Total stockholders equity |
$ | 762,662 | 844,317 | |||||
|
|
|
|
|
|||||
| Total Capitalization |
$ | 1,201,852 | 1,335,098 | |||||
|
|
|
|
|
|||||
| (1) | The initial public offering proceeds after deducting the estimated underwriting discounts and commissions and estimated offering costs paid and payable by us is $130.7 million. Our total estimated offering costs, excluding estimated underwriting discounts and commissions, of $11.1 million payable by us consist of $4.2 million related to the primary offering and $6.9 million related to the secondary offering. As of September 30, 2024, $3.7 million of offering costs related to the primary and secondary offering had been incurred, of which $2.1 million was paid. As of September 30, 2024, $1.1 million of the offering costs incurred were capitalized and $2.6 million of the offering costs incurred were expensed. |
| The following adjustments were made within stockholders equity: |
| | Common stock was adjusted by $90.0 million to reflect the $10.00 derived value of TASAs common shares multiplied by the issuance and sale of 9,000,000 common shares in this offering, |
73
Table of Contents
| | Share premium was adjusted by $47.6 million reflecting an issue premium of $6.50 multiplied by 9,000,000 common shares, the number of common shares issued in this offering, less estimated underwriting discounts and commissions of $6.7 million and estimated offering costs related to the primary offering of $4.2 million, |
| | Retained earnings was adjusted by $4.4 million to reflect the offering costs related to the secondary offering that were incurred after September 30, 2024. |
| Each $1.00 increase or decrease in the assumed initial public offering price of $16.50 (the midpoint of the estimated public offering price range set forth on the cover page of this prospectus), would increase or decrease each of cash and cash equivalents, total stockholders equity and total capitalization by approximately $8.6 million, assuming the number of shares offered by us, as set forth on the cover page of this prospectus, remains the same and after deducting the estimated underwriting discounts and commissions and estimated offering costs paid and payable by us. Similarly, a decrease of one million common shares sold in this offering by us would decrease each of cash and cash equivalents, total stockholders equity and total capitalization by approximately $15.8 million, assuming the initial public offering price of $16.50 per share (the midpoint of the estimated public offering price range set forth on the cover page of this prospectus), remains the same and after deducting the estimated underwriting discounts and commissions. |
| (2) | Adjusted to give effect to the Contribution under which, prior to the date of this prospectus, Titan Cement International contributed the 1,734,440 shares it held in Titan Atlantic, representing 100% of the equity in Titan Atlantic, to TASA in exchange for 175,342,465 common shares of TASA. The Contribution was immediately preceded by a share split of TASAs 2,000 then-current common shares at a 10:1 ratio. As a result, the following adjustments were recorded within stockholders equity: |
| | Common stock was adjusted by $1,728.2 million to reflect the $10.00 derived value of TASAs common shares multiplied by common shares outstanding; |
| | Share premium was adjusted by $769.3 million to reflect an issue premium multiplied by the number of common shares issued by TASA in the Contribution, less the value of TASAs retained earnings; and |
| | A common control reserve of $2,497.5 million was established within equity to adjust total stockholders equity balance to the carrying value of total stockholders equity immediately prior to the Contribution. |
| In addition, after the Contribution of Titan Atlantic to TASA, on January 1, 2025, Titan America LLC divested its STET segment in a sale for cash, to be settled no later than January 31, 2025, to Titan Cement Netherlands B.V., a wholly-owned subsidiary of Titan Cement International, which is outside the scope of this offering. The STET divestiture is not included as an adjustment to the above table as it is immaterial to the results of operations, financial position and cash flows of TASA. |
| (3) | Adjusted to reflect the declaration and payment on October 25, 2024 of a $51.6 million return of capital to Titan Cement International. The return of capital was funded through a combination of drawdowns on short-term third party (approximately $27.0 million) and short-term and long-term related party (approximately $7.0 million and $17.6 million, respectively) credit facilities. |
74
Table of Contents
If you invest in our common shares in this offering, your interest will be immediately diluted to the extent of the difference between the initial public offering price per share of our common shares in this offering and our pro forma as adjusted net tangible book value per share of our common shares upon the completion of this offering.
As of September 30, 2024, our net tangible book value was approximately $510.7 million, or approximately $2.91 per share.
As of September 30, 2024, our pro forma net tangible book value was approximately $459.1 million, or approximately $2.62 per share. Pro forma net tangible book value represents the amount of our total tangible assets less our total liabilities, after giving effect to the Contribution, the 10 for 1 split of our common shares, the filing and effectiveness of our articles of association and return of capital of $51.6 million to Titan Cement International. After giving effect to the sale of common shares in this offering at an assumed initial public offering price of $16.50 per share (the midpoint of the price range set forth on the cover page of this prospectus) and after deducting estimated underwriting discounts and commissions and estimated offering expenses paid and payable by us, our pro forma as adjusted net tangible book value as of September 30, 2024 would have been approximately $592.3 million, or approximately $3.21 per share. This represents an immediate dilution (i.e., the difference between the offering price and the pro forma as adjusted net tangible book value after this offering) to new investors participating in this offering of $13.29 per share.
The following table illustrates the per share dilution to new investors participating in this offering:
| Assumed initial public offering price per share |
$ | 16.50 | ||||||
| Historical net tangible book value per share as of September 30, 2024 |
$ | 2.91 | ||||||
| Increase (decrease) per common share attributable to the pro forma adjustments described above |
(0.29 | ) | ||||||
|
|
|
|||||||
| Pro forma net tangible book value per share as of September 30, 2024 |
2.62 | |||||||
| Increase per share attributable to new investors in this offering |
0.59 | |||||||
|
|
|
|||||||
| Pro forma as adjusted net tangible book value per share |
$ | 3.21 | ||||||
|
|
|
|||||||
| Dilution per share to new investors in this offering(1) |
$ | 13.29 | ||||||
|
|
|
| (1) | Dilution is determined by subtracting pro forma as adjusted net tangible book value per share from the initial public offering price paid by a new investor. |
The following table summarizes the pro forma as adjusted basis as of September 30, 2024, the total number of common shares owned by existing holders and to be owned by the new investors in this offering, the total consideration paid, and the average price per share paid by our existing holders and to be paid by the new investors in this offering at $16.50, the midpoint of the price range set forth on the cover page of this prospectus, calculated before deducting estimated discounts and commissions and offering expenses:
| Shares purchased | Total Consideration |
Average Price |
||||||||||||||||||
| Number | Percent | Amount | Percent | |||||||||||||||||
| Existing holders |
175,362,465 | 95 | % | 3,200,199,986 | 96 | % | $ | 18.25 | ||||||||||||
| New investors in this offering |
9,000,000 | 5 | % | 148,500,000 | 4 | % | $ | 16.50 | ||||||||||||
|
|
|
|
|
|
|
|
|
|||||||||||||
| Total |
184,362,465 | 100 | % | 3,348,699,986 | 100 | % | ||||||||||||||
|
|
|
|
|
|
|
|
|
|||||||||||||
Sales by the selling shareholder in this offering will reduce the number of common shares held by existing holders to 160,362,465, or approximately 87% of the total common shares outstanding after this offering, which will increase the number of shares held by new investors to 24,000,000, or approximately 13% of the total common shares outstanding after this offering.
75
Table of Contents
A $1.00 increase (decrease) in the assumed initial public offering price of $16.50 per share, which is the midpoint of the price range set forth on the cover page of this prospectus, would increase (decrease) our pro forma as adjusted net tangible book value as of September 30, 2024 by $8.6 million or the pro forma as adjusted net tangible book value per share by $0.05 and the dilution in adjusted pro forma as adjusted net tangible book value per share to new investors in this offering would increase (decrease) by $0.05 per share, assuming the number of shares offered by the selling shareholder and us, as set forth on the cover page of this prospectus, remains the same and after deducting the estimated underwriting discounts and commissions and offering expenses.
76
Table of Contents
MANAGEMENTS DISCUSSION AND ANALYSIS OF FINANCIAL CONDITION AND RESULTS OF OPERATIONS
The following discussion and analysis of the financial condition and results of operations of Titan America should be read together with our audited consolidated financial statements as of December 31, 2023 and 2022 and for the years ended December 31, 2023, 2022 and 2021, and our unaudited interim condensed consolidated financial statements as of September 30, 2024 and for the nine months ended September 30, 2024 and 2023, in each case together with related notes thereto, included elsewhere in this prospectus. The discussion and analysis should also be read together with the sections entitled Business, and Risk Factors. The following discussion contains forward-looking statements that reflect future plans, estimates, beliefs and expected performance. The forward-looking statements are dependent upon events, risks and uncertainties that may be outside of our control. Our actual results may differ significantly from those projected in the forward-looking statements. Factors that might cause future results to differ materially from those projected in the forward-looking statements include, but are not limited to, those discussed in the sections entitled Risk Factors and Special Note Regarding Forward-Looking Statements included elsewhere in this prospectus. Certain total amounts may not sum due to rounding.
Overview
Titan America is a leading vertically integrated, multi-regional manufacturer and supplier of heavy building materials and services operating primarily on the Eastern Seaboard of the United States (the Eastern Seaboard). We are a leading provider of building materials that contribute to lower carbon emissions than traditional building materials and/or beneficial reuse of waste materials. We are a leading provider of heavy building materials in Florida and the Mid-Atlantic. We serve markets that benefit from population growth, economic growth and technology and innovation trends that are among the strongest in the United States.
We have built what we believe is a unique and differentiated building materials platform in the markets we serve. Today, our manufacturing, logistics and customer support capabilities span across critical building materials and products, including cement and SCMs, aggregates, ready-mix concrete, concrete block and other ancillary products. Additionally, we believe that our market leadership in lower carbon cement and green concrete solutions positions us to benefit from growing demand for building materials that contribute to lower carbon emissions. We believe our vertically integrated business model and continued investment in our extensive logistical capabilities have enabled us to grow with our diverse customer base across infrastructure, residential and non-residential end markets. By leveraging these competitive advantages across our two reportable segments, the Mid-Atlantic and Florida, we believe that we are in a strong position to drive meaningful growth and enhanced profitability into the future.
Our Reportable Segments
Due to the regional nature of our business, we report our operating results in two reportable segments: Florida and Mid-Atlantic. We run our operations nimbly allowing us to pivot resources to markets we support with the greatest demand based on market conditions.
Florida Reportable Segment
Our Florida reportable segment consists of our cement, aggregates, ready-mix concrete, concrete block and fly ash operations within the State of Florida. We currently operate one cement plant, three mines, 40 ready-mix locations with 45 batch plants, eight concrete block locations with 13 production lines, two fly ash facilities and one multi-product marine import terminal along with related logistics infrastructure.
77
Table of Contents
Mid-Atlantic Reportable Segment
Our Mid-Atlantic reportable segment consists of our cement, aggregates, ready-mix concrete and fly ash operations throughout the Mid-Atlantic region, most concentrated in Virginia, North Carolina, South Carolina, New York and New Jersey, capable of serving surrounding states such as Maryland, West Virginia, Kentucky, Tennessee, Pennsylvania, Ohio and Indiana areas with fly ash. We currently operate one cement plant, four mines, 42 ready-mix locations with 47 batch plants, along with related logistics infrastructure and import terminals.
Basis of Presentation
Our annual consolidated financial statements included elsewhere in this prospectus are prepared in accordance with International Financial Reporting Standards (IFRS Accounting Standards) as issued by the International Accounting Standards Board (IFRS). The definition of IFRS also encompasses all valid International Accounting Standards, as well as all interpretations of the International Financial Reporting Interpretations Committee, including those formally issued by the Standing Interpretations Committee. These financial statements have been prepared under the historical cost convention, except for certain financial assets and liabilities (including derivative financial instruments) and defined benefit pension plan assets, which are measured at fair value.
Our consolidated financial statements included elsewhere in this prospectus present the historical results of operations, financial position and cash flows of Titan Atlantic and its consolidated subsidiaries, including Titan America LLC and its subsidiaries, prior to the Reorganization Transactions. Historical earnings per share have been retrospectively presented to reflect the capital structure following the Contribution. Titan Americas STET segment is included in the Companys historical operations for the periods presented. For the fiscal year ended December 31, 2023, the STET segment generated external segment revenue of $2.0 million and segment adjusted EBITDA of $(6.4 million). For the nine months ended September 30, 2024, the STET segment generated external segment revenue of $1.2 million and segment adjusted EBITDA of ($4.4 million). See Prospectus SummaryThe Reorganization Transactions.
All references to tons in this Managements Discussion and Analysis of Financial Condition and Results of Operations refer to short-tons, as defined in the relevant context.
Financial Metrics and Financial Highlights
The following table presents a summary of financial metrics for the nine months ended September 30, 2024 and 2023, as well as for the fiscal years ended December 31, 2023, 2022 and 2021.
| Nine Months Ended | Years Ended | |||||||||||||||||||
| September 30, | December 31, | |||||||||||||||||||
| ($ in thousands) | 2024 | 2023 | 2023 | 2022 | 2021 | |||||||||||||||
| Revenue |
$ | 1,244,578 | $ | 1,192,464 | $ | 1,591,601 | $ | 1,364,146 | $ | 1,152,417 | ||||||||||
| Operating income |
$ | 201,229 | $ | 169,568 | $ | 225,636 | 97,042 | $ | 94,175 | |||||||||||
| Net income |
$ | 129,546 | $ | 109,800 | $ | 155,244 | $ | 62,721 | $ | 59,221 | ||||||||||
| Adjusted EBITDA(1) |
$ | 286,878 | $ | 241,136 | $ | 328,373 | $ | 193,097 | $ | 177,585 | ||||||||||
| Net cash provided by operating activities |
$ | 197,143 | $ | 142,415 | $ | 227,125 | $ | 178,374 | $ | 146,703 | ||||||||||
| Free Cash Flow(1) |
$ | 83,796 | $ | 50,602 | $ | 108,522 | $ | 50,365 | $ | 75,934 | ||||||||||
| Return on Average Capital Employed(2) |
22.3 | % | 18.1 | % | 20.7 | % | 9.6 | % | 9.5 | % | ||||||||||
| Total Debt(3) |
$ | 439,190 | $ | 409,413 | $ | 462,093 | ||||||||||||||
| Net Debt(1)(3) |
$ | 427,041 | $ | 387,377 | $ | 432,252 | ||||||||||||||
| Ratio of Total Debt to Net Income(3) |
2.5 to 1.0 | 2.6 to 1.0 | 7.4 to 1.0 | |||||||||||||||||
| Ratio of Net Debt to Adjusted EBITDA(1)(3) |
1.1 to 1.0 | 1.2 to 1.0 | 2.2 to 1.0 | |||||||||||||||||
| (1) | Adjusted EBITDA, Free Cash Flow, Net Debt and Ratio of Net Debt to Adjusted EBIDA are non-IFRS financial measures we use to measure the performance, level of indebtedness and liquidity of our business. For the definition of these measures and a reconciliation to the most directly comparable financial measure calculated and presented in accordance with IFRS please see Non-IFRS Measures below. |
78
Table of Contents
| (2) | Capital employed is defined as total stockholders equity plus short-term debt, long-term debt, short-term lease liabilities and long-term lease liabilities. Average capital employed is calculated by taking the average of capital employed values at the beginning, mid-point and end of the latest twelve-month period. Return on Average Capital Employed (ROACE) is calculated by dividing operating income by average capital employed. |
| (3) | Total Debt, Ratio of Total Debt to Net Income, Net Debt and Ratio of Net Debt to Adjusted EBITDA are balance sheet metrics and are presented as of the last day of each fiscal period. The Ratio of Total Debt to Net Income for the interim periods measures Total Debt at period end to Net Income for the trailing twelve months for the periods presented. The Ratio of Net Debt to Adjusted EBITDA for the interim periods measures Net Debt at period end to Adjusted EBITDA for the trailing twelve months for the periods presented. |
The principal factors in evaluating our financial condition and operating results for the nine months ended September 30, 2024, as compared to the nine months ended September 30, 2023, are:
| | Revenue increased $52.1 million, or 4%, for the nine months ended September 30, 2024 compared to the nine months ended September 30, 2023, primarily as a result of increases in product pricing. Revenue in both reportable segments grew moderately with our Florida and Mid-Atlantic segment external revenue rising by $33.1 million, or 5%, and $19.4 million, or 4%, respectively, for the nine months ended September 30, 2024 compared to the nine months ended September 30, 2023. Ready-mix concrete and concrete block revenues grew strongly, rising by $41.3 million and $15.9 million, respectively, for the nine months ended September 30, 2024 compared to the nine months ended September 30, 2023. Fly ash saw moderate revenue growth of $2.1 million for the nine months ended September 30, 2024 compared to the nine months ended September 30, 2023. |
| | Average external sales prices increased by 3% in cement, 10% in aggregates, 6% in ready-mix concrete, 3% in concrete block and 10% in fly ash for the nine months ended September 30, 2024 compared to the nine months ended September 30, 2023. |
| | External sales volumes increased by 2% in ready-mix concrete, 12% in concrete block and 4% in fly ash and declined by 3% in cement and 15% in aggregates for the nine months ended September 30, 2024 compared to the nine months ended September 30, 2023. |
| | Operating income increased by $31.7 million, or 19%, for the nine months ended September 30, 2024 compared to the nine months ended September 30, 2023, as a result of the $52.1 million growth in revenue, which more than offset the rises in general and administrative expenses of $17.2 million, and selling expenses of $3.6 million for the nine months ended September 30, 2024 compared to the nine months ended September 30, 2023. |
| | Net income increased $19.7 million, or 18%, for the nine months ended September 30, 2024 compared to the nine months ended September 30, 2023, primarily driven by strong improvement in operating income offset by a foreign exchange loss of $7.5 million for the nine months ended September 30, 2024 compared to a foreign exchange gain of $2.0 million for the nine months ended September 30, 2023, and a higher income tax expense resulting from higher income before income taxes, partially offset by a slightly lower effective tax rate. |
| | Adjusted EBITDA increased $45.7 million, or 19%, for the nine months ended September 30, 2024 compared to the nine months ended September 30, 2023, as price improvements exceeded the impact of higher labor, distribution, repairs and maintenance and general and administrative expenses. |
| | Net cash provided by operating activities increased to $197.1 million for the nine months ended September 30, 2024, compared to $142.4 million for the nine months ended September 30, 2023. |
| | Free Cash Flow increased to $83.8 million for the nine months ended September 30, 2024, compared to $50.6 million for the nine months ended September 30, 2023. |
| | Total Debt increased to $439.2 million and our Ratio of Total Debt to Net Income declined to 2.5 to 1.0 at September 30, 2024 compared to $409.4 million and 2.6 to 1.0 at December 31, 2023. |
| | Net Debt increased to $427.0 million and our Ratio of Net Debt to Adjusted EBITDA declined to 1.1 to 1.0 at September 30, 2024 compared to $387.4 million and 1.2 to 1.0 at December 31, 2023. |
79
Table of Contents
The principal factors in evaluating our financial condition and operating results for the fiscal year ended December 31, 2023, as compared to the fiscal December 31, 2022, are:
| | Revenue increased $227.5 million, or 17%, for the fiscal year ended December 31, 2023 compared to the fiscal year ended December 31, 2022, primarily as a result of increases in product pricing. Revenue in both reportable segments grew strongly with our Florida and Mid-Atlantic segment external revenue rising by $161.4 million, or 20%, and $66.4 million, or 12%, respectively, for the fiscal year ended December 31, 2023 compared to the fiscal year ended December 31, 2022. Cement, ready-mix concrete and concrete block revenues grew strongly, rising by $97.0 million, $98.7 million and $23.2 million, respectively, for the fiscal year ended December 31, 2023 compared to the fiscal year ended December 31, 2022. Aggregates and fly ash saw moderate revenue growth of $4.3 million and $4.1 million, respectively, for the year ended December 31, 2023 compared to the fiscal year ended December 31, 2022. |
| | Average external sales prices increased by 13% in cement, 18% in aggregates, 18% in ready-mix concrete, 24% in concrete block and 10% in fly ash for the fiscal year ended December 31, 2023 compared to the fiscal year ended December 31, 2022. |
| | External sales volumes increased by 3% in cement and 15% in fly ash but declined by 11% in aggregates, 1% in ready-mix concrete and 3% in concrete block for the fiscal year ended December 31, 2023 compared to the fiscal year ended December 31, 2022. |
| | Operating income increased $128.6 million, or 133%, for the fiscal year ended December 31, 2023 compared to the fiscal year ended December 31, 2022, as a result of the $227.5 million growth in revenue, which more than offset the rises in cost of goods sold of $85.2 million, general and administrative expenses of $12.4 million, and selling expenses of $1.1 million for the fiscal year ended December 31, 2023 compared to the fiscal year ended December 31, 2022. |
| | Net income increased $92.5 million, or 148%, for the fiscal year ended December 31, 2023 compared to the fiscal year ended December 31, 2022, primarily driven by strong improvement in operating income offset by higher income tax expense resulting from higher income before income taxes and a slightly higher effective tax rate. |
| | Adjusted EBITDA increased $135.3 million, or 70%, for the fiscal year ended December 31, 2023 compared to the fiscal year ended December 31, 2022, as price improvements exceeded the impact of higher materials, labor, distribution, repairs and maintenance and general and administrative expenses. |
| | Net cash provided by operating activities increased to $227.1 million for the fiscal year ended December 31, 2023, compared to $178.4 million for the fiscal year ended December 31, 2022. |
| | Free Cash Flow increased to $108.5 million for the fiscal year ended December 31, 2023, compared to $50.4 million for the fiscal year ended December 31, 2022. |
| | Total Debt decreased to $409.4 million and our Ratio of Total Debt to Net Income declined to 2.6 to 1.0 at December 31, 2023 compared to $462.1 million and 7.4 to 1.0 at December 31, 2022. |
| | Net Debt decreased to $387.4 million and our Ratio of Net Debt to Adjusted EBITDA declined to 1.2 to 1.0 at December 31, 2023 compared to $432.3 million and 2.2 to 1.0 at December 31, 2022. |
Non-IFRS Measures
Adjusted EBITDA
We define Adjusted EBITDA, which is a non-IFRS financial measure we use to measure the performance of our business, as net income before finance cost, net, income tax expense, depreciation, depletion and amortization, further adjusted to remove the impact of additional items such as (gain)/loss on disposal of fixed assets, asset impairment (recovery)/loss, foreign exchange (gain)/loss, net, derivative financial instrument (gain)/loss, net, fair value loss on sale of accounts receivable, net, share-based compensation and other non-recurring items, including certain IPO transaction costs associated with this offering. Net income is the IFRS measure most directly comparable to Adjusted EBITDA.
80
Table of Contents
The table below presents our Adjusted EBITDA reconciled to net income for the periods indicated:
|
Nine Months Ended September 30, |
Years Ended December 31, |
|||||||||||||||||||
| ($ in thousands) | 2024 | 2023 | 2023 | 2022 | 2021 | |||||||||||||||
| Net income |
$ | 129,546 | $ | 109,800 | $ | 155,244 | $ | 62,721 | $ | 59,221 | ||||||||||
| Finance cost, net |
18,835 | 19,156 | 22,244 | 19,078 | 21,856 | |||||||||||||||
| Income tax expense |
43,899 | 38,427 | 47,134 | 16,971 | 15,336 | |||||||||||||||
| Depreciation, depletion and amortization |
69,024 | 63,798 | 91,079 | 87,728 | 81,731 | |||||||||||||||
| Loss on disposal of fixed assets |
1,454 | 736 | 3,852 | 1,186 | 141 | |||||||||||||||
| Asset impairment (recovery)/loss |
| | (609 | ) | 525 | | ||||||||||||||
| Foreign exchange loss/(gain), net |
7,467 | (1,970 | ) | 11,981 | (19,990 | ) | (28,835 | ) | ||||||||||||
| Derivative financial instrument (gain)/loss, net |
1,482 | 4,155 | (10,967 | ) | 18,534 | 25,915 | ||||||||||||||
| Fair value loss on sale of accounts receivable, net |
4,050 | 4,937 | 6,113 | 3,041 | 1,101 | |||||||||||||||
| Share-based compensation |
2,875 | 2,364 | 3,173 | 2,402 | 2,590 | |||||||||||||||
| IPO transaction costs(1) |
9,512 | | | | | |||||||||||||||
| Other(2) |
(1,266 | ) | (267 | ) | (871 | ) | 901 | (1,471 | ) | |||||||||||
|
|
|
|
|
|
|
|
|
|
|
|||||||||||
| Adjusted EBITDA |
$ | 286,878 | $ | 241,136 | $ | 328,373 | $ | 193,097 | $ | 177,585 | ||||||||||
|
|
|
|
|
|
|
|
|
|
|
|||||||||||
| (1) | In connection with this offering, we have incurred incremental expenses which primarily consist of consulting, legal, and accounting fees that are not indicative of our ongoing costs. |
| (2) | Other includes, but is not limited to, the impacts on provisions for long-term environmental rehabilitation costs, including provisions for quarry restoration, arising from changes in discount rates, recoveries from insurance claims and other exceptional (gains)/losses. |
Free Cash Flow
Free Cash Flow is a non-IFRS financial measure used by management to assess liquidity and quantify the amount of net cash provided by operating activities remaining after deducting the net amount of cash invested to maintain and expand the tangible and intangible assets used to support our business. Free Cash Flow is comprised of net cash provided by operating activities adjusted by net payments for capital expenditures, which includes (i) investments in property, plant and equipment, (ii) investments in identifiable intangible assets and (iii) proceeds from the sale of assets, net of disposition costs.
The IFRS measure most directly comparable to Free Cash Flow is net cash provided by operating activities. Reconciliation of Free Cash Flow to its nearest IFRS measure is presented below:
|
Nine Months Ended September 30, |
Years Ended December 31, |
|||||||||||||||||||
| ($ in thousands) | 2024 | 2023 | 2023 | 2022 | 2021 | |||||||||||||||
| Net cash provided by operating activities |
$ | 197,143 | $ | 142,415 | $ | 227,125 | $ | 178,374 | $ | 146,703 | ||||||||||
| Adjusted by: |
||||||||||||||||||||
| Investments in property, plant and equipment |
(113,213 | ) | (91,989 | ) | (117,144 | ) | (125,374 | ) | (62,269 | ) | ||||||||||
| Investments in identifiable intangible assets |
(333 | ) | 35 | (1,600 | ) | (2,896 | ) | (9,185 | ) | |||||||||||
| Proceeds from the sale of assets, net of disposition costs |
199 | 141 | 141 | 261 | 685 | |||||||||||||||
|
|
|
|
|
|
|
|
|
|
|
|||||||||||
| Net Capital Expenditures |
(113,347 | ) | (91,813 | ) | (118,603 | ) | (128,009 | ) | (70,769 | ) | ||||||||||
|
|
|
|
|
|
|
|
|
|
|
|||||||||||
| Free Cash Flow |
$ | 83,796 | $ | 50,602 | $ | 108,522 | $ | 50,365 | $ | 75,934 | ||||||||||
|
|
|
|
|
|
|
|
|
|
|
|||||||||||
81
Table of Contents
Net Debt
Net Debt is a non-IFRS financial measure as it comprises the sum of short and long-term debt and short and long-term lease liabilities less cash and cash equivalents. Net Debt is used by management to assess our operating performance, financial condition and measure the effective level of indebtedness of the Company. Reconciliation of Net Debt to its nearest IFRS measures is presented below:
| As of September 30, | As of December 31, | |||||||||||
| ($ in thousands) | 2024 | 2023 | 2022 | |||||||||
| Short-term borrowings, including accrued interest |
$ | 141,816 | $ | 267,670 | $ | 74,339 | ||||||
| Long-term borrowings |
227,858 | 76,262 | 320,167 | |||||||||
| Short-term lease liabilities |
11,901 | 11,737 | 13,532 | |||||||||
| Long-term lease liabilities |
57,615 | 53,744 | 54,055 | |||||||||
| Less: |
||||||||||||
| Cash and cash equivalents |
(12,149 | ) | (22,036 | ) | (29,841 | ) | ||||||
|
|
|
|
|
|
|
|||||||
| Net Debt |
$ | 427,041 | $ | 387,377 | $ | 432,252 | ||||||
|
|
|
|
|
|
|
|||||||
Ratio of Net Debt to Adjusted EBITDA
The Ratio of Net Debt to Adjusted EBITDA is a non-IFRS financial measure derived by dividing Net Debt by Adjusted EBITDA. The Company considers the ratio of net debt to Adjusted EBITDA to be a performance measure providing relevant financial leverage information to management, investors and other users of the Companys financial information. Reconciliations of Net Debt and Adjusted EBITDA to the nearest IFRS measures are presented above. The Companys Ratio of Net Debt to Adjusted EBITDA, and the ratio of each of the most directly comparable measures to Net Debt and Adjusted EBITDA presented in accordance with IFRS as of the dates shown was as follows:
|
As of Twelve Months Ended |
||||||||||||
| September 30, | December 31, | |||||||||||
| ($ in thousands) | 2024 | 2023 | 2022 | |||||||||
| IFRS: |
||||||||||||
| Short-term borrowings, including accrued interest |
$ | 141,816 | $ | 267,670 | $ | 74,339 | ||||||
| Long-term borrowings |
227,858 | 76,262 | 320,167 | |||||||||
| Short-term lease liabilities |
11,901 | 11,737 | 13,532 | |||||||||
| Long-term lease liabilities |
57,615 | 53,744 | 54,055 | |||||||||
|
|
|
|
|
|
|
|||||||
| Total Debt |
$ | 439,190 | $ | 409,413 | $ | 462,093 | ||||||
| Net Income(1) |
174,990 | 155,244 | 62,721 | |||||||||
| Ratio of Total Debt to Net Income |
2.5 | x | 2.6 | x | 7.4 | x | ||||||
| Non-IFRS: |
||||||||||||
| Net Debt |
$ | 427,041 | $ | 387,377 | $ | 432,252 | ||||||
| Adjusted EBITDA(2) |
$ | 374,115 | $ | 328,373 | $ | 193,097 | ||||||
| Ratio of Net Debt to Adjusted EBITDA(3) |
1.1 | x | 1.2 | x | 2.2 | x | ||||||
| (1) | Represents trailing twelve months Net Income. |
82
Table of Contents
| (2) | Represents trailing twelve months Adjusted EBITDA. The Company includes Adjusted EBITDA for the twelve months ended September 30, 2024 in order to calculate the Ratio of Net Debt to Adjusted EBITDA as of September 30, 2024. The trailing twelve months Adjusted EBITDA is derived using other component periods included elsewhere in this prospectus. The reconciliation of Net income to Adjusted EBITDA for the trailing twelve months ended September 30, 2024 was as follows: |
|
Twelve Months Ended September 30, |
||||
| ($ in thousands) | 2024 | |||
| Net income |
$ | 174,990 | ||
| Finance cost, net |
21,923 | |||
| Income tax expense |
52,606 | |||
| Depreciation, depletion and amortization |
96,305 | |||
| Loss on disposal of fixed assets |
4,570 | |||
| Asset impairment (recovery)/loss |
(609 | ) | ||
| Foreign exchange loss/(gain), net |
21,418 | |||
| Derivative financial instrument (gain)/loss, net |
(13,640 | ) | ||
| Fair value loss on sale of accounts receivable, net |
5,226 | |||
| Share-based compensation |
3,684 | |||
| IPO transaction costs |
9,512 | |||
| Other |
(1,870 | ) | ||
|
|
|
|||
| Adjusted EBITDA |
$ | 374,115 | ||
|
|
|
|||
| (3) | The Ratio of Net Debt to Adjusted EBITDA for the trailing twelve months represents Net Debt divided by Adjusted EBITDA for the trailing twelve months. |
Non-IFRS financial measures, including Adjusted EBITDA, Free Cash Flow, Net Debt and Ratio of Net Debt to Adjusted EBITDA are utilized by the Company to provide additional insights into its financial and operational performance that may not be apparent from IFRS measures alone. These supplemental measures can aid in the comparability of the Companys performance across different reporting periods by eliminating the effects of certain items that can vary significantly from one period to another, such as capital structure changes, non-operating items and other non-recurring or non-cash adjustments. Management finds these supplemental measures useful in assessing financial performance, operational efficiency, making strategic decisions and providing supplemental analysis of the Companys ability to generate cash, service debt and fund investments.
However, these non-IFRS measures have limitations and should not be considered in isolation or as a substitute for the IFRS financial measures. One key limitation is the lack of standardization, which means they may be defined and calculated differently by other companies, potentially leading to reduced comparability. Additionally, these measures may exclude costs that are necessary to understand the Companys overall financial performance. For instance, Adjusted EBITDA adjusts net income for certain items, but it is important to recognize that the Company may incur similar expenses in the future. Likewise, while Free Cash Flow indicates the cash which may be available for discretionary purposes, it does not account for non-discretionary expenditures such as debt service costs and income tax obligations. Net Debt provides insight into the net borrowing position, but it does not consider the liquidity and maturity profile of the underlying debt and cash and cash equivalents positions. The Ratio of Net Debt to Adjusted EBITDA provides insight into the Companys ability to pay debts, but it does not consider all liabilities and can be sensitive to short term changes in operating performance.
Investors and analysts are encouraged to evaluate each of these adjustments and the reasons management considers them appropriate for supplemental analysis. It is also essential to be aware that the Company may modify the presentation of these non-IFRS measures in the future, and any such modification may be material. As a result, these measures may not be indicative of future performance and may not be comparable to similarly titled measures used by other companies, thereby diminishing their utility. In summary, while non-IFRS measures can provide valuable additional context, they should be used in conjunction with the most directly comparable IFRS financial measures to ensure a balanced and comprehensive analysis of the Companys financial results.
83
Table of Contents
Components of Results of Operations
Revenue Substantially all of the Companys revenue is derived from sales of cement, fly ash, aggregates, ready-mix concrete and concrete block. Sales transactions result from customer requests received in response to Company quotes or negotiated purchase orders (collectively Orders). Orders specify products, contractual terms and conditions, estimated quantities, and pre-determined prices over established time periods. Once an Order is in place, the customer requests the delivery of specific products and volumes under the general terms and conditions contained therein.
Products remain the property of the Company until received by the customer, and the Company provides a warranty that the materials comply with the specifications contained in the Order. The contracts can generally be cancelled with or without cause at any time, with each party having responsibility for any rights and obligations accrued up to the time of termination. Each request by a customer under an Order produces a sales contract for the goods specified in such request. The Orders do not create enforceable rights or obligations on their own (an additional purchasing decision is required on the part of the customer). The warranties provided are assurance-type warranties and do not create separate performance obligations.
Revenue is primarily driven by factors such as construction activity levels, infrastructure development and urbanization trends, which influence the demand for our products. The construction industrys health, influenced by economic conditions, interest rates and government spending on infrastructure, directly impacts our sales volumes. Additionally, regional market trends, including weather and seasonality trends, demographic shifts and the fiscal health of state and local governments, are closely monitored as they can significantly impact performance and vary between different geographic regions, such as the Florida and Mid-Atlantic reportable segments. Product pricing is influenced by supply/demand balances, product performance, reliability and service offerings.
Cost of goods sold Cost of goods sold consists of all direct production and delivery costs and primarily includes material and inventory costs, payroll and employee-related expenses, energy and fuel costs, freight and distribution expenses, repairs and maintenance costs, taxes (other than income taxes), short-term rentals, risk insurance, depreciation, depletion and amortization and other miscellaneous costs.
Our cost of goods sold is directly affected by fluctuations in raw materials costs, labor costs and energy prices. As a result, our gross profit can be significantly affected by changes in the underlying costs if they are not recovered through corresponding changes in revenue.
Selling expense Selling expense represents the expenses associated with personnel, services and overhead involved specifically in sales activities. Selling expenses include payroll and related costs, overhead, travel and entertainment and other miscellaneous selling costs.
General and administrative expense General and administrative expense includes payroll and employee related expense, management fees, service contracts, office costs, bank fees, professional fees, depreciation and amortization and other related costs. As we transition to a public company, we estimate that our annual general and administrative expenses may increase solely as a result of the costs we expect to incur in establishing and maintaining Titan America, our Belgium-based holding company and the incremental compliance and reporting costs associated with being a public company including increased internal labor costs and external professional fees. This increase is anticipated to negatively impact our profitability in the near term. Over the long term, we aim to manage these expenses to align with our growth and operational efficiencies.
Net impairment losses on financial assets The Company assesses net impairment losses on financial assets such as trade receivables and derivative credit support payments, excluding derivatives at fair value through profit or loss, by estimating expected credit losses (ECLs). These ECLs represent the discounted difference between the contractual cash flows and the cash flows the Company anticipates receiving, using the assets original effective interest rate for discounting. For trade and other receivables, the Company employs a simplified approach, calculating lifetime expected credit losses to determine the appropriate allowance for impairment.
84
Table of Contents
Fair value loss on sale of accounts receivable, net The Company recognizes a fair value loss when it sells its trade accounts receivable to a Special Purpose Entity (SPE) at a discount. This discount reflects the time value of money, credit risk and other factors affecting the collectability of the receivables. The Company acts as the servicer for these receivables, handling credit administration and collections and receives a servicing fee from the SPE. The fair value loss is calculated net of the interest earned on notes receivable from the SPE and the servicing fees paid to the Company. Although the Company has transferred substantially all of the credit risks associated with the accounts receivable sold to the SPE, the Company may face potential losses on its notes receivable from the SPE if credit losses on the sold receivables exceed certain thresholds.
Finance cost, net Finance costs comprise interest expense on borrowings and leases, line of credit commitment fees, net interest costs on pension and other post-employment benefits, accretion expense on provisions and other related finance costs. Finance income includes interest earned on cash and cash equivalents and other short-term investments. The net amount represents total finance costs incurred less total finance income earned by the Company during the period.
Income/(loss) from associate Income/(loss) from associate reflects the Companys share of the results from its investment in Ash Venture LLC, which was dissolved on February 6, 2023.
Foreign exchange (loss)/gain, net The Company recognizes foreign exchange gains and losses which arise from settling transactions and revaluation of monetary assets and liabilities in foreign currencies (including the Companys Euro-denominated borrowings), using the prevailing spot rates. These translation differences, including those on non-monetary financial assets and liabilities, reflect the impact of currency fluctuations on the Companys financial position and results of operations, with the U.S. Dollar being the functional currency for our consolidated financial statements.
Derivative financial instrument gain/(loss), net The Company engages in derivative financial instruments, including cross-currency swaps, interest rate swaps and foreign exchange forwards, to manage its exposure to foreign currency and interest rate fluctuations. The derivatives are used to fix the U.S. Dollar cash flows associated with Euro denominated borrowings and to mitigate the impact of U.S. Dollar/Euro exchange rate variations on other short-term obligations. The net gain or loss on derivatives reflects the market conditions affecting the valuation of these financial instruments.
Income tax expense The Companys income tax expense reflects the sum of current taxes due and the effect of deferred taxes, which arise from temporary differences between the accounting and tax treatment of assets and liabilities. The effective tax rate results from applying the statutory tax rate and adjusting for differences in tax rates across the jurisdictions where the Company operates, as well as other permanent and temporary differences. Deferred tax assets are recognized for items expected to provide future tax benefits, while deferred tax liabilities are recorded for future tax obligations. The Companys tax strategy includes considerations for repatriating international earnings and managing changes in tax legislation, such as the OECD Pillar Two Model Rules (Pillar Two) minimum effective tax rate in Belgium.
85
Table of Contents
Consolidated Results of Operations
Comparison of the Nine Months Ended September 30, 2024 to the Nine Months Ended September 30, 2023
The following table sets forth a summary of our consolidated results of operations for the periods indicated:
|
Nine Months Ended September 30, |
||||||||||||||||
| ($ in thousands) | 2024 | 2023 | $ Change | % Change | ||||||||||||
| Revenue |
$ | 1,244,578 | $ | 1,192,464 | $ | 52,114 | 4 | % | ||||||||
| Cost of goods sold |
(923,653 | ) | (920,955 | ) | (2,698 | ) | 0 | % | ||||||||
|
|
|
|
|
|
|
|
|
|||||||||
| Gross profit |
320,925 | 271,509 | 49,416 | 18 | % | |||||||||||
|
|
|
|
|
|
|
|
|
|||||||||
| Selling expense |
(24,913 | ) | (21,271 | ) | (3,642 | ) | 17 | % | ||||||||
| General and administrative expense |
(91,823 | ) | (74,608 | ) | (17,215 | ) | 23 | % | ||||||||
| Net impairment losses on financial assets |
(251 | ) | (1,136 | ) | 885 | (78 | %) | |||||||||
| Fair value loss on sale of accounts receivable, net |
(4,050 | ) | (4,937 | ) | 887 | (18 | %) | |||||||||
| Other operating income, net |
1,341 | 11 | 1,330 | NM | ||||||||||||
|
|
|
|
|
|
|
|
|
|||||||||
| Operating income |
201,229 | 169,568 | 31,661 | 19 | % | |||||||||||
|
|
|
|
|
|
|
|
|
|||||||||
| Finance cost, net |
(18,835 | ) | (19,156 | ) | 321 | (2 | %) | |||||||||
| Foreign exchange (loss)/gain, net |
(7,467 | ) | 1,970 | (9,437 | ) | (479 | %) | |||||||||
| Derivative financial instrument loss, net |
(1,482 | ) | (4,155 | ) | 2,673 | (64 | %) | |||||||||
|
|
|
|
|
|
|
|
|
|||||||||
| Income before taxes |
173,445 | 148,227 | 25,218 | 17 | % | |||||||||||
|
|
|
|
|
|
|
|
|
|||||||||
| Income tax expense |
(43,899 | ) | (38,427 | ) | (5,472 | ) | 14 | % | ||||||||
|
|
|
|
|
|
|
|
|
|||||||||
| Net income |
$ | 129,546 | $ | 109,800 | $ | 19,746 | 18 | % | ||||||||
|
|
|
|
|
|
|
|
|
|||||||||
Revenue
The following table sets forth a summary of our consolidated revenue by segment for the periods indicated, and the changes between comparative periods.
|
Nine Months Ended September 30, |
||||||||||||||||
| ($ in thousands) | 2024 | 2023 | $ Change | % Change | ||||||||||||
| Florida reportable segment |
$ | 762,373 | $ | 729,314 | $ | 33,059 | 5 | % | ||||||||
| Mid-Atlantic reportable segment |
481,041 | 461,628 | 19,413 | 4 | % | |||||||||||
| STET segment(1) |
1,164 | 1,522 | (358 | ) | (24 | %) | ||||||||||
|
|
|
|
|
|
|
|
|
|||||||||
| Consolidated Revenue |
$ | 1,244,578 | $ | 1,192,464 | $ | 52,114 | 4 | % | ||||||||
|
|
|
|
|
|
|
|
|
|||||||||
| (1) | STET segment is a nonreportable operating segment that develops, manufactures, sells and services triboelectrostatic separators and related equipment used to beneficiate fly ash, industrial minerals and food and feed organics. See Prospectus SummaryThe Reorganization Transactions. |
86
Table of Contents
The following table presents our consolidated revenue by product type for the periods indicated:
| Nine Months Ended September 30, |
||||||||||||||||
| ($ in thousands) | 2024 | 2023 | $ Change | % Change | ||||||||||||
| Revenue |
||||||||||||||||
| Cement |
$ | 489,327 | $ | 491,571 | $ | (2,244 | ) | 0 | % | |||||||
| Aggregates |
60,399 | 64,786 | (4,387 | ) | (7 | %) | ||||||||||
| Ready-mix concrete |
557,178 | 515,846 | 41,332 | 8 | % | |||||||||||
| Concrete block |
119,715 | 103,835 | 15,880 | 15 | % | |||||||||||
| Fly ash |
16,488 | 14,438 | 2,050 | 14 | % | |||||||||||
| Equipment and related services (1) |
1,164 | 1,522 | (358 | ) | (24 | %) | ||||||||||
| Other goods and services |
307 | 466 | (159 | ) | (34 | %) | ||||||||||
|
|
|
|
|
|
|
|
|
|||||||||
| Consolidated Revenue |
$ | 1,244,578 | $ | 1,192,464 | $ | 52,114 | 4 | % | ||||||||
|
|
|
|
|
|
|
|
|
|||||||||
| (1) | Equipment and related services are attributable to the STET segment during the reporting periods presented. See Prospectus SummaryThe Reorganization Transactions. |
The following table presents our sales volumes and average external selling price by product for the periods indicated:
|
Nine Months Ended September 30, |
||||||||||||||||
| 2024 | 2023 | Change | % Change | |||||||||||||
| Volumes (thousands) (1)(2)(3) |
||||||||||||||||
| Total cement volumes |
4,334 | 4,419 | ||||||||||||||
| Cement consumed internally |
(1,079 | ) | (1,055 | ) | ||||||||||||
|
|
|
|
|
|||||||||||||
| External cement volumes |
3,255 | 3,364 | (109 | ) | (3 | %) | ||||||||||
| Total aggregates volumes |
5,363 | 5,286 | ||||||||||||||
| Aggregates consumed internally |
(2,860 | ) | (2,331 | ) | ||||||||||||
|
|
|
|
|
|||||||||||||
| External aggregates volumes |
2,503 | 2,955 | (452 | ) | (15 | %) | ||||||||||
| External ready-mix concrete volumes |
3,478 | 3,410 | 68 | 2 | % | |||||||||||
| External concrete block volumes |
50,260 | 44,834 | 5,426 | 12 | % | |||||||||||
| Total fly ash volumes |
433 | 400 | ||||||||||||||
| Fly ash consumed internally |
(103 | ) | (83 | ) | ||||||||||||
|
|
|
|
|
|||||||||||||
| External fly ash volumes |
330 | 317 | 13 | 4 | % | |||||||||||
| Average external selling price (4) |
||||||||||||||||
| Cement |
$ | 150.31 | $ | 146.13 | $ | 4.18 | 3 | % | ||||||||
| Aggregates |
$ | 24.13 | $ | 21.92 | $ | 2.21 | 10 | % | ||||||||
| Ready-mix concrete |
$ | 160.22 | $ | 151.28 | $ | 8.94 | 6 | % | ||||||||
| Concrete block |
$ | 2.38 | $ | 2.32 | $ | 0.06 | 3 | % | ||||||||
| Fly ash |
$ | 49.9 | $ | 45.55 | $ | 4.35 | 10 | % | ||||||||
| (1) | Sales volumes are shown in tons for cement, aggregates and fly ash; in cubic yards for ready-mix concrete; and in 8-inch equivalent units for concrete blocks. |
| (2) | Cement, aggregates and fly ash consumed internally represents the quantity of those materials transferred to our ready-mix concrete and concrete block production lines for use in the production process. Internal trading activity represents the consumption of internally sourced materials at a transfer price approximating market prices. These amounts are eliminated at the operating segment level or in consolidation, as appropriate. |
| (3) | Aggregates volumes exclude by-products. |
| (4) | Average external selling prices are shown on a per ton basis for cement, aggregates and fly ash; on a per cubic yard basis for ready-mix concrete; and on a per 8-inch equivalent unit for concrete blocks. |
87
Table of Contents
Consolidated revenues increased $52.1 million to $1,244.6 million for the nine months ended September 30, 2024 compared to $1,192.5 million for the nine months ended September 30, 2023, primarily driven by increases in product pricing across all product lines, which was partially offset by reduced volume in cement and aggregates. Segment external revenue in our Florida reportable segment increased $33.1 million, or 5%, to $762.4 million for the nine months ended September 30, 2024 from $729.3 million for the nine months ended September 30, 2023 while segment external revenue in our Mid-Atlantic reportable segment increased $19.4 million, or 4%, to $481.0 million for the nine months ended September 30, 2024 from $461.6 million for the nine months ended September 30, 2023.
Cement revenues decreased $2.2 million for the nine months ended September 30, 2024 compared to the nine months ended September 30, 2023, primarily attributable to a 3% decrease in the quantity of external volume sold, which was partially offset by a 3% increase in the average external selling price. Aggregates revenues decreased $4.4 million for the nine months ended September 30, 2024 compared to the nine months ended September 30, 2023, due to a 15% decrease in external volume sold, partially offset by a 10% increase in average external selling price. Revenues attributable to ready-mix concrete increased by $41.3 million for the nine months ended September 30, 2024 compared to the nine months ended September 30, 2023, due to a 6% increase in the average external selling price and a 2% increase in the quantity of external volume sold. Revenues attributable to concrete block increased $15.9 million for the nine months ended September 30, 2024 compared to the nine months ended September 30, 2023, with a 12% increase in volume sold and a 3% increase in average selling price. Additionally, fly ash revenues increased $2.1 million for the nine months ended September 30, 2024 compared to the nine months ended September 30, 2023, due to a 10% increase in the average external selling price and a 4% increase in external volume sold.
Cost of goods sold
Cost of goods sold increased $2.7 million to $923.7 million for the nine months ended September 30, 2024 compared to $921.0 million for the nine months ended September 30, 2023. Payroll and employee related expenses increased by $9.7 million as a result of wage inflation. In addition, we saw increases of $5.0 million in distribution expense arising primarily from higher depreciation and inflationary increases, and $6.3 million in repairs and maintenance costs, primarily related to the complexity and duration of periodic maintenance programs, for the nine months ended September 30, 2024 compared to the nine months ended September 30, 2023. These were offset by decreases of $8.9 million in materials and other inventory costs, and a $14.3 million decrease in inventory change. In addition, we saw decreases of $8.9 million in energy and fuel costs for the nine months ended September 30, 2024 compared to the nine months ended September 30, 2023, where our cement operations benefitted from lower unit costs of natural gas and an increase in the percentage of lower cost alternative fuels used in the manufacturing process. In addition, our cement, aggregates, ready-mix concrete and concrete block operations each benefited from lower average unit costs of diesel fuel. Cost of goods sold were 74% of our revenues for the nine months ended September 30, 2024 compared with 77% for the nine months ended September 30, 2023, as average selling price increases outpaced costs during the period.
Selling expense
Selling expense increased by $3.6 million, or 17%, to $24.9 million for the nine months ended September 30, 2024 compared to $21.3 million for the nine months ended September 30, 2023, primarily driven by an increase of $3.7 million in overhead costs (dues, professional fees, credit card fees, etc.). Selling expense accounted for 2% of our revenues for the nine months ended September 30, 2024 and the nine months ended September 30, 2023.
General and administrative expense
General and administrative expense increased by $17.2 million, or 23%, to $91.8 million for the nine months ended September 30, 2024 compared to $74.6 million for the nine months ended September 30, 2023, primarily driven by an increase of $7.1 million in payroll and employee-related expense and $5.6 million in professional
88
Table of Contents
fees. The increase in payroll and employee related expenses was attributable to an increase in headcount as we prepare to operate as a public company. The increase in professional fees resulted primarily from legal, accounting and other professional fees related to our anticipated public offering. General and administrative expenses accounted for 7% of our revenues for the for the nine months ended September 30, 2024 and 6% of our revenues for the nine months ended September 30, 2023.
Finance cost, net
Finance cost, net decreased by $0.3 million, or 2%, to $18.8 million for the nine months ended September 30, 2024 compared to $19.2 million for the nine months ended September 30, 2023, primarily driven by a decrease in interest expense on borrowings, including leases, of $0.8 million for the nine months ended September 30, 2024 compared to the nine months ended September 30, 2023. This was partially offset by a $0.7 million reduction in the benefit realized from favorable interest rate swaps.
Foreign exchange (loss)/gain, net
Foreign exchange (loss)/gain, net decreased by $9.4 million, to a $7.5 million loss for the nine months ended September 30, 2024 compared to a $2.0 million gain for the nine months ended September 30, 2023, almost exclusively driven by the remeasurement of euro-denominated loan obligations as the Euro strengthened against the U.S. Dollar during the period.
Derivative financial instrument gain/(loss), net
Derivative financial instrument loss, net decreased by $2.7 million, to a $1.5 million loss for the nine months ended September 30, 2024 compared to a $4.2 million loss for the nine months ended September 30, 2023, resulting from foreign exchange forwards, as well as cross-currency and interest rate swaps used to hedge our foreign exchange exposure in euro-denominated borrowings.
Income tax expense
Income tax expense increased by $5.5 million, or 14%, to $43.9 million for the nine months ended September 30, 2024 compared to $38.4 million for the nine months ended September 30, 2023. The change in income tax was primarily driven by an increase of $15.0 million in current tax expense, which was partially offset by a decrease of $9.5 million in deferred tax expense. The effective tax rate for the nine months ended September 30, 2024 was 25% compared to 26% for the nine months ended September 30, 2023.
89
Table of Contents
Comparison of the fiscal year ended December 31, 2023 to the fiscal year ended December 31, 2022
The following table sets forth a summary of our consolidated results of operations for the periods indicated:
| Years Ended December 31, | ||||||||||||||||
| ($ in thousands) | 2023 | 2022 | $ Change | % Change | ||||||||||||
| Revenue |
$ | 1,591,601 | $ | 1,364,146 | $ | 227,455 | 17 | % | ||||||||
| Cost of goods sold |
(1,228,112 | ) | (1,142,880 | ) | (85,232 | ) | 7 | % | ||||||||
|
|
|
|
|
|
|
|
|
|||||||||
| Gross profit |
363,489 | 221,266 | 142,223 | 64 | % | |||||||||||
|
|
|
|
|
|
|
|
|
|||||||||
| Selling expense |
(31,009 | ) | (29,938 | ) | (1,071 | ) | 4 | % | ||||||||
| General and administrative expense |
(99,909 | ) | (87,513 | ) | (12,396 | ) | 14 | % | ||||||||
| Net impairment losses on financial assets |
(1,224 | ) | (3,711 | ) | 2,487 | (67 | %) | |||||||||
| Fair value loss on sale of accounts receivable, net |
(6,113 | ) | (3,041 | ) | (3,072 | ) | 101 | % | ||||||||
| Other operating income/(loss), net |
402 | (21 | ) | 423 | NM | |||||||||||
|
|
|
|
|
|
|
|
|
|||||||||
| Operating income |
225,636 | 97,042 | 128,594 | 133 | % | |||||||||||
|
|
|
|
|
|
|
|
|
|||||||||
| Finance cost, net |
(22,244 | ) | (19,078 | ) | (3,166 | ) | 17 | % | ||||||||
| Income/(loss) from associate |
| 272 | (272 | ) | (100 | %) | ||||||||||
| Foreign exchange (loss)/gain, net |
(11,981 | ) | 19,990 | (31,971 | ) | (160 | %) | |||||||||
| Derivative financial instrument gain/(loss), net |
10,967 | (18,534 | ) | 29,501 | (159 | %) | ||||||||||
|
|
|
|
|
|
|
|
|
|||||||||
| Income before taxes |
202,378 | 79,692 | 122,686 | 154 | % | |||||||||||
|
|
|
|
|
|
|
|
|
|||||||||
| Income tax expense |
(47,134 | ) | (16,971 | ) | (30,163 | ) | 178 | % | ||||||||
|
|
|
|
|
|
|
|
|
|||||||||
| Net income |
$ | 155,244 | $ | 62,721 | $ | 92,523 | 148 | % | ||||||||
|
|
|
|
|
|
|
|
|
|||||||||
Revenue
The following table sets forth a summary of our consolidated revenue by segment for the years indicated, and the changes between comparative years.
| Years Ended December 31, | ||||||||||||||||
| ($ in thousands) | 2023 | 2022 | $ Change | % Change | ||||||||||||
| Florida reportable segment |
$ | 969,932 | $ | 808,558 | $ | 161,374 | 20 | % | ||||||||
| Mid-Atlantic reportable segment |
619,683 | 553,335 | 66,348 | 12 | % | |||||||||||
| STET segment(1) |
1,986 | 2,253 | (267 | ) | (12 | %) | ||||||||||
|
|
|
|
|
|
|
|
|
|||||||||
| Consolidated Revenue |
$ | 1,591,601 | $ | 1,364,146 | $ | 227,455 | 17 | % | ||||||||
|
|
|
|
|
|
|
|
|
|||||||||
| (1) | STET segment is a nonreportable operating segment that develops, manufactures, sells and services triboelectrostatic separators and related equipment used to beneficiate fly ash, industrial minerals and food and feed organics. See Prospectus SummaryThe Reorganization Transactions. |
The following table presents our consolidated revenue by product type for the periods indicated:
| Years Ended December 31, | ||||||||||||||||
| ($ in thousands) | 2023 | 2022 | $ Change | % Change | ||||||||||||
| Revenue |
||||||||||||||||
| Cement |
$ | 657,332 | $ | 560,320 | $ | 97,012 | 17 | % | ||||||||
| Aggregates |
83,438 | 79,147 | 4,291 | 5 | % | |||||||||||
| Ready-mix concrete |
688,236 | 589,553 | 98,683 | 17 | % | |||||||||||
| Concrete block |
140,128 | 116,929 | 23,199 | 20 | % | |||||||||||
| Fly ash |
19,833 | 15,687 | 4,146 | 26 | % | |||||||||||
| Equipment and related services(1) |
1,986 | 2,253 | (267 | ) | (12 | %) | ||||||||||
| Other goods and services |
648 | 257 | 391 | 152 | % | |||||||||||
|
|
|
|
|
|
|
|
|
|||||||||
| Consolidated Revenue |
$ | 1,591,601 | $ | 1,364,146 | $ | 227,455 | 17 | % | ||||||||
|
|
|
|
|
|
|
|
|
|||||||||
| (1) | Equipment and related services are attributable to the STET segment during the reporting periods presented. See Prospectus SummaryThe Reorganization Transactions. |
90
Table of Contents
The following table presents our sales volumes and average external selling price by product for the periods indicated:
| Years Ended December 31, |
||||||||||||||||
| 2023 | 2022 | Change | % Change | |||||||||||||
| Volumes (thousands)(1)(2)(3) |
||||||||||||||||
| Total cement volumes |
5,875 | 5,743 | ||||||||||||||
| Cement consumed internally |
(1,393 | ) | (1,411 | ) | ||||||||||||
|
|
|
|
|
|||||||||||||
| External cement volumes |
4,482 | 4,332 | 150 | 3 | % | |||||||||||
| Total aggregates volumes |
6,733 | 7,305 | ||||||||||||||
| Aggregates consumed internally |
(2,983 | ) | (3,108 | ) | ||||||||||||
|
|
|
|
|
|||||||||||||
| External aggregates volumes |
3,750 | 4,197 | (447 | ) | (11 | %) | ||||||||||
| External ready-mix concrete volumes |
4,507 | 4,557 | (50 | ) | (1 | %) | ||||||||||
| External concrete block volumes |
60,261 | 62,116 | (1,855 | ) | (3 | %) | ||||||||||
| Total fly ash volumes |
547 | 486 | ||||||||||||||
| Fly ash consumed internally |
(114 | ) | (108 | ) | ||||||||||||
|
|
|
|
|
|||||||||||||
| External fly ash volumes |
433 | 378 | 55 | 15 | % | |||||||||||
| Average external selling price(4) |
||||||||||||||||
| Cement |
$ | 146.65 | $ | 129.34 | $ | 17.31 | 13 | % | ||||||||
| Aggregates |
$ | 22.25 | $ | 18.86 | $ | 3.39 | 18 | % | ||||||||
| Ready-mix concrete |
$ | 152.69 | $ | 129.36 | $ | 23.33 | 18 | % | ||||||||
| Concrete block |
$ | 2.33 | $ | 1.88 | $ | 0.45 | 24 | % | ||||||||
| Fly ash |
$ | 45.80 | $ | 41.47 | $ | 4.33 | 10 | % | ||||||||
| (1) | Sales volumes are shown in tons for cement, aggregates and fly ash; in cubic yards for ready-mix concrete; and in 8-inch equivalent units for concrete blocks. |
| (2) | Cement, aggregates and fly ash consumed internally represents the quantity of those materials transferred to our ready-mix concrete and concrete block production lines for use in the production process. Internal trading activity represents the consumption of internally sourced materials at a transfer price approximating market prices. These amounts are eliminated at the operating segment level or in consolidation, as appropriate. |
| (3) | Aggregates volumes exclude by-products. |
| (4) | Average external selling prices are shown on a per ton basis for cement, aggregates and fly ash; on a per cubic yard basis for ready-mix concrete; and on a per 8-inch equivalent unit for concrete blocks. |
Consolidated revenues increased $227.5 million to $1,591.6 million for the fiscal year ended December 31, 2023 compared to $1,364.1 million for the fiscal year ended December 31, 2022, primarily driven by increases in product pricing in both reportable segments which was partially offset by reduced volume in aggregates, ready-mix concrete and concrete blocks. Segment external revenue in our Florida reportable segment increased $161.4 million, or 20%, to $969.9 million for the fiscal year ended December 31, 2023 from $808.6 million for the fiscal year ended December 31, 2022 while segment external revenue in our Mid-Atlantic reportable segment increased $66.4 million, or 12%, to $619.7 million for the fiscal year ended December 31, 2023 from $553.3 million for the fiscal year ended December 31, 2022.
Cement revenues increased $97.0 million for the fiscal year ended December 31, 2023 compared to the fiscal year ended December 31, 2022, primarily attributed to a 13% increase in the average external selling price and a 3% increase in the quantity of external volume sold. Aggregates revenues increased $4.3 million for the fiscal year ended December 31, 2023 compared to the fiscal year ended December 31, 2022, due to an 18% increase in the average external selling price partially offset by an 11% decrease in external volume sold. Revenues attributable to ready-mix concrete increased by $98.7 million for the fiscal year ended December 31, 2023 compared to the fiscal year ended December 31, 2022, due to an 18% increase in the average selling price, partially offset by a 1% decrease in volume sold. Revenues attributable to concrete blocks increased $23.2 million for the fiscal year ended December 31, 2023 compared to the fiscal year ended December 31, 2022,
91
Table of Contents
with a 24% increase in the average selling price, partially offset by a 3% decrease in volume sold. Additionally, fly ash revenues increased $4.1 million for the fiscal year ended December 31, 2023 compared to the fiscal year ended December 31, 2022, due to a 10% increase in the average external selling price and a 15% increase in external volume sold.
Cost of goods sold
Cost of goods sold increased by $85.2 million, or 7%, to $1,228.1 million for the fiscal year ended December 31, 2023 compared to $1,142.9 million for the fiscal year ended December 31, 2022, primarily driven by increases of $53.4 million in material and other inventory costs, $30.0 million in payroll and employee related expenses. The increase in material and other inventory costs was primarily due to increased cement import volumes and higher unit costs of raw materials such as aggregates purchased from third parties for use in our ready-mix concrete and concrete block operations. Payroll and employee related costs increased as a result of higher wage inflation and the impact of overtime payments. In addition, we saw increases of $8.7 million in short-term equipment rentals, $7.0 million in distribution expense arising primarily from an increase in the quantity of materials distributed via our rail connected distribution network, and $6.7 million in repairs and maintenance costs, primarily related to the complexity and duration of periodic maintenance programs, for the fiscal year ended December 31, 2023 compared to the fiscal year ended December 31, 2022. These were partially offset by a decrease of $17.4 million in energy and fuel costs where our cement operations benefitted from lower unit costs of natural gas and an increase in the percentage of lower cost alternative fuels used in the manufacturing process. In addition, our cement, aggregates, ready-mix concrete and concrete block operations each benefited from lower average unit costs of diesel fuel. Cost of goods sold were 77% of our revenues for the fiscal year ended December 31, 2023, compared to 84% for the fiscal year ended December 31, 2022 as average selling price increases outpacing cost increases during the period.
Selling expense
Selling expense increased by $1.1 million, or 4%, to $31.0 million for the fiscal year ended December 31, 2023 compared to $29.9 million for the fiscal year ended December 31, 2022, primarily driven by an increase of $1.2 million in overhead costs (dues, professional fees, credit card fees, etc.). Selling expense accounted for 2% of our revenues for the fiscal year ended December 31, 2023 and the fiscal year ended December 31, 2022.
General and administrative expense
General and administrative expense increased by $12.4 million, or 14%, to $99.9 million for the fiscal year ended December 31, 2023 compared to $87.5 million for the fiscal year ended December 31, 2022, primarily driven by an increase of $4.4 million in payroll and employee-related expense and $3.1 million in professional fees. The increase in payroll and employee related expenses was attributable to increases in headcount and labor inflation. General and administrative expenses accounted for 6% of our revenues for the fiscal year ended December 31, 2023 and for the fiscal year ended December 31, 2022.
Finance cost, net
Finance cost, net increased by $3.2 million, or 17%, to $22.2 million for the fiscal year ended December 31, 2023 compared to $19.1 million for the fiscal year ended December 31, 2022, primarily driven by a $3.6 million reduction in the benefit realized from favorable interest rate swaps executed in 2022. In addition, interest expense on borrowings, including leases, increased $1.7 million for the fiscal year ended December 31, 2023 compared to the fiscal year ended December 31, 2022. This was partially offset by increases in capitalized interest of $2.4 million resulting from higher qualifying capital project construction costs.
Foreign exchange (loss)/gain, net
Foreign exchange (loss)/gain, net decreased by $32.0 million, to a $12.0 million loss for the fiscal year ended December 31, 2023 compared to a $20.0 million gain for the fiscal year ended December 31, 2022, almost exclusively driven by the remeasurement of euro-denominated loan obligations as the Euro strengthened against the U.S. Dollar during the period.
92
Table of Contents
Derivative financial instrument gain/(loss), net
Derivative financial instrument gain/(loss), net increased by $29.5 million, to an $11.0 million gain for the fiscal year ended December 31, 2023 compared to a $18.5 million loss for the fiscal year ended December 31, 2022, resulting from foreign exchange forwards, as well as cross-currency and interest rate swaps used to hedge our foreign exchange exposure in euro-denominated borrowings.
Income tax expense
Income tax expense increased by $30.2 million, or 178%, to $47.1 million for the fiscal year ended December 31, 2023 compared to $17.0 million for the fiscal year ended December 31, 2022, primarily driven by an increase of $37.5 million in current tax expense. This was partially offset by a decrease of $7.3 million in deferred tax expense resulting in an effective tax rate of 23% for the fiscal year ended December 31, 2023 compared to 21% for the fiscal year ended December 31, 2022.
Comparison of the fiscal year ended December 31, 2022 to the fiscal year ended December 31, 2021
The following table sets forth a summary of our consolidated results of operations for the periods indicated:
| Years Ended December 31, | ||||||||||||||||
| ($ in thousands) | 2022 | 2021 | $ Change | % Change | ||||||||||||
| Revenue |
$ | 1,364,146 | $ | 1,152,417 | $ | 211,729 | 18 | % | ||||||||
| Cost of goods sold |
(1,142,880 | ) | (956,261 | ) | (186,619 | ) | 20 | % | ||||||||
|
|
|
|
|
|
|
|
|
|||||||||
| Gross profit |
221,266 | 196,156 | 25,110 | 13 | % | |||||||||||
|
|
|
|
|
|
|
|
|
|||||||||
| Selling expense |
(29,938 | ) | (24,724 | ) | (5,214 | ) | 21 | % | ||||||||
| General and administrative expense |
(87,513 | ) | (76,292 | ) | (11,221 | ) | 15 | % | ||||||||
| Net impairment losses on financial assets |
(3,711 | ) | (937 | ) | (2,774 | ) | 296 | % | ||||||||
| Fair value loss on sale of accounts receivable, net |
(3,041 | ) | (1,101 | ) | (1,940 | ) | 176 | % | ||||||||
| Other operating income/(loss), net |
(21 | ) | 1,073 | (1,094 | ) | (102 | %) | |||||||||
|
|
|
|
|
|
|
|
|
|||||||||
| Operating income |
97,042 | 94,175 | 2,867 | 3 | % | |||||||||||
|
|
|
|
|
|
|
|
|
|||||||||
| Finance cost, net |
(19,078 | ) | (21,856 | ) | 2,778 | (13 | %) | |||||||||
| Income/(loss) from associate |
272 | (682 | ) | 954 | 140 | % | ||||||||||
| Foreign exchange (loss)/gain, net |
19,990 | 28,835 | (8,845 | ) | (31 | %) | ||||||||||
| Derivative financial instrument gain/(loss), net |
(18,534 | ) | (25,915 | ) | 7,381 | (28 | %) | |||||||||
|
|
|
|
|
|
|
|
|
|||||||||
| Income before taxes |
79,692 | 74,557 | 5,135 | 7 | % | |||||||||||
|
|
|
|
|
|
|
|
|
|||||||||
| Income tax expense |
(16,971 | ) | (15,336 | ) | (1,635 | ) | 11 | % | ||||||||
|
|
|
|
|
|
|
|
|
|||||||||
| Net income |
$ | 62,721 | $ | 59,221 | $ | 3,500 | 6 | % | ||||||||
|
|
|
|
|
|
|
|
|
|||||||||
Revenue
The following table sets forth a summary of our consolidated revenue by segment for the years indicated, and the changes between comparative years.
| Years Ended December 31, | ||||||||||||||||
| ($ in thousands) | 2022 | 2021 | $ Change | % Change | ||||||||||||
| Florida reportable segment |
$ | 808,558 | $ | 667,689 | $ | 140,869 | 21 | % | ||||||||
| Mid-Atlantic reportable segment |
553,335 | 481,908 | 71,427 | 15 | % | |||||||||||
| STET segment(1) |
2,253 | 2,820 | (567 | ) | (20 | %) | ||||||||||
|
|
|
|
|
|
|
|
|
|||||||||
| Consolidated Revenue |
$ | 1,364,146 | $ | 1,152,417 | $ | 211,729 | 18 | % | ||||||||
|
|
|
|
|
|
|
|
|
|||||||||
| (1) | STET segment is a nonreportable operating segment that develops, manufactures, sells and services triboelectrostatic separators and related equipment used to beneficiate fly ash, industrial minerals, and food and feed organics. See Prospectus SummaryThe Reorganization Transactions. |
93
Table of Contents
The following table presents our consolidated revenue by product for the periods indicated:
| Years Ended December 31, | ||||||||||||||||
| ($ in thousands) | 2022 | 2021 | $ Change | % Change | ||||||||||||
| Revenue |
||||||||||||||||
| Cement |
$ | 560,320 | $ | 433,067 | $ | 127,253 | 29 | % | ||||||||
| Aggregates |
79,147 | 73,595 | 5,552 | 8 | % | |||||||||||
| Ready-mix concrete |
589,553 | 530,878 | 58,675 | 11 | % | |||||||||||
| Concrete block |
116,929 | 96,554 | 20,375 | 21 | % | |||||||||||
| Fly ash |
15,687 | 14,831 | 856 | 6 | % | |||||||||||
| Equipment and related services(1) |
2,253 | 2,820 | (567 | ) | (20 | %) | ||||||||||
| Other goods and services |
257 | 672 | (415 | ) | (62 | %) | ||||||||||
|
|
|
|
|
|
|
|
|
|||||||||
| Consolidated Revenue |
$ | 1,364,146 | $ | 1,152,417 | $ | 211,729 | 18 | % | ||||||||
|
|
|
|
|
|
|
|
|
|||||||||
| (1) | Equipment and related services are attributable to the STET segment during the reporting periods presented. See Prospectus SummaryThe Reorganization Transactions. |
The following table presents our sales volumes and average external selling price by product for the periods indicated:
| Years Ended December 31, |
||||||||||||||||
| 2022 | 2021 | Change | % Change | |||||||||||||
| Volumes (thousands)(1)(2)(3) |
||||||||||||||||
| Total cement volumes |
5,743 | 5,279 | ||||||||||||||
| Cement consumed internally |
(1,411 | ) | (1,410 | ) | ||||||||||||
|
|
|
|
|
|||||||||||||
| External cement volumes |
4,332 | 3,869 | 463 | 12 | % | |||||||||||
| Total aggregates volumes |
7,305 | 7,934 | ||||||||||||||
| Aggregates consumed internally |
(3,108 | ) | (3,522 | ) | ||||||||||||
|
|
|
|
|
|||||||||||||
| External aggregates volumes |
4,197 | 4,412 | (215 | ) | (5 | %) | ||||||||||
| External ready-mix concrete volumes |
4,557 | 4,763 | (206 | ) | (4 | %) | ||||||||||
| External concrete block volumes |
62,116 | 68,165 | (6,049 | ) | (9 | %) | ||||||||||
| Total fly ash volumes |
486 | 473 | ||||||||||||||
| Fly ash consumed internally |
(108 | ) | (127 | ) | ||||||||||||
|
|
|
|
|
|||||||||||||
| External fly ash volumes |
378 | 346 | 32 | 9 | % | |||||||||||
| Average external selling price(4) |
||||||||||||||||
| Cement |
$ | 129.34 | $ | 111.93 | $ | 17.41 | 16 | % | ||||||||
| Aggregates |
$ | 18.86 | $ | 16.68 | $ | 2.18 | 13 | % | ||||||||
| Ready-mix concrete |
$ | 129.36 | $ | 111.45 | $ | 17.91 | 16 | % | ||||||||
| Concrete block |
$ | 1.88 | $ | 1.42 | $ | 0.46 | 32 | % | ||||||||
| Fly ash |
$ | 41.47 | $ | 42.86 | $ | (1.39 | ) | (3 | %) | |||||||
| (1) | Sales volumes are shown in tons for cement, aggregates and fly ash; in cubic yards for ready-mix concrete; and in 8-inch equivalent units for concrete blocks. |
| (2) | Cement, aggregates and fly ash consumed internally represents the quantity of those materials transferred to our ready-mix concrete and concrete block production lines for use in the production process. Internal trading activity represents the consumption of internally sourced materials at a transfer price approximating market prices. These amounts are eliminated at the operating segment level or in consolidation, as appropriate. |
| (3) | Aggregates volumes exclude by-products. |
| (4) | Average external selling prices are shown on a per ton basis for cement, aggregates and fly ash; on a per cubic yard basis for ready-mix concrete; and on a per 8-inch equivalent unit for concrete blocks. |
Our consolidated revenue for the fiscal year ended December 31, 2022 was $1,364.1 million, compared to $1,152.4 million for the fiscal year ended December 31, 2021, representing an increase of $211.7 million, or 18%, primarily driven by increases in product pricing in both reportable segments, which was partially offset by reduced
94
Table of Contents
volume in aggregates, ready-mix concrete and concrete blocks. Segment external revenue in our Florida reportable segment increased $140.9 million, or 21%, to $808.6 million for the fiscal year ended December 31, 2022 from $667.7 million for the fiscal year ended December 31, 2021 while segment external revenue in our Mid-Atlantic reportable segment increased $71.4 million, or 15%, to $553.3 million for the fiscal year ended December 31, 2022 from $481.9 million for the fiscal year ended December 31, 2021.
Cement revenues increased $127.3 million for the fiscal year ended December 31, 2022 compared to the fiscal year ended December 31, 2021, primarily attributed to a 16% increase in average external selling price and a 12% increase in the quantity of external volume sold. Aggregates revenues increased $5.6 million for the fiscal year ended December 31, 2022 compared to the fiscal year ended December 31, 2021, primarily attributed to a 13% increase in average external selling price, partially offset by a 5% decrease in external volume sold. Revenues attributable to ready-mix concrete increased $58.7 million for the fiscal year ended December 31, 2022 compared to the fiscal year ended December 31, 2021, due to a 16% increase in average selling price, partially offset by a 4% decrease in volume sold. Revenues attributable to concrete blocks increased $20.4 million for the fiscal year ended December 31, 2022 compared to the fiscal year ended December 31, 2021, due to a 32% increase in average selling price, partially offset by a 9% decrease in volume sold.
Cost of goods sold
Cost of goods sold increased by $186.6 million, or 20%, to $1,142.9 million for the fiscal year ended December 31, 2022 compared to $956.3 million for the fiscal year ended December 31, 2021, primarily driven by increases of $130.9 million in material and other inventory costs, $41.4 million in energy and fuel costs and $16.1 million in payroll and employee related expenses. The increase in material and other inventory costs was primarily due to increased cement import volumes, higher unit costs of cement imports (including higher sea-freight rates) and higher unit costs of raw materials such as aggregates purchased from third parties for use in our ready-mix concrete and concrete block operations. Energy and fuel costs were negatively impacted by the rising cost of natural gas used in our cement plants, the related impact on electricity charges from regional utilities and the higher average cost of diesel fuel consumed in our cement, aggregates, ready-mix concrete and concrete block operations. Payroll and employee related costs increased as a result of higher wage inflation and the impact of overtime payments. In addition, we saw increases of $9.4 million in distribution expense arising primarily from an increase in the quantity of materials distributed via our rail connected distribution network, $6.3 million in depreciation, depletion and amortization, and $4.6 million in freight expense, for the fiscal year ended December 31, 2022 compared to the fiscal year ended December 31, 2021. These were partially offset by decreases of $13.5 million in repairs and maintenance, primarily related to the complexity and duration of periodic maintenance programs, and $11.5 million in inventory changes, for the fiscal year ended December 31, 2022 compared to the fiscal year ended December 31, 2021. Cost of goods sold were 84% of our revenues for the fiscal year ended December 31, 2022, compared to 83% for the fiscal year ended December 31, 2021.
Selling expense
Selling expense increased by $5.2 million, or 21%, to $29.9 million for the fiscal year ended December 31, 2022 compared to $24.7 million for the fiscal year ended December 31, 2021, primarily driven by an increase of $2.5 million in overhead costs (dues, professional fees, credit card fees, etc.). Selling expense accounted for 2% of our revenues for the fiscal year ended December 31, 2022 2021.
General and administrative expense
General and administrative expense increased by $11.2 million, or 15%, to $87.5 million for the fiscal year ended December 31, 2022 compared to $76.3 million for the fiscal year ended December 31, 2021, primarily driven by an increase of $4.7 million in payroll and employee related expense. The increase in payroll and related expense was primarily due to increases in headcount and labor inflation. In addition, management fees allocated from related parties rendering administrative support services increased by $3.0 million for the fiscal year ended December 31, 2022 as compared to the fiscal year ended December 31, 2021. General and administrative expenses accounted for 6% of our revenues for the fiscal year ended December 31, 2022, compared to 7% for the fiscal year ended December 31, 2021.
95
Table of Contents
Finance cost, net
Finance cost, net decreased by $2.8 million, or 13%, to $19.1 million for the fiscal year ended December 31, 2022 compared to $21.9 million for the fiscal year ended December 31, 2021, primarily driven by a $3.5 million benefit realized from favorable interest rate swaps executed in the year.
Foreign exchange gain, net
Foreign exchange gain, net decreased by $8.8 million to $20.0 million for the fiscal year ended December 31, 2022 compared to $28.8 million for the fiscal year ended December 31, 2021, primarily driven by the remeasurement of euro-denominated loan obligations as the weakening of the Euro against the U.S. Dollar decelerated during the period.
Derivative financial instrument (loss), net
Derivative financial instrument (loss), net decreased by $7.4 million, to an $18.5 million for the fiscal year ended December 31, 2022 compared to $25.9 million for the fiscal year ended December 31, 2021, primarily driven by foreign exchange forwards and cross-currency and interest rate swaps used to hedge our foreign exchange exposure in euro-denominated borrowings.
Income tax expense
Income tax expense increased by $1.6 million, or 11%, to $17.0 million for the fiscal year ended December 31, 2022 compared to $15.3 million for the fiscal year ended December 31, 2021, primarily driven by an increase of $5.5 million in current tax expense. This was partially offset by a decrease of $3.9 million in deferred tax expense resulting in an effective tax rate of 21% for the fiscal year ended December 31, 2022 and 2021.
Reportable Segment Results of Operations
Florida Reportable Segment
Comparison of the nine months ended September 30, 2024 to the nine months ended September 30, 2023
The following table presents segment external revenue and segment adjusted EBITDA for our Florida reportable segment for the periods indicated:
| Nine Months Ended September 30, |
||||||||||||||||
| ($ in thousands) | 2024 | 2023 | $ Change | % Change | ||||||||||||
| Segment external revenue |
$ | 762,373 | $ | 729,314 | $ | 33,059 | 5 | % | ||||||||
| Segment adjusted EBITDA |
$ | 196,962 | $ | 159,730 | $ | 37,232 | 23 | % | ||||||||
96
Table of Contents
The following tables presents revenue by product type for our Florida reportable segment for the periods indicated:
| Nine Months Ended September 30, |
||||||||||||||||
| 2024 | 2023 | $ Change | % Change | |||||||||||||
| Revenue by product type(1) |
||||||||||||||||
| Cement |
$ | 324,415 | $ | 318,705 | $ | 5,710 | 2 | % | ||||||||
| Aggregates |
117,159 | 106,914 | 10,245 | 10 | % | |||||||||||
| Ready-mix concrete |
353,524 | 337,586 | 15,938 | 5 | % | |||||||||||
| Concrete block |
119,716 | 103,835 | 15,881 | 15 | % | |||||||||||
| Fly ash |
14,546 | 12,030 | 2,516 | 21 | % | |||||||||||
| Other goods and services |
12,828 | 15,919 | (3,091 | ) | (19 | %) | ||||||||||
|
|
|
|
|
|
|
|
|
|||||||||
| Revenue (including internal trading) |
942,188 | 894,989 | 47,199 | 5 | % | |||||||||||
|
|
|
|
|
|
|
|
|
|||||||||
| Less: Internal trading activity(2) |
(179,815 | ) | (165,675 | ) | (14,140 | ) | ||||||||||
|
|
|
|
|
|
|
|
|
|||||||||
| Segment External Revenue |
$ | 762,373 | $ | 729,314 | $ | 33,059 | 5 | % | ||||||||
|
|
|
|
|
|
|
|
|
|||||||||
| (1) | Revenues by product type consist of sales to third parties and internal trading activity at a transfer price approximating market price. |
| (2) | Internal trading activity represents the consumption of internally sourced materials at a transfer price approximating market price. These amounts are eliminated at the operating segment level or in consolidation, as appropriate. |
Our Florida reportable segments percent changes in sales volumes (including internal trading activity) and average sales prices for the nine months ended September 30, 2024, as compared to the nine months ended September 30, 2023, were as follows:
| % Change in Volumes |
% Change in Average Price |
|||||||
| Cement |
(2 | %) | 4 | % | ||||
| Aggregates |
2 | % | 8 | % | ||||
| Ready-mix concrete |
(1 | %) | 6 | % | ||||
| Concrete block |
12 | % | 3 | % | ||||
| Fly ash |
13 | % | 7 | % | ||||
Segment external revenue in our Florida reportable segment increased $33.1 million, or 5%, to $762.4 million for the nine months ended September 30, 2024 compared to $729.3 million for the nine months ended September 30, 2023, driven by increases in the cement, aggregates, ready-mix concrete, concrete block and fly ash product lines. Revenue from cement increased $5.7 million resulting from a 4% increase in average price on 2% lower volumes sold for the nine months ended September 30, 2024 compared to the nine months ended September 30, 2023. Revenue from aggregates increased $10.2 million resulting from a 2% increase in aggregates volumes and an 8% increase in average price for the nine months ended September 30, 2024 as compared to the nine months ended September 30, 2023. Ready-mix concrete revenues grew by $15.9 million for the nine months ended September 30, 2024 compared to the nine months ended September 30, 2023 as a 1% decline in volumes was more than offset by a 6% increase in average prices. Likewise, when compared to the nine months ended September 30, 2023, concrete block revenues increased by $15.9 million resulting from a 12% increase in aggregates volumes and an 3% increase in average price for the nine months ended September 30, 2024 as compared to the nine months ended September 30, 2023.
Segment adjusted EBITDA for the Florida reportable segment increased $37.2 million, or 23%, to $197.0 million for the nine months ended September 30, 2024 compared to $159.7 million for the nine months ended September 30, 2023. The increase in segment adjusted EBITDA for the nine months ended September 30, 2024 occurred primarily due to increases in average prices for all product lines and the benefit of lower fuel and energy costs, which outpaced the cost of materials and other input costs.
97
Table of Contents
Comparison of the fiscal year ended December 31, 2023 to the fiscal year ended December 31, 2022
The following table presents segment external revenue and segment adjusted EBITDA for our Florida reportable segment for the periods indicated:
| Years Ended December 31, | ||||||||||||||||
| ($ in thousands) | 2023 | 2022 | $ Change | % Change | ||||||||||||
| Segment external revenue |
$ | 969,932 | $ | 808,558 | $ | 161,374 | 20 | % | ||||||||
| Segment adjusted EBITDA |
$ | 221,227 | $ | 130,520 | $ | 90,707 | 69 | % | ||||||||
The following tables presents revenue by product type for our Florida reportable segment for the periods indicated:
| Years Ended December 31, | ||||||||||||||||
| ($ in thousands) | 2023 | 2022 | $ Change | % Change | ||||||||||||
| Revenue by product type(1) |
||||||||||||||||
| Cement |
$ | 423,137 | $ | 351,819 | $ | 71,318 | 20 | % | ||||||||
| Aggregates |
137,986 | 131,321 | 6,665 | 5 | % | |||||||||||
| Ready-mix concrete |
448,359 | 369,399 | 78,960 | 21 | % | |||||||||||
| Concrete block |
140,128 | 116,929 | 23,199 | 20 | % | |||||||||||
| Fly ash |
16,349 | 13,054 | 3,295 | 25 | % | |||||||||||
| Other goods and services |
20,126 | 18,363 | 1,763 | 10 | % | |||||||||||
|
|
|
|
|
|
|
|
|
|||||||||
| Revenue (including internal trading) |
1,186,085 | 1,000,885 | 185,200 | 19 | % | |||||||||||
| Less: Internal trading activity(2) |
(216,153 | ) | (192,327 | ) | (23,826 | ) | 12 | % | ||||||||
|
|
|
|
|
|
|
|
|
|||||||||
| Segment External Revenue |
$ | 969,932 | $ | 808,558 | $ | 161,374 | 20 | % | ||||||||
|
|
|
|
|
|
|
|
|
|||||||||
| (1) | Revenues by product type consist of sales to third parties and internal trading activity at a transfer price approximating market price. |
| (2) | Internal trading activity represents the consumption of internally sourced materials at a transfer price approximating market price. These amounts are eliminated at the operating segment level or in consolidation, as appropriate. |
Our Florida reportable segments percent changes in sales volumes (including internal trading activity) and average sales prices for the fiscal year ended December 31, 2023, as compared to the fiscal year ended December 31, 2022, were as follows:
| % Change in Volumes |
% Change in Average Price |
|||||||
| Cement |
6 | % | 14 | % | ||||
| Aggregates |
(14 | %) | 22 | % | ||||
| Ready-mix concrete |
(1 | %) | 22 | % | ||||
| Concrete block |
(3 | %) | 24 | % | ||||
| Fly ash |
9 | % | 15 | % | ||||
Segment external revenue in our Florida reportable segment increased $161.4 million, or 20%, to $969.9 million for the fiscal year ended December 31, 2023 compared to $808.6 million for the fiscal year ended December 31, 2022, where revenue increased across all product lines. Revenue from cement increased $71.3 million resulting from a 6% increase in cement volumes and a 14% increase in average price for the fiscal year ended December 31, 2023 compared to the fiscal year ended December 31, 2022. Revenue from aggregates increased $6.7 million for the fiscal year ended December 31, 2023 as compared to the fiscal year ended December 31, 2022 benefiting from a 22% increase in average price on 14% lower volumes sold. The lower aggregate volumes were attributed to increased aggregate consumption in cement manufacturing and quarry development activities that limited the amount of material available for sale in the fiscal year ended December 31, 2023. Ready-mix concrete revenues grew by $79.0 million for the fiscal year ended December 31, 2023 compared to the fiscal year ended December 31. 2022 as a 1% decline in volumes was more than offset by a 22% increase in average prices where pricing and profitability improvements were prioritized over volume growth. Likewise, when compared to
98
Table of Contents
the fiscal year ended December 31, 2022, concrete block revenue increase by $23.2 million for the fiscal year ended December 31, 2023 compared to the fiscal year ended December 31, 2022 as a 3% decrease in volumes was more than offset by a 24% increase in average price.
Segment adjusted EBITDA for the Florida reportable segment increased $90.7 million, or 69%, to $221.2 million for the fiscal year ended December 31, 2023 compared to $130.5 million for the fiscal year ended December 31, 2022. The increase in segment adjusted EBITDA for the fiscal year ended December 31, 2023 occurred primarily due to increases in average prices for all product lines which outpaced the cost of materials and other input costs including higher selling, general and administrative expenses.
Comparison of the fiscal year ended December 31, 2022 to the fiscal year ended December 31, 2021
The following table presents segment external revenue and segment adjusted EBITDA for our Florida reportable segment for the periods indicated:
| Years Ended December 31, | ||||||||||||||||
| ($ in thousands) | 2022 | 2021 | $ Change | % Change | ||||||||||||
| Segment external revenue |
$ | 808,558 | $ | 667,689 | $ | 140,869 | 21 | % | ||||||||
| Segment adjusted EBITDA |
$ | 130,520 | $ | 105,530 | $ | 24,990 | 24 | % | ||||||||
The following table presents revenue by product type for our Florida reportable segment for the periods indicated:
| Years Ended December 31, | ||||||||||||||||
| ($ in thousands) | 2022 | 2021 | $ Change | % Change | ||||||||||||
| Revenue by product type(1) |
||||||||||||||||
| Cement |
$ | 351,819 | $ | 277,206 | $ | 74,613 | 27 | % | ||||||||
| Aggregates |
131,321 | 120,699 | 10,622 | 9 | % | |||||||||||
| Ready-mix concrete |
369,399 | 314,427 | 54,972 | 17 | % | |||||||||||
| Concrete block |
116,929 | 96,554 | 20,375 | 21 | % | |||||||||||
| Fly ash |
13,054 | 14,079 | (1,025 | ) | (7 | %) | ||||||||||
| Other goods and services |
18,363 | 15,705 | 2,658 | 17 | % | |||||||||||
|
|
|
|
|
|
|
|
|
|||||||||
| Revenue (including internal trading) |
1,000,885 | 838,670 | 162,215 | 19 | % | |||||||||||
| Less: Internal trading activity(2) |
(192,327 | ) | (170,981 | ) | (21,346 | ) | 12 | % | ||||||||
|
|
|
|
|
|
|
|
|
|||||||||
| Segment External Revenue |
$ | 808,558 | $ | 667,689 | $ | 140,869 | 21 | % | ||||||||
|
|
|
|
|
|
|
|
|
|||||||||
| (1) | Revenue by product type consists of sales to third parties and internal trading activity. |
| (2) | Internal trading activity represents the consumption of internally sourced materials at a transfer price approximating market price. These amounts are eliminated at the operating segment level or in consolidation, as appropriate. |
Our Florida reportable segments percent changes in sales volumes (including internal trading activity) and average sales prices for the fiscal year ended December 31, 2022, as compared to the fiscal year ended December 31, 2021, were as follows:
| % Change in Volumes |
% Change in Average Price |
|||||||
| Cement |
12 | % | 14 | % | ||||
| Aggregates |
(5 | %) | 14 | % | ||||
| Ready-mix concrete |
(3 | %) | 21 | % | ||||
| Concrete block |
(9 | %) | 32 | % | ||||
| Fly ash |
(21 | %) | 18 | % | ||||
Segment external revenue increased $140.9 million, or 21%, to $808.6 million for the fiscal year ended December 31, 2022 compared to $667.7 million for the fiscal year ended December 31, 2021, driven by substantial revenue increases
99
Table of Contents
in the cement, ready-mix concrete and concrete block product lines. Revenue from cement increased $74.6 million resulting from a 12% increase in volumes and a 14% increase in average price. Ready-mix concrete revenues grew by $55.0 million resulting from a 3% decrease in volumes and a 21% increase in average price for the fiscal year ended December 31, 2022 compared to the fiscal year ended December 31, 2021. When compared to the fiscal year ended December 31, 2021, concrete block volumes decreased 9% while average prices increased by 32% leading to a year-over-year improvement of $20.4 million in concrete block revenue. Revenue from aggregates increased $10.6 million for the fiscal year ended December 31, 2022 as compared to the fiscal year ended December 31, 2021 driven by 14% higher average prices which were partially offset by 5% lower volumes.
Segment adjusted EBITDA for the Florida reportable segment increased $25.0 million, or 24%, to $130.5 million for the fiscal year ended December 31, 2022 compared to $105.5 million in 2021. The increase in segment adjusted EBITDA for the fiscal year ended December 31, 2022 was supported by price increases realized throughout the year reflecting a concerted effort to improve segment margins following a deterioration in profitability for the fiscal year ended December 31, 2021.
Mid-Atlantic Reportable Segment
Comparison of the nine months ended September 30, 2024 to the nine months ended September 30, 2023
The following table presents revenue and segment adjusted EBITDA of our Mid-Atlantic reportable segment for the periods indicated:
| Nine Months Ended September 30, |
||||||||||||||||
| ($ in thousands) | 2024 | 2023 | $ Change | % Change | ||||||||||||
| Segment external revenue |
$ | 481,041 | $ | 461,628 | $ | 19,413 | 4 | % | ||||||||
| Segment adjusted EBITDA |
$ | 100,537 | $ | 89,033 | $ | 11,504 | 13 | % | ||||||||
The following table presents revenue by product type of our Mid-Atlantic reportable segment for the periods indicated:
| Nine Months Ended September 30, |
||||||||||||||||
| ($ in thousands) | 2024 | 2023 | $ Change | % Change | ||||||||||||
| Revenue by product type(1) |
||||||||||||||||
| Cement |
$ | 308,254 | $ | 305,797 | $ | 2,457 | 1 | % | ||||||||
| Aggregates |
10,429 | 10,735 | (306 | ) | (3 | %) | ||||||||||
| Ready-mix concrete |
203,664 | 183,575 | 20,089 | 11 | % | |||||||||||
| Fly ash |
12,302 | 10,039 | 2,263 | 23 | % | |||||||||||
|
|
|
|
|
|
|
|
|
|||||||||
| Revenue (including internal trading) |
$ | 534,649 | $ | 510,146 | $ | 24,503 | 5 | % | ||||||||
|
|
|
|
|
|
|
|
|
|||||||||
| Less: Internal trading activity(2) |
(53,608 | ) | (48,518 | ) | ||||||||||||
|
|
|
|
|
|
|
|
|
|||||||||
| Segment External Revenue |
$ | 481,041 | $ | 461,628 | $ | 19,413 | 4 | % | ||||||||
|
|
|
|
|
|
|
|
|
|||||||||
| (1) | Revenue by product type consists of sales to third parties and internal trading activity at a transfer price approximating market price. |
| (2) | Internal trading activity represents the consumption of internally sourced materials at a transfer price approximating market price. These amounts are eliminated at the operating segment level or in consolidation, as appropriate. |
100
Table of Contents
Our Mid-Atlantic reportable segments percent changes in sales volume (including internal trading activity) and average sales prices for the nine months ended September 30, 2024, as compared to the nine months ended September 30, 2023 were as follows:
| % Change in Volumes |
% Change in Average Price |
|||||||
| Cement |
(1 | %) | 2 | % | ||||
| Aggregates |
(2 | %) | (1 | %) | ||||
| Ready-mix concrete |
7 | % | 4 | % | ||||
| Fly ash |
6 | % | 16 | % | ||||
Segment external revenue in our Mid-Atlantic reportable segment increased $19.4 million, or 4%, to $481.0 million for the nine months ended September 30, 2024 compared to $461.6 million for the nine months ended September 30, 2023, driven by revenue increases in the cement, ready-mix concrete and fly ash product lines. Although cement volumes declined 1% for the nine months ended September 30, 2024 compared to the nine months ended September 30, 2023, average price increased 2%. Ready-mix concrete revenues increased $20.1 million resulting from a 7% increase in volumes and 4% increase in average price. Contributions from aggregates and fly ash which, combined, represent less than 4% of our Mid-Atlantic reportable segments revenues saw a mixed performance.
Segment adjusted EBITDA in our Mid-Atlantic reportable segment increased $11.5 million, or 13%, to $100.5 million for the nine months ended September 30, 2024 compared to $89.0 million for the nine months ended September 30, 2023. The increase in segment adjusted EBITDA for the nine months ended September 30, 2024 was attributable to increases in average sales prices across the cement, ready-mix and fly ash product lines and the benefit of lower fuel and energy costs compared to the nine months ended September 30, 2023.
Comparison of the fiscal year ended December 31, 2023 to the fiscal year ended December 31, 2022
The following table presents revenue and Segment adjusted EBITDA of our Mid-Atlantic reportable segment for the periods indicated:
| Years Ended December 31, | ||||||||||||||||
| ($ in thousands) | 2023 | 2022 | $ Change | % Change | ||||||||||||
| Segment external revenue |
$ | 619,683 | $ | 553,335 | $ | 66,348 | 12 | % | ||||||||
| Segment adjusted EBITDA |
$ | 118,260 | $ | 72,753 | $ | 45,507 | 63 | % | ||||||||
The following table presents revenue by product type of our Mid-Atlantic reportable segment for the periods indicated:
| Years Ended December 31, | ||||||||||||||||
| ($ in thousands) | 2023 | 2022 | $ Change | % Change | ||||||||||||
| Revenues by product type(1) |
||||||||||||||||
| Cement |
$ | 411,558 | $ | 373,763 | $ | 37,795 | 10 | % | ||||||||
| Aggregates |
15,053 | 7,998 | 7,055 | 88 | % | |||||||||||
| Ready-mix concrete |
245,931 | 225,023 | 20,908 | 9 | % | |||||||||||
| Fly ash |
13,945 | 10,944 | 3,001 | 27 | % | |||||||||||
|
|
|
|
|
|
|
|
|
|||||||||
| Revenue (including internal trading) |
686,487 | 617,728 | 68,759 | 11 | % | |||||||||||
| Less: Internal trading activity(2) |
(66,804 | ) | (64,393 | ) | (2,411 | ) | 4 | % | ||||||||
|
|
|
|
|
|
|
|
|
|||||||||
| Segment External Revenue |
$ | 619,683 | $ | 553,335 | $ | 66,348 | 12 | % | ||||||||
|
|
|
|
|
|
|
|
|
|||||||||
| (1) | Revenue by product type consists of sales to third parties and internal trading activity at a transfer price approximating market price. |
| (2) | Internal trading activity represents the consumption of internally sourced materials at a transfer price approximating market price. These amounts are eliminated at the operating segment level or in consolidation, as appropriate. |
101
Table of Contents
Our Mid-Atlantic reportable segments percent changes in sales volume (including internal trading activity) and average sales prices for the fiscal year ended December 31, 2023, as compared to the fiscal year ended December 31, 2022, were as follows:
| % Change in Volumes |
% Change in Average Price |
|||||||
| Cement |
(1 | %) | 12 | % | ||||
| Aggregates |
61 | % | 17 | % | ||||
| Ready-mix concrete |
(2 | %) | 11 | % | ||||
| Fly ash |
14 | % | 12 | % | ||||
Segment external revenue in our Mid-Atlantic reportable segment increased $66.4 million, or 12%, to $619.7 million for the fiscal year ended December 31, 2023 compared to $553.3 million for the fiscal year ended December 31, 2022, driven by revenue increases across all product lines. Although cement volumes declined 1% for the fiscal year ended December 31, 2023 compared to the fiscal year ended December 31, 2022, average price increased 12%. Compared to for the fiscal year ended December 31, 2022, aggregates volumes increased 61% (from a low base) for the fiscal year ended December 31, 2023 with a 17% improvement in average price. Ready-mix concrete volumes declined 2% but benefited from an 11% increase in average price where the higher costs associated with raw material inputs were successfully passed through to ready-mix concrete customers, for the fiscal year ended December 31, 2023 compared to the fiscal year ended December 31, 2022. Fly ash volumes increased 14%, while average price increased 12% benefiting from improved availability and strong customer demand for supplementary cementitious materials, for the fiscal year ended December 31, 2023 compared to the fiscal year ended December 31, 2022.
Segment adjusted EBITDA in our Mid-Atlantic reportable segment increased $45.5 million, or 63%, to $118.3 million for the fiscal year ended December 31, 2023 compared to $72.8 million for the fiscal year ended December 31, 2022. The increase in segment adjusted EBITDA for the fiscal year ended December 31, 2023 was attributed to increases in average sales prices across all product lines and the benefit of lower fuel and energy costs compared to the fiscal year ended December 31, 2022.
Comparison of the fiscal year ended December 31, 2022 to the fiscal year ended December 31, 2021
The following table presents segment external revenue and segment adjusted EBITDA of our Mid-Atlantic reportable segment for the periods indicated:
| Years Ended December 31, | ||||||||||||||||
| ($ in thousands) | 2022 | 2021 | $ Change | % Change | ||||||||||||
| Segment external revenue |
$ | 553,335 | $ | 481,908 | $ | 71,427 | 15 | % | ||||||||
| Segment adjusted EBITDA |
$ | 72,753 | $ | 77,098 | $ | (4,345 | ) | (6 | %) | |||||||
The following table presents revenue by product type of our Mid-Atlantic reportable segment for the periods indicated:
| Years Ended December 31, | ||||||||||||||||
| ($ in thousands) | 2022 | 2021 | $ Change | % Change | ||||||||||||
| Revenues by product type(1) |
||||||||||||||||
| Cement |
$ | 373,763 | $ | 301,633 | $ | 72,130 | 24 | % | ||||||||
| Aggregates |
7,998 | 12,059 | (4,061 | ) | (34 | %) | ||||||||||
| Ready-mix concrete |
225,023 | 216,489 | 8,534 | 4 | % | |||||||||||
| Fly ash |
10,944 | 9,363 | 1,581 | 17 | % | |||||||||||
|
|
|
|
|
|
|
|
|
|||||||||
| Revenue (including internal trading) |
617,728 | 539,544 | 78,184 | 14 | % | |||||||||||
| Less: Internal trading activity(2) |
(64,393 | ) | (57,636 | ) | (6,757 | ) | 12 | % | ||||||||
|
|
|
|
|
|
|
|
|
|||||||||
| Segment External Revenue |
$ | 553,335 | $ | 481,908 | $ | 71,427 | 15 | % | ||||||||
|
|
|
|
|
|
|
|
|
|||||||||
| (1) | Revenue by product type consists of sales to third parties and internal trading activity at a transfer price approximating market price. |
| (2) | Internal trading activity represents the consumption of internally sourced materials at a transfer price approximating market price. These amounts are eliminated at the operating segment level or in consolidation, as appropriate. |
102
Table of Contents
Our Mid-Atlantic reportable segments percent changes in sales volumes (including internal trading activity) and average sales prices for the fiscal year ended December 31, 2022, as compared to the fiscal year ended December 31, 2021, were as follows:
| % Change in Volumes |
% Change in Average Price |
|||||||
| Cement |
6 | % | 17 | % | ||||
| Aggregates |
(33 | %) | (0 | %) | ||||
| Ready-mix concrete |
(6 | %) | 11 | % | ||||
| Fly ash |
24 | % | (5 | %) | ||||
Segment external revenue in our Mid-Atlantic reportable segment increased $71.4 million, or 15%, to $553.3 million for the fiscal year ended December 31, 2022 compared to $481.9 million for the fiscal year ended December 31, 2021, primarily driven by higher cement volumes and average prices which rose by 6% and 17% as compared to the fiscal year ended December 31, 2022. Revenue from ready-mix sales grew by 4% benefitting from an 11% year-over-year improvement in average prices for the fiscal year ended December 31, 2022 compared to the fiscal year ended December 31, 2021 which more than offset the impact of a 6% decrease in volume. Contributions from aggregates and fly ash which, combined, represent less than 5% of our Mid-Atlantic reportable segments revenues saw a mixed performance.
Segment adjusted EBITDA in our Mid-Atlantic reportable segment decreased $4.3 million, or 6%, to $72.8 million for the fiscal year ended December 31, 2022 compared to $77.1 million for the fiscal year ended December 31, 2021. The decrease in segment adjusted EBITDA for the fiscal year ended December 31, 2022 occurred primarily due to higher cement import costs, higher sea-freight rates and higher fuel and energy costs which negatively affected the segments cement manufacturing and ready-mix concrete delivery costs.
Liquidity and Capital Resources
We measure liquidity in terms of our ability to fund the cash requirements of our business operations, including working capital needs, capital expenditures, contractual obligations, debt service and other commitments with cash flows from operations and other sources of funding. Our principal sources of liquidity to date have included cash on hand, cash from operating activities, amounts available under revolving credit facilities with banks, amounts available under our revolving credit facility with TGF, a wholly-owned subsidiary of TCI and term loans from TGF.
We believe that our cash and cash equivalents, committed and uncommitted credit facilities, and net cash provided by operating activities will be sufficient to meet our liquidity requirements for at least the 12 months following the issuance date of this registration statement. Our future capital requirements will depend on several factors, including, the potential impact of future disruptions on the economy and on our operations, as well as any other economic impacts related to changing fiscal policy or economic conditions. We may also be negatively impacted in the future if TGF no longer provides debt financing to us or TCI no longer guarantees our third-party revolving credit facilities. Additionally, we are exposed to credit markets through the interest cost related to its borrowings, which may also affect our capital needs and financial strategy. We could be required, or could elect, to seek additional funding, private or public equity offerings, debt financing, bank loans, strategic partnerships or other financing options; however, additional funds may not be available on terms acceptable to us, if at all.
All U.S. dollar equivalents in this section are calculated at the exchange rate prevailing on the date to which the corresponding foreign currency amount refers.
Cash and cash equivalents
As of September 30, 2024 and December 31, 2023, we had $12.1 million and $22.0 million in cash and cash equivalents, respectively. Our cash and cash equivalents consist of cash on hand, demand deposits held by banks and other short-term highly liquid investments with original maturities of three months or less. Such amounts are
103
Table of Contents
held for the purpose of meeting short-term cash requirements, rather than for investment or other purposes, and are readily convertible to a known amount of cash.
Revolving credit facilities with banks
We have a committed borrowing facility with Wells Fargo Bank, National Association totaling $45 million of which $15 million is also available for the issuance of letters of credit. As of September 30, 2024, we had $8 million in letters of credit outstanding under this facility and no outstanding borrowings, leaving $37 million of available capacity. As of December 31, 2023, we had $5 million in letters of credit outstanding and no outstanding borrowings, leaving $40 million of available capacity. The facility is annually renewed, and the current maturity date is March 15, 2025. This facility allows for daily drawdowns and repayments at a borrowing rate based on the Secured Overnight Financing Rate (SOFR) and is guaranteed by TCI. In connection with this borrowing facility, we have agreed to financial covenants related to EBITDA (as defined in the agreement), tangible net worth (as defined in the agreement) and maintenance of a committed line of credit with a maturity date extending beyond the expiration date of this facility. The agreement also contains customary non-financial covenants, including restrictions on incurring certain liens on or disposing of certain existing assets without notification to the lender. As of September 30, 2024, we were in compliance with all the covenants associated with the facility.
In addition to the committed credit facility described above, we have an uncommitted borrowing facility with HSBC Bank USA, National Association totaling $40 million of which the full amount is also available for the issuance of letters of credit. As of September 30, 2024, we had $5 million in letters of credit outstanding under this facility and no outstanding borrowings, leaving $35 million of available capacity. As of December 31, 2023, we had $7 million in letters of credit outstanding under this facility and no outstanding borrowings, leaving $33 million of available capacity. The facility is annually renewed, and the current maturity date is December 20, 2024. This facility allows for term borrowings based on SOFR and is guaranteed by TCI. In connection with this borrowing facility, we have agreed to customary non-financial covenants, including restrictions on incurring certain liens on or disposing of certain existing assets without notification to the lender. As of September 30, 2024, we were in compliance with all the covenants associated with the facility.
We have an additional uncommitted credit facility with Citibank, N.A. totaling $60 million, none of which is available for the issuance of letters of credit. As of September 30, 2024 and December 31, 2023, no borrowings were outstanding under this facility and the full $60 million capacity remained available for borrowing. The facility is annually renewed, and the current maturity date is April 29, 2025. This facility allows for term borrowings based on SOFR and is guaranteed by TCI. In connection with this borrowing facility, we have agreed to certain customary covenants, including restrictions on disposing of certain existing assets without notification to the lender. As of September 30, 2024, we were in compliance with the covenants associated with this facility.
Revolving credit facility with related party
At September 30, 2024, we had a committed 130 million (or $145.5 million U.S. Dollar equivalent) borrowing facility with TGF, a related party (the TGF Borrowing Facility). We had $24.1 million (21.5 million) in outstanding borrowings with available capacity of $121.5 million (108.5 million) at September 30, 2024. At December 31, 2023, the size of the TGF Borrowing Facility was 100 million (or $110.5 million U.S. Dollar equivalent). We had $40.3 million (36.5 million) in outstanding borrowings with available capacity of $70.2 million (63.5 million) at December 31, 2023. This facility was amended on July 31, 2024 to increase the total available credit facility from 100 million (or $110.5 million U.S. Dollar equivalent) to 130 million (or $145.5 million U.S. Dollar equivalent). This multicurrency revolving credit facility bears interest at variable rates, permits drawdowns and repayments, and has a maturity date of January 30, 2026. There are no financial covenants associated with this facility.
104
Table of Contents
Intragroup Cash Management Agreement
On February 1, 2024, we entered into a cash management agreement with TGF. The agreement is effective until either party provides written notice of termination. Pursuant to this agreement, our two existing HSBC UK bank accounts, one denominated in U.S. dollars and one denominated in Euros, are funded when there are negative daily balances. Fundings are subject to maximum borrowing limits of $15 million and 15 million, respectively. Conversely, when there are cash balances in either account, these funds are swept as a deposit into the TGF concentration account. There are no deposit limits.
With respect to borrowings made under the cash management agreement, we bear a daily interest charge based on the benchmark rates of the European Central Bank (ECB) Main Refinancing Rate (for Euro borrowings) and the U.S. Federal Reserve Federal Funds Target Rate (for U.S. dollar borrowings), plus an applicable margin.
With respect to deposits made under the cash management agreement, we receive a daily interest credit based on the benchmark interest rates of the ECB Deposit Facility Rate (for Euro deposits) and the U.S. Federal Reserve Federal Funds Target Rate (for U.S. dollar deposits), minus an applicable margin.
Company funds on deposit with TGF under the cash management agreement are due upon demand from us. Amounts borrowed from TGF under the cash management agreement may be repaid (in whole or in any part) at our discretion. Following written notice of termination, outstanding borrowings from TGF under the cash management agreement are due upon demand from TGF.
Term loans with related party
In December 2017, we entered into a 150 million term loan with TGF maturing on November 15, 2024. In April 2022, we repaid 30 million of this loan. As of September 30, 2024 and December 31, 2023, 120 million remained outstanding bearing interest at 3.05%. There are no financial covenants associated with this loan. As described below, on November 15, 2024, the Company settled this loan.
In March 2018, we entered into a 75.0 million term loan with TGF maturing on November 15, 2024. On April 29, 2024, we amended this note to: (i) increase the principal amount to 100 million bearing an interest rate of 4.80% and (ii) extend its maturity to June 11, 2029. There are no financial covenants associated with this loan.
In June 2021, we entered into the following term loans with TGF:
| | a 32.8 million loan bearing interest at 3.35% and maturing on July 7, 2027, and |
| | a 45 million loan with TGF maturing on November 14, 2024. On April 29, 2024, the loan was amended to: (i) increase the principal to 50 million bearing an interest rate of 4.80% and (ii) extend its maturity to June 11, 2029. |
There are no financial covenants associated with these loans.
On November 15, 2024, we entered into a 150.0 million note payable with TGF, bearing interest at 3.20% and maturing on July 7, 2027. The proceeds of this note were used to settle 30.0 million on the multicurrency revolving credit facility with TGF and the 120.0 million note with TGF maturing on November 15, 2024 as described above. The principal balance of total borrowings outstanding and cash on hand remained the same after the execution of this loan. There are no financial covenants associated with this loan.
For the above Euro denominated loans, we have entered into derivative transactions with reputable financial institutions to hedge the foreign currency risk and, in essence, convert the Euro denominated debt to U.S. Dollar debt.
105
Table of Contents
Lease liabilities
As of September 30, 2024, we had lease liabilities totaling $69.5 million, with $30.5 million (44%) of that amount due in more than five years, $27.1 million (39%) due within one to five years, and $11.9 million (17%) due within one year. As of December 31, 2023, we had lease liabilities totaling $65.5 million, with $27.0 million (41%) of that amount due in more than five years, $26.7 million (41%) due within one to five years, and $11.7 million (18%) due within one year. For further information regarding our lease liabilities, please refer to Note 18 to our audited consolidated financial statements included elsewhere in this prospectus.
In 2023, we entered into a long-term lease agreement for office premises located in Deerfield Beach, Florida with an effective date of July 2024. The lease term is for 11 years and 7 months with an initial lease liability recorded at $7.8 million. The lease agreement offers two successive five-year renewal options which, if exercised by us, would be subject to fair market rental value adjustments at the time of each renewal. We have determined that the exercise of these renewal options is not reasonably certain at the inception of the lease; therefore, they have been excluded from the initial measurement of the lease liability.
Derivative financial instruments
We use derivative financial instruments to manage its foreign currency risks and interest rate exposures. As described above, term loans from related parties are Euro denominated while we primarily operate in U.S. Dollars. Cross-currency interest rate swaps and foreign exchange forward contracts are used to fix the U.S. Dollar cash flows (principal and interest) associated with Euro denominated term loans. In addition, foreign exchange forward contracts are used to mitigate the variation of the USD/Euro exchange rate for short-term intervals over the life of short-term Euro denominated obligations and short-term Euro denominated borrowings, including those made under the intercompany revolving credit facility described above.
To manage the foreign currency exchange rate risk associated with its Euro denominated term loans, we have entered into cross-currency interest rate swap agreements with third party financial institutions which fixed the:
| | November 16, 2024 U.S. Dollar to Euro exchange rate at $1.15887 to 1.00 on a notional amount of 150 million. In addition, over the life of the agreements, we will receive Euro denominated fixed rate interest (weighted average 2.60%) on a notional amount of 150 million and pay U.S. Dollar denominated fixed rate interest (weighted average 5.44%) on a notional amount of $173.8 million. |
| | June 11, 2029 U.S. Dollar to Euro exchange rate at $1.07213 to 1.00 on a notional amount of 150 million. In addition, over the life of the agreements, we will receive Euro denominated fixed rate interest (weighted average 4.80%) on a notional amount of 150 million and pay U.S. Dollar denominated fixed rate interest (weighted average 6.83%) on a notional amount of $160.8 million. |
| | July 7, 2027 U.S. Dollar to Euro exchange rate at $1.05383 to 1.00 on a notional amount of 150 million. In addition, over the life of the agreements, we will receive Euro denominated fixed rate interest (weighted average 3.20%) on a notional amount of 150.0 million and pay U.S. Dollar denominated fixed rate interest (weighted average 5.30%) on a notional amount of $158.1 million. |
To manage the foreign currency exchange rate risk associated with short-term Euro denominated obligations, we have entered into short-term foreign exchange forward contracts with third party financial institutions which fixed the U.S. Dollar to Euro exchange rate on a:
| | Notional amount of 14.5 million at $1.10689 to 1.00 with a value date of October 7, 2024. |
| | Notional amount of 27.8 million at $1.08545 to 1.00 with a value date of November 18, 2024. |
| | Notional amount of 8.0 million at $1.10710 to 1.00 with a value date of December 23, 2024. |
| | Notional amount of 27.6 million at $1.05720 to 1.00 with a value date of December 23, 2024. |
| | Notional amount of 35.6 million at $1.04258 to 1.00 with a value date of February 24, 2025. |
| | Notional amount of 10.0 million at $1.12220 to 1.00 with a value date of March 21, 2025. |
106
Table of Contents
Cash Flows
The following table summarizes the net cash provided by and used in operating, investing and financing activities for the periods indicated:
|
Nine Months Ended September 30, |
Years Ended December 31, |
|||||||||||||||||||
| ($ in thousands) | 2024 | 2023 | 2023 | 2022 | 2021 | |||||||||||||||
| Net cash provided by operating activities |
$ | 197,143 | $ | 142,415 | $ | 227,125 | $ | 178,374 | $ | 146,703 | ||||||||||
| Net cash used in investing activities |
(112,121 | ) | (91,125 | ) | (117,653 | ) | (127,301 | ) | (70,298 | ) | ||||||||||
| Net cash used in financing activities |
(97,214 | ) | (74,891 | ) | (117,779 | ) | (21,661 | ) | (197,138 | ) | ||||||||||
Net Cash provided by Operating Activities
During the nine months ended September 30, 2024, the net cash provided by operating activities was $197.1 million primarily as a result of:
| | Income before income taxes of $173.4 million, adjusted to exclude the effect of non-cash expenses, including $69.0 million of depreciation, depletion and amortization and $2.9 million of share-based compensation as well as finance cost of $20.1 million which, when paid, is classified as a cash flow used in financing activities. |
| | Net cash outflows of $24.7 million arising from: (i) increases in operating assets, including higher inventory levels ($18.5 million) primarily associated with higher production volumes, and (ii) reductions in operating liabilities, including lower accounts payable and accrued expenses ($6.3 million) primarily associated with the timing of payments to suppliers. |
| | Income tax payments, net of income tax refunds of $49.1 million. |
During the nine months ended September 30, 2023, the net cash provided by operating activities was $142.4 million primarily as a result of:
| | Income before income taxes of $148.2 million, adjusted to exclude the effect of non-cash expenses, including $63.8 million of depreciation, depletion and amortization and $2.3 million of share-based compensation as well as finance cost of $19.8 million which, when paid, is classified as a cash flow used in financing activities. |
| | Net cash outflows of $64.0 million arising from: (i) increases in operating assets, including higher inventory levels ($5.0 million) primarily associated with higher production volumes, (ii) higher trade receivables ($7.7 million) primarily resulting from higher sales revenue and (iii) reductions in operating liabilities, including lower accounts payable and accrued expenses ($42.6 million) primarily associated with the timing of payments to suppliers. |
| | Income tax payments, net of income tax refunds of $29.3 million. |
During the fiscal year ended December 31, 2023, the net cash provided by operating activities was $227.1 million primarily as a result of:
| | Income before income taxes of $202.4 million, adjusted to exclude the effect of non-cash expenses, including $91.1 million of depreciation, depletion and amortization and $3.1 million of share-based compensation as well as finance cost of $23.2 million which, when paid, is classified as a cash flow used in financing activities. |
| | Net cash outflows of $42.3 million arising from: (i) increases in operating assets, including higher inventory levels ($9.2 million) primarily associated with spare parts held in advance of 2024 maintenance campaigns, and (ii) reductions in operating liabilities, including lower accounts payable and accrued expenses ($33.9 million) primarily associated with the timing of payments to suppliers. |
| | Income tax payments, net of income tax refunds of $53.1 million. |
107
Table of Contents
During the fiscal year ended December 31, 2022, the net cash provided by operating activities was $178.4 million primarily as a result of:
| | Income before income taxes of $79.7 million, adjusted to exclude the effect of non-cash expenses, including $87.7 million of depreciation, depletion and amortization and $2.1 million of share-based compensation as well as finance cost of $19.5 million which, when paid, is classified as a cash flow used in financing activities. |
| | Net cash outflows of $5.6 million arising from: (i) increases in operating assets, including higher inventory levels ($40.6 million) primarily associated with increased quantities of finished goods and raw materials required to support market demand as well as increased unit costs resulting from higher manufacturing and purchased material costs, and (ii) increases in operating liabilities, including higher accounts payable and accrued expenses ($50.6 million) primarily associated with the timing of payments to suppliers. |
| | Income tax payments, net of income tax refunds of $5.3 million. |
During the fiscal year ended December 31, 2021, the net cash provided by operating activities was $146.7 million primarily as a result of:
| | Income before income taxes of $74.6 million, adjusted to exclude the effect of non-cash expenses, including $81.7 million of depreciation, depletion and amortization and $2.0 million of share-based compensation as well as finance cost of $22.3 million which, when paid, is classified as a cash flow used in financing activities. |
| | Net cash outflows of $33.0 million arising from: (i) increases in operating assets, including higher inventory levels ($17.8 million) primarily associated with higher investments in finished goods, work in process and spare parts required to support an expected growth in market demand, higher trade accounts receivable ($13.9 million) and higher other receivables ($20.2 million) primarily resulting from higher sales revenue and (ii) reductions in operating liabilities, including lower accounts payable and accrued expenses ($18.3 million) primarily associated with the timing of payments to suppliers. |
| | Income tax refunds, net of income tax payments, of $2.0 million. |
Net Cash used in Investing Activities
During the nine months ended September 30, 2024, net cash used for investing activities was $112.1 million, of which $113.2 million was invested in property, plant and equipment.
During the nine months ended September 30, 2023, net cash used for investing activities was $91.1 million, of which $92.0 million was invested in property, plant and equipment.
During the fiscal year ended December 31, 2023, net cash used for investing activities was $117.7 million, of which $117.1 million and $1.6 million was invested in property, plant and equipment and identifiable intangible assets, respectively.
During the fiscal year ended December 31, 2022, net cash used for investing activities was $127.3 million, of which $125.4 million and $2.9 million was invested in property, plant and equipment and identifiable intangible assets, respectively.
During the fiscal year ended December 31, 2021, net cash used for investing activities was $70.3 million, of which $62.3 million and $9.2 million was invested in property, plant and equipment and identifiable intangible assets, respectively.
As compared to the fiscal year ended December 31, 2021, investments in property, plant and equipment increased for the fiscal year ended December 31, 2023 and for the fiscal year ended December 31, 2022 compared to the fiscal year ended
108
Table of Contents
December 31, 2021s level where investment programs were suspended or delayed during the period most affected by the COVID-19 pandemic. Included in these investments were the construction of two cement storage domes at our Norfolk, Virginia and Tampa, Florida marine import terminals, a new raw material storage facility at our cement plant in Florida, additional dragline capacity to support the efficient recovery of aggregate reserves and investments in mobile and other equipment required to support our ready-mix concrete and concrete block market positions.
Net Cash used in Financing Activities
During the nine months ended September 30, 2024, net cash used in financing activities was $97.2 million, primarily due to:
| | Interest paid of $13.1 million. |
| | Dividends paid to shareholders of $85.1 million. |
| | Payments under lease liabilities of $7.3 million. |
| | Net settlements and collateral payments of $4.3 million received from financial institutions arising from derivative financial instruments. |
| | Borrowings in excess of repayments from a related party (TGF) totaling $16.4 million. |
On October 25, 2024, Titan Atlantic declared and paid a return of capital of $51.6 million to Titan Cement International. The return of capital was funded through a combination of drawdowns on short-term third party and short-term and long-term related party credit facilities.
During the nine months ended September 30, 2023, net cash used in financing activities was $74.9 million, primarily due to:
| | Interest paid of $15.1 million. |
| | Payments under lease liabilities of $9.4 million. |
| | Repayments under third party lines of credit totaling $18.8 million. |
| | Repayments from a related party (TGF) borrowings totaling $31.1 million. |
During the fiscal year ended December 31, 2023, net cash used in financing activities was $117.8 million, primarily due to:
| | Interest paid of $23.8 million. |
| | Dividends paid to shareholders of $33.8 million. |
| | Payments under lease liabilities of $12.2 million. |
| | Net settlements and collateral payments of $14.7 million received from financial institutions arising from derivative financial instruments. |
| | Repayments in excess of borrowings under third party lines of credit totaling $70.0 million. |
| | Borrowings in excess of repayments from a related party (TGF) totaling $7.7 million. |
During the fiscal year ended December 31, 2022, net cash used in financing activities was $21.7 million, primarily due to:
| | Interest paid of $20.9 million. |
| | Payments under lease liabilities of $11.4 million. |
| | Net settlements and collateral payments of $19.3 million made to financial institutions arising from derivative financial instruments. |
109
Table of Contents
| | Borrowings in excess of repayments under third party lines of credit totaling $32.2 million. |
During the fiscal year ended December 31, 2021, net cash used in financing activities was $197.1 million, primarily due to:
| | Interest paid of $20.9 million. |
| | Capital returned to shareholders of $82.4 million. |
| | Payments under lease liabilities of $14.5 million. |
| | Net settlements and collateral payments of $23.5 million made to financial institutions arising from derivative financial instruments. |
| | Borrowings in excess of repayments under third party lines of credit totaling $37.8 million. |
| | Repayments in excess of borrowings from a related party (TGF) totaling $91.9 million. |
Critical Accounting Policies and Estimates
Our annual consolidated and our interim condensed consolidated financial statements have been prepared in accordance with International Financial Reporting Standards, as issued by the International Accounting Standards Board. Preparation of our consolidated financial statements requires our management to make judgments, estimates and assumptions that impact the reported amount of net sales and expenses, assets and liabilities and the disclosure of contingent assets and liabilities. We consider an accounting judgment, estimate or assumption to be critical when the estimate or assumption is complex in nature or requires a high degree of judgment and the use of different judgments, estimates and assumptions could have a material impact on our consolidated financial statements. Management periodically reviews our estimates and adjusts these estimates when facts and circumstances dictate. To the extent there are differences between the estimates and actual results, our financial condition or results of operations may be materially affected.
An accounting policy is considered to be critical if it requires an accounting estimate to be made based on assumptions about matters that are highly uncertain at the time the estimate is made, and if different estimates that reasonably could have been used, or changes in the accounting estimates that are reasonably likely to occur periodically, could materially impact our consolidated financial statements. We believe that our critical accounting policies reflect the more significant estimates and assumptions used in the preparation of our consolidated financial statements. The critical accounting policies, judgments and estimates should be read in conjunction with our consolidated financial statements and the notes thereto and other disclosures included elsewhere in this prospectus.
Our significant accounting policies are described in Note 1 to our unaudited interim condensed consolidated financial statements and Note 1 to our audited consolidated financial statements included elsewhere in this prospectus. Our critical accounting policies are described below.
Property, plant and equipment
Our property, plant and equipment represent significant assets on the balance sheet and are critical to our ability to generate future economic benefits. These assets are stated at historical cost less accumulated depreciation and impairment losses. Land, with the exception of quarries, is carried at cost less any impairment losses.
The cost of property, plant and equipment includes expenditures directly attributable to the acquisition of the assets, as well as any environmental rehabilitation costs that have been recognized as a provision. We capitalize subsequent costs related to these assets when it is probable that they will provide future economic benefits and can be measured reliably. The carrying amount of any replaced parts is derecognized, while all other repairs and maintenance costs are expensed as incurred.
110
Table of Contents
Depreciation is a significant estimate in the valuation of property, plant and equipment, and except for quarries and refurbishments, it is calculated on a straight-line basis over the estimated useful lives of the assets. The estimated useful lives are as follows:
| Cement | Aggregates | Other | ||||||||||
| Land improvements |
15-30 | 15 | 15 | |||||||||
| Building and improvements |
25 | 25 | 25 | |||||||||
| Machinery and equipment |
15-30 | 10-15 | 5-15 | |||||||||
| Mobile equipment |
7-25 | 7-15 | 7 | |||||||||
| Marine equipment |
20 | 20 | n/a | |||||||||
| Auto and truck |
8 | 8 | 8 | |||||||||
| Furniture and fixtures |
3-5 | 3-5 | 3-5 | |||||||||
For quarries, depreciation is based on a depletion basis using the unit-of-production method, which is applied as the material extraction process advances. This method is based on secured reserves, ensuring that the depreciation expense matches the rate at which the economic benefits of the quarries are consumed.
The assets residual values, useful lives, and methods of depreciation are reviewed at each reporting date and adjusted if appropriate. If the carrying amount of an asset exceeds its estimated recoverable amount, an impairment loss is recognized immediately.
A one-year increase in the assumed asset lives would increase income before income taxes by $4.4 million for the nine months ended September 30, 2024. A one-year decrease in the assumed asset lives would decrease income before income taxes by $6.5 million for the nine months ended September 30, 2024.
Impairment tests of property, plant and equipment
Property, plant and equipment are tested for impairment upon the occurrence of factors such as the occurrence of internal or external indicators of impairment, such as changes in our operating business model or in technology that affects the asset, as well as expectations of lower operating results for each cash generating unit, in order to determine whether their carrying amounts may not be recovered. In such cases, an impairment loss is recorded in the statements of income for the period when such determination is made. The impairment loss of an asset results from the excess of the assets carrying amount over its recoverable amount, corresponding to the higher of the fair value of the asset, less costs to sell such asset, and the assets value in use, the latter represented by the net present value of estimated cash flows related to the use and eventual disposal of the asset. Impairment losses recognized are reviewed for possible reversal of the impairment at each reporting date.
Significant judgment by management is required to appropriately assess the fair values and values in use of these assets. Impairment tests are significantly sensitive to, among other factors, the estimation of future prices of our products, the development of operating expenses, local and national economic trends in the construction industry, the long-term growth expectations in the different markets as well as the discount rates and the growth rates in perpetuity applied. For purposes of estimating future prices, we use, to the extent available, historical data plus the expected increase or decrease according to information issued by what we consider to be trusted external sources, such as national construction or cement producer chambers and/or in governmental economic expectations.
Impairment of goodwill
We conduct impairment tests of goodwill using the recoverable amounts of cash-generating units (CGUs), which are determined based on value-in-use calculations.
As of December 31, 2023, we have not recorded any impairment of goodwill or indefinite-lived intangible assets, as the recoverable amounts of our CGUs are estimated to exceed their respective carrying amounts. Goodwill and
111
Table of Contents
indefinite-lived intangible assets have been allocated to various CGUs, including the Mid-Atlantic and Florida business units, with total goodwill and indefinite-lived intangible assets amounting to $235.5 million for both the fiscal year ended December 31, 2023 and for the fiscal year ended December 31, 2022.
The recoverable amount of all CGUs has been determined based on value-in-use calculations that use pre-tax cash flow projections based on financial budgets and forecasts approved by management covering a five-year period. Cash flows beyond this period are extrapolated using estimated long-term growth rates. The value-in-use calculations are most sensitive to the following assumptions:
| | Sales volumes |
| | Selling prices |
| | Long-term growth rates |
| | Discount rates |
Management estimates sales volumes using independent industry forecasts and considers our market position relative to competitors. We assume weighted average sales volume compound annual growth rates ranging from 1.3% to 8.0% for its core operating activities for the 2024-2028 period.
For selling prices, we assume weighted average net realized selling price compound annual growth rates generally ranging from 0.7% to 3.0% for the same period. The growth rates reflect competitive supply dynamics and structural supply constraints in relevant markets.
Long-term growth rates are based on published industry research and demographic trends, such as population growth and economic output, in the states where we operate. These rates also consider cement/concrete intensity in construction, which varies by state. As of December 31, 2023, long-term growth rates were estimated by management to be 2.4%.
Discount rates reflect the current market assessment of the risks associated with each CGU. The pre-tax discount rates used in the value-in-use calculations were 9.2% for the fiscal year ended December 31, 2023 and 8.5% for the fiscal year ended December 31, 2022.
We have analyzed the sensitivities of the recoverable amounts to reasonably possible changes in key assumptions. A 100 basis point increase in our discount rate would still result in significant headroom indicating our goodwill is not at risk of impairment. A 50 basis point decrease in our long-term growth rate would still result in significant headroom indicating our goodwill is not at risk of impairment. The detailed analyses have been reviewed by our management and did not reveal any scenarios that would result in the carrying values of the CGUs exceeding their recoverable amounts as of December 31, 2023.
Fair value measurements
Recurring fair value measurements are those that the accounting standards require or permit in the statement of financial position at the end of each reporting period. The estimated fair value under IFRS represents the price that would be received to sell an asset or paid to transfer a liability in an orderly transaction between market participants at the measurement date, considering the counterpartys credit risk in the valuation, that is, an exit price or a market-based measurement. The concept of exit value is premised on the existence of a market and market participants for the specific asset or liability. When there is no market and/or market participants willing to make a market, IFRS establishes a fair value hierarchy that prioritizes the inputs to valuation techniques used to measure fair value. The hierarchy gives the highest priority to unadjusted quoted prices in active markets for identical assets or liabilities (Level 1, as defined below, measurements) and the lowest priority to measurements involving significant unobservable inputs (Level 3, as defined below, measurements). The three levels of the fair value hierarchy are as follows:
1) Level 1 represents quoted prices (unadjusted) in active markets for identical assets or liabilities that we can access at the measurement date. A quoted price in an active market provides the most reliable evidence of fair value and is used without adjustment to measure fair value whenever available.
112
Table of Contents
2) Level 2 are inputs other than quoted prices in active markets that are observable for the asset or liability, either directly or indirectly, and are used mainly to determine the fair value of derivatives.
3) Level 3 based on valuation techniques whereby all inputs having a material effect on the fair value are not derived from observable market data.
Critical judgment and estimates by management are required to appropriately identify the corresponding level of fair value applicable to each derivative instrument, as well as to assess the amounts of the resulting assets and liabilities, mainly in respect of Level 2 and Level 3, in order to account for the effects of derivative financial instruments in the financial statements.
Our derivative financial instruments are measured based on Level 2 inputs. Level 2 derivative financial instruments comprise cross currency interest rate swaps, interest rate swaps, foreign exchange forward contracts and natural gas futures.
We use a variety of valuation methods and makes assumptions that are based on market conditions existing at each reporting date. The recorded fair values of these contracts are based on:
a) forward exchange rates that are quoted in an active market;
b) forward interest rates extracted from observable yield curves; and
c) natural gas prices extracted from observable yield curves, which are quoted in an active market.
Any gains or losses arising from changes in the fair value of derivatives are recorded directly in our Consolidated Income Statement, except for the effective portion of cash flow hedges, which is recognized in other comprehensive income (OCI) and subsequently reclassified to profit or loss when the hedged item affects profit or loss.
Provisions for restoration obligations, environmental and equipment removal
Estimating site restoration, quarry rehabilitation and environmental costs involves inherent uncertainty due to unknown conditions, changing governmental regulations and legal standards regarding the liabilities, the length of the clean-up periods and evolving technologies. The restoration, environmental and remediation provisions reflect the information available to management at the time of determination of the liability and are adjusted periodically as remediation efforts progress or as additional technical or legal information becomes available.
We are required to restore the land used for quarries and processing sites at the end of their productive lives to a condition acceptable for the relevant authorities and consistent with our environmental policies. Provisions for restoration obligations, environmental and equipment removal are recognized when we have a present legal or constructive obligation as a result of past events, it is probable that an outflow of resources will be required to settle the obligation and the amount can be reliably estimated.
Estimated costs associated with such rehabilitation activities represent managements best estimate of expenditures required to settle the present obligation at the balance sheet date and are measured at the present value of future cash outflows expected to be incurred. Such cost estimates, initially expressed at current price levels, are adjusted for inflation (between 2.21% and 2.38% at September 30, 2024, between 2.14% and 2.63% at September 30, 2023, between 2.34% and 2.89% at December 31, 2023, between 2.35% and 3.00% at December 31, 2022 and 1.66% and 2.10% at December 31, 2021) to reflect expected annual cost increases between the date of the estimate and the forecasted payment date. The estimates are then discounted to present value at a rate consistent with the duration of the liability. Where a closure and restoration obligation arises from quarry/mine development activities or relates to the decommissioning of property, plant and equipment, the provision can be capitalized as part of the cost of the associated asset (intangible or tangible). The capitalized cost is depreciated over the useful life of the asset and any change in the net present value of the expected liability is included in finance cost, unless it arises from changes in valuation assumptions. Each year, the provisions are increased to reflect accretion of the discount, with these charges recorded as a component of finance cost.
113
Table of Contents
Provisions associated with environmental damage represent the estimated future cost of remediation. Estimating the future costs of these obligations is complex and requires us to use our judgment. The estimation of these costs is based on an evaluation of currently available facts with respect to each individual site and considers factors such as existing technology, currently enacted laws and regulations and prior experience in site remediation.
Material Weaknesses
As a privately held company, we were not required to assess and conclude on the effectiveness of our internal control over financial reporting in a manner that meets the standards of publicly traded companies required by Item 308(a) of Regulation S-K, and we are not yet subject to the certification or attestation requirements of Section 404 of the Sarbanes-Oxley Act. However, during the preparation of our financial statements included elsewhere in this prospectus we identified material weaknesses in our internal control over financial reporting. The PCAOB defines a material weakness as a deficiency, or a combination of deficiencies, in internal control over financial reporting, such that there is a reasonable possibility that a material misstatement of the companys annual or interim financial statements will not be prevented or detected on a timely basis.
We determined that we have a material weakness as we did not effectively design and maintain effective controls in response to the risks of material misstatement. Specifically, changes to existing controls or the implementation of new controls have not been sufficient to respond to changes to the risks of material misstatement to financial reporting. This material weakness contributed to the following material weaknesses:
| | We did not design and maintain effective controls related to the period-end financial reporting process, including controls over the preparation and review of account reconciliations and journal entries. Additionally, we did not design and maintain effective controls over the segregation of duties related to journal entries and account reconciliations, as certain personnel have the ability to both (i) create and post journal entries within our general ledger system and (ii) prepare and review account reconciliations without a review performed by someone without conflicting duties. The material weakness resulted in immaterial misstatements to various financial statement accounts in our consolidated financial statements included elsewhere in this prospectus. |
| | We did not design and maintain effective controls over the accuracy of price and quantity information for revenue recognition. Specifically, we did not design and maintain effective controls to (i) verify the invoiced quantity and price aligns with what was ordered by and agreed to with the customer, (ii) review and approve changes to quantities and prices and (iii) review and approve manual debit and credit memoranda. |
| | We did not design and maintain effective information technology (IT) general controls for information systems that are relevant to the preparation of our financial statements. Specifically, we did not design and maintain sufficient: |
| ○ | user access controls to ensure appropriate segregation of duties and to adequately restrict user and privileged access to appropriate personnel; |
| ○ | program change management controls to ensure that IT program and data changes are identified, tested, authorized and implemented appropriately; |
| ○ | computer operations controls to ensure that processing and transfer of data, and data backups and recovery are monitored; and |
| ○ | program development controls to ensure that new software development is tested, authorized and implemented appropriately. |
These IT deficiencies, when aggregated, could impact maintaining effective segregation of duties, as well as the effectiveness of IT-dependent controls (such as automated controls that address the risk of material misstatement along with the IT controls and underlying data that support the effectiveness of system-generated data and reports) that could result in misstatements potentially impacting all financial statement accounts and disclosures. Accordingly, management has determined these deficiencies in the aggregate constitute a material weakness.
114
Table of Contents
None of the material weaknesses described above resulted in a material misstatement to our financial statements. Nevertheless, we recognize that each of the material weaknesses described above could result in misstatements to substantially all financial statement accounts and disclosures that would result in a material misstatement to the annual or interim consolidated financial statements that would not be prevented or detected on a timely basis. As a result, and in connection with our plan to become a public company, we commenced an internal control over financial reporting (ICFR) project in our 2023 fiscal year. As part of our ICFR project, we are in the process of developing a remediation plan designed to remediate each of the identified material weaknesses; however, the material weaknesses described above will not be considered remediated until the action items arising out of the plan have been implemented and the new controls and procedures have been operating effectively for a sufficient period of time. While we will work to remediate the material weaknesses as quickly and efficiently as possible, we cannot at this time provide an expected timeline in connection with any remediation plan. These remediation measures may be time-consuming and costly and might place significant demands on our financial and operational resources.
As permitted under the U.S. securities laws, neither we nor our independent registered public accounting firm have performed or are required to perform an evaluation of the effectiveness of our internal control over financial reporting. In the future, we may identify additional material weaknesses in our internal control over financial reporting.
Failure to maintain effective internal control over financial reporting could result in misstatements in our financial statements that could lead to a restatement of our financial statements, cause us to fail to meet its reporting obligations or cause investors to lose confidence in our reported financial and other information, which may result in a decline in the market price of our shares.
New and Amended Standards and Interpretations
New and amended accounting standards and interpretations are described in Note 1 to our unaudited interim condensed consolidated financial statements and Note 1 to our audited consolidated financial statements included elsewhere in this prospectus.
Quantitative and Qualitative Disclosures About Market Risk
Our future income, cash flows and fair values relevant to financial instruments are dependent upon prevailing market interest rates and foreign currency exchange rates. Market risk refers to the risk of loss from adverse changes in market prices, foreign currency exchange rates and interest rates. The primary market risk we are exposed to is foreign currency exchange rate risk and interest rate risk. We have used derivative financial instruments to manage, or hedge, foreign currency exchange rate risk and interest rate risks related to our borrowings.
The majority of our debt obligations are denominated in Euros. As a result, we are exposed to foreign currency exchange rate risk arising from the conversion of Euro loan proceeds to U.S. Dollars at the borrowing date and the related obligation to repay the loans in Euros at maturity. To manage this exposure, the Company has entered into derivative financial instruments to offset its exposure to fluctuations in the Euro/U.S. Dollar exchange rate during the life of the loans as described above and in Note 9 to our audited consolidated financial statements included elsewhere in this prospectus. The following table demonstrates the sensitivity of our profit before income tax to reasonable changes in foreign exchange rates (after taking into consideration the impact of outstanding economic hedges in place for Euro denominated borrowings and other obligations), with all other variables held constant:
| Nine Months Ended |
Decrease in USD: Euro FX Rate |
Effect on profit before tax (-/+) |
Increase in USD: Euro FX Rate |
Effect on profit before tax (+/-) |
||||||||||||
| 09/30/2024 |
5.0 | % | $ | | (5.0 | )% | $ | | ||||||||
| 09/30/2023 |
5.0 | % | $ | | (5.0 | )% | $ | | ||||||||
| Year Ended |
Decrease in USD: Euro FX Rate |
Effect on profit before tax (-/+) |
Increase in USD: Euro FX Rate |
Effect on profit before tax (+/-) |
||||||||||||
| 12/31/2023 |
5.0 | % | $ | | (5.0 | )% | $ | | ||||||||
| 12/31/2022 |
5.0 | % | $ | | (5.0 | )% | $ | | ||||||||
| 12/31/2021 |
5.0 | % | $ | | (5.0 | )% | $ | | ||||||||
115
Table of Contents
As we have no material interest-bearing assets, our income and operating cash flows are not directly impacted by changes in market interest rates. Our interest rate risk arises from short-term and long-term borrowings. Borrowings issued at variable rates expose us to cash flow interest rate risk. Borrowings issued at fixed rates expose us to fair value interest rate risk. Our policy for long-term borrowings will vary and is managed by us in coordination with Titan Cements group treasury function. The following table demonstrates the sensitivity of our profit before income tax (considering the impact of the outstanding floating rate borrowings at the end of the period) to reasonable changes in interest rates, with all other variables held constant:
| Nine Months Ended |
Interest Rate Increase |
Effect on profit before tax (-/+) |
Interest Rate Decrease |
Effect on profit before tax (+/-) |
||||||||||||
| 09/30/2024 |
1.0 | % | $ | 181 | (1.0 | )% | $ | (181 | ) | |||||||
| 09/30/2023 |
1.0 | % | $ | 384 | (1.0 | )% | $ | (384 | ) | |||||||
| Year Ended |
Interest Rate Increase |
Effect on profit before tax (-/+) |
Interest Rate Decrease |
Effect on profit before tax (+/-) |
||||||||||||
| 12/31/2023 |
1.0 | % | $ | 403 | (1.0 | )% | $ | (403 | ) | |||||||
| 12/31/2022 |
1.0 | % | $ | 700 | (1.0 | )% | $ | (700 | ) | |||||||
| 12/31/2021 |
1.0 | % | $ | 378 | (1.0 | )% | $ | (378 | ) | |||||||
While the derivative financial instruments detailed above are intended to lessen the impact of rising interest rates and adverse changed in foreign currency exchange rates, they also expose us to the risk that the other parties to the agreements will not perform, we could incur significant costs associated with the settlement of the agreements and the agreements will be unenforceable. In addition, an increase in interest rates could decrease the amounts third parties are willing to pay for our assets, thereby limiting our ability to change our portfolio promptly in response to changes in economic or other conditions.
116
Table of Contents
Our products primarily serve the large and highly fragmented construction materials industry in the Eastern Seaboard. We are a well-established, leading player in the construction materials value chain where there are high barriers to entry. These barriers to entry include the capital-intensive nature of the heavy construction materials production process, as well as stringent regulations requiring new entrants to receive permits and approvals to operate, including acceptance from local communities.
Key Trends in the Construction Industry
We have identified several key trends that are driving growth in the markets in which we operate, including (i) a structural deficit in residential housing supply, (ii) historic levels of investment into critical infrastructure, (iii) growing corporate, state and federal investment into manufacturing onshoring, (iv) a deficit of domestic cement manufacturing capacity combined with a shortage of aggregates in the high-growth Florida market, (v) pricing growth across our core products, (vi) increasing demand for lower-carbon cement products and solutions and (vii) dynamic transformation themes that offer opportunities to address energy transformation, decarbonization, the circular economy, infrastructure modernization, resilient urbanization and refurbishment and renovation of existing buildings and infrastructure.
Residential Housing Shortage
We believe that the demand for construction materials will benefit greatly from the tailwinds driven by the critical need for residential homes caused by the current shortage in the U.S. residential market.
It is estimated that the U.S. residential market is underbuilt by 3.4 million homes as of May 2024, with the six key states in which we operate accounting for 860,000, or 25%, of the shortage, according to the PCA. We believe this shortage is the result of strong demand for housing, driven by a rapid increase in household formation by millennials and other age groups. According to the PCA, 89 million people in the United States are in the prime first-time home buyer age range of 25 to 44 as of May 2024. Housing demand is also increasing as a result of population growth including migration domestically across the United States and immigration into the United States.
The residential construction sector widely leverages concrete and related products as a key input. Concrete is used as a foundation material in both single- and multi-family homes and is a major input in other parts of the construction process. Additionally, certain regions of the United States, including the state of Florida, require concrete blocks to be used in home construction, in recognition of its storm resistance and energy efficiency properties.
Economists expect the undersupply of residential housing, along with rising residential housing prices and rents, to spur investment in new home building activity, according to S&P Global. As new housing starts to rise to meet consumer demand, we expect that demand for construction materials and related products will increase.
Government Support and Investment in Critical U.S. Infrastructure
We believe that the historic investment in U.S. infrastructure represents a key driver for the growth of consumption of heavy construction materials over the next five to eight years.
The IIJA authorized $1.2 trillion of transportation and infrastructure spending, with $550 billion going towards new investments and programs and the rest budgeted for continued investment in existing vital infrastructure. Under the IIJA, the six key states in which we operate will receive an aggregate of $81.7 billion in additional federal funds for infrastructure projects announced as of June 11, 2024. According to PCA, each dollar invested in public construction (defined by PCA to include public buildings, highways & streets, military/public security, conservation, sewer systems and water supply systems) results in approximately 3.0 times higher consumption of cement when compared to the residential or non-residential buildings, on average over the last ten years.
117
Table of Contents
According to the PCA, the IIJA is expected to require approximately 52 million tons of cement over the next five years across the United States, with 39% of that volume going to the construction and renovation of roads, bridges and other major projects, which we expect will result in increased demand for cement, aggregates and related products. As of May 13, 2024, improvements and repairs are underway on more than 257,000 miles of roads and 13,000 bridges across the United States, and over $300 billion is expected to be invested in roads and bridges over the life of the IIJA.
In addition to federal funding, we are witnessing increased investment from state and local governments for infrastructure construction and renovation. According to the Florida Department of Transportation (FDOT), the DOT has allocated $65.8 billion to Florida over the next five years, independent of the IIJA and mostly dependent on state funds. This five-year budget is a key component in ensuring that Floridas transportation network continues to support the states economic growth and improve mobility for a population that surpassed 23 million as of April 1, 2024 according to the Florida Demographic Estimating Conference. This funding is expected to contribute to continued widening and improvement of I-75, I-95, I-4 and other major highways to reduce congestion and improve freight mobility; the expansion of rail systems for freight and people transport after the success of the Brightline high speed passenger rail system (with additional stops and further expansion into Tampa); port and airport modernizations to enhance major seaports and airports, such as Port Miami, Port Everglades, Port Tampa Bay, Miami International Airport and Orlando International Airport; resilience initiatives including enhancements to better handle hurricanes and flooding risks; and the largest expenditure to date on the restoration of the Everglades and the construction of the Everglades Agricultural Area, which is expected to be the largest reservoir in the United States. Additionally, since the inception of the Resilient Florida Program in 2021, which facilitates investments into infrastructure to protect Floridas inland waterways, coastlines and shores, spending has reached $1 billion.
The DOTs budgets for the Mid-Atlantic region are historically well funded with the 2025 state budgets having a combined total of $35 billion allocated by the DOT (North Carolina: $5 billion, Virginia: $8.9 billion, New York: $16.4 billion and New Jersey: $4.9 billion), which is in addition to any IIJA funding allocated to these states. These extensive projects include plans for the construction of new transportation infrastructure, for example, there are plans to (i) expand interstates in the fast growing metropolitan and coastal areas of North Carolina, (ii) widen highways, expand bridges, build new tunnels and expand I-66 in Virginia and Washington, D.C. and (iii) rehabilitate aged infrastructure, especially in bridges and tunnels, in New York and New Jersey.
The economies of the six key states in which we operate have strong government spending driven by a significant military presence that are major drivers in their respective economies. According to the DOD, Virginia, Florida and New York are in the 10 states receiving the highest funding from the DOD in fiscal year 2023, with Virginia historically being near the top in total budget allocation at over $62 billion in fiscal year 2022 and $68 billion in fiscal year 2023. Military spending represents nearly 10% of Virginias GDP. In North Carolina, the state budget office credits the military as its second largest economic driver. The DOD 2024 budget includes $18.7 billion in funding for military construction projects across the United States, and sets aside additional funds for family housing, troop barracks, fortification against climate change, shipyard infrastructure and other concrete-intensive construction spending.
Investment in Manufacturing
We believe that the ongoing investment in domestic manufacturing will drive growth in the consumption of heavy construction materials.
According to McKinsey & Company, the U.S. manufacturing sector is poised for robust growth through 2029, driven by strong government incentives, technological innovation and a strategic focus on building more resilient supply chains and sustainable production systems. The DMI, which measures non-residential building projects that are in the planning stage, has grown in recent months, indicating significant increases in manufacturing-related construction spending as a result of businesses efforts to reshape supply chains and leverage federal policies that support demand for heavy industrial projects.
118
Table of Contents
Key federal policies promoting domestic manufacturing include the CHIPS and Science Act and the IRA, which direct more than $422 billion in incentives. These legislative efforts are channeling significant capital into key industries such as semiconductors, electronic vehicles, aerospace and clean energy, resulting in notable investments in domestic manufacturing, including (i) a $100 billion in semiconductor manufacturing in New York, (ii) a multibillion-dollar battery manufacturing plant in North Carolina, (iii) a $350 million robotics fulfillment and delivery center in Virginia, (iv) a $1.7 billion EV manufacturing facility expansion in South Carolina and (v) a $9.8 billion offshore wind farm in Virginia Beach.
Additionally, technological advancements in automation, artificial intelligence and robotics are further enhancing the competitiveness of U.S. manufacturing, making domestic production more viable in industries that previously operated their manufacturing supply chains internationally. This technological shift, coupled with the ongoing reshoring of production to mitigate global supply chain vulnerabilities, is driving significant investments across the United States.
Domestic Cement Production Deficit, Florida Aggregates Shortage
According to the USGS, the amount of cement produced domestically in recent years has plateaued at or around 100 million tons per annum. However, as shown below, domestic demand for cement has continued to grow, surpassing domestic production capacity. The amount of imported cement consumed in the United States has grown significantly since 2013, from 7 million tons in 2013 to 21 million tons in 2023. We believe the supply/demand imbalance in domestic cement production will drive the long-term need for import capacity.
Net Imports as a % of Cement Consumption
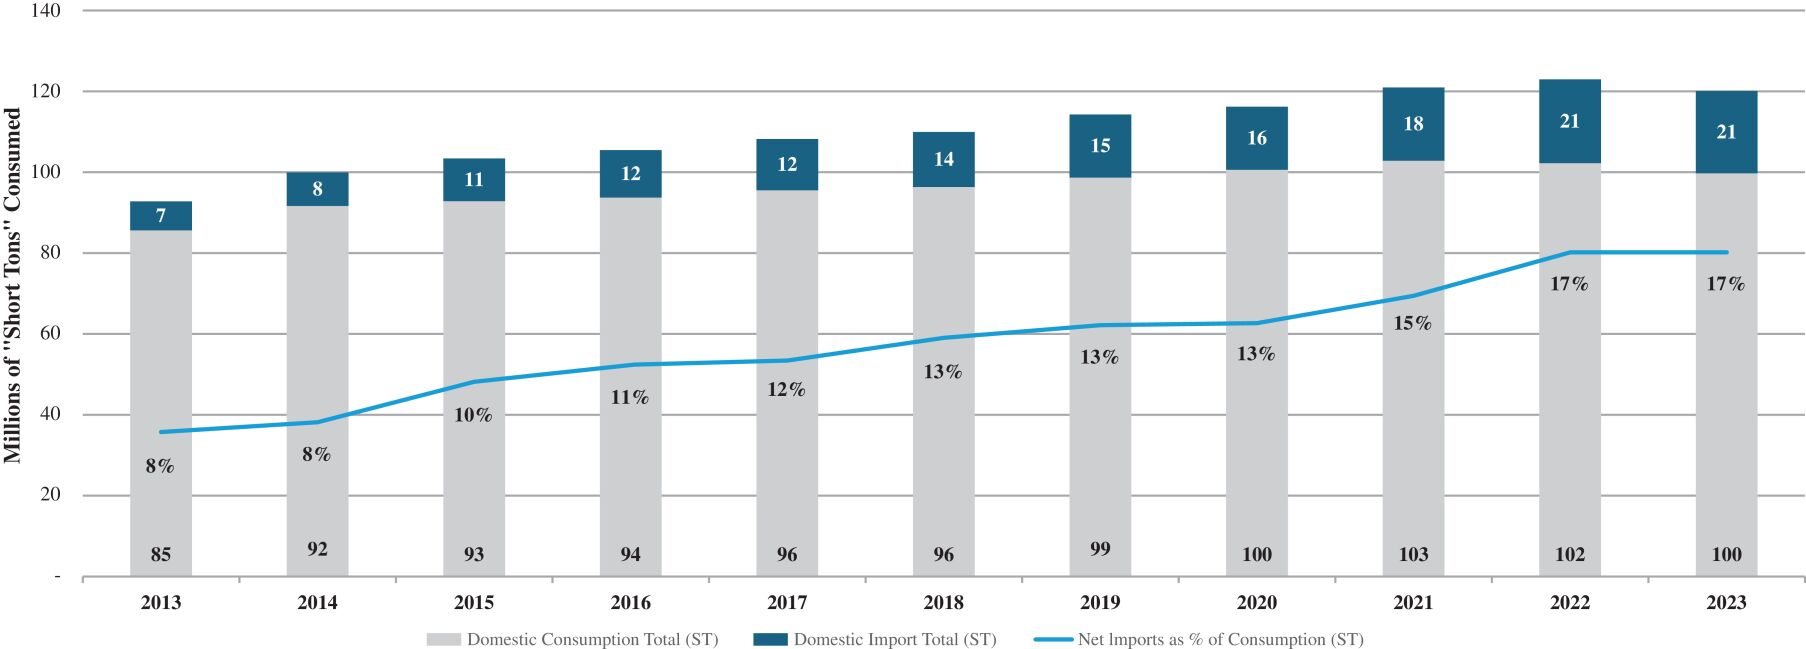
Source: USGS Mineral Industry Surveys with data converted from metric tons to U.S. short tons.
Industry participants are focused on maximizing the utilization of their clinker capacity and leverage imported cement as a flexible source of supply to meet demand for cement that cannot be produced domestically with existing infrastructure. The cost to build new clinker capacity is very high, making it more economical to meet fluctuations in demand with imported cement. Cement manufacturers that operate cement import facilities are able to opportunistically import and store cement, optimizing domestic production capacity while maintaining the capability to serve customers across demand cycles.
The FDOT recognized as early as 2007 that there were insufficient limestone reserves in Florida to continue meeting the states demand of up to 150 million tons annually of construction grade aggregates. The FDOT further identified that rail and marine import infrastructure limited outside supply of these annual construction grade aggregates needs. In May 2022, the situation was further exacerbated when Vulcan Calica was abruptly shut down by the Mexican government and remains offline today.
119
Table of Contents
Pricing Growth Across our Core Products
Prices for our core products have consistently risen over the last decade through economic cycles, as demand for cement, aggregates and related products has increased with ongoing growth in residential, non-residential and infrastructure construction across the United States. Factors impacting the industry-wide growth in pricing of our core products include increased energy, labor and logistics input costs, greater demand for cement and related products coupled with stagnant domestic clinker and cement production and capacity and investments in decarbonization and meeting increasingly stringent environmental regulations.
As shown below, the average selling prices that domestic industry participants have received for core products has remained steady or grown through economic cycles.
Producer Price Index: Cement and Concrete Product Manufacturing
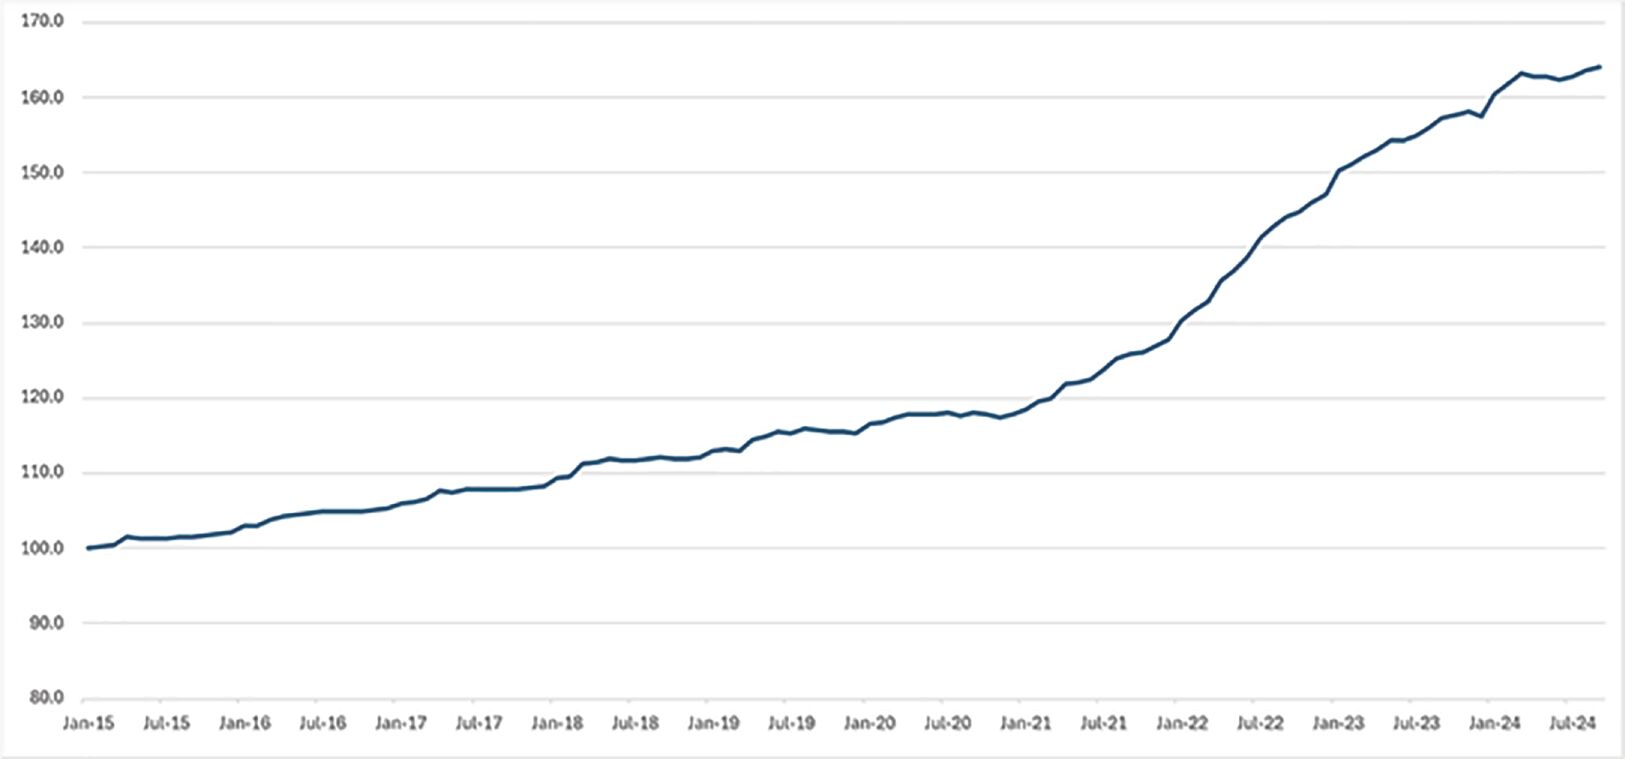
Source: Federal Reserve Economic Data, Indexed January 2015 = 100.
120
Table of Contents
Producer Price Index: Ready-Mix Concrete Manufacturing
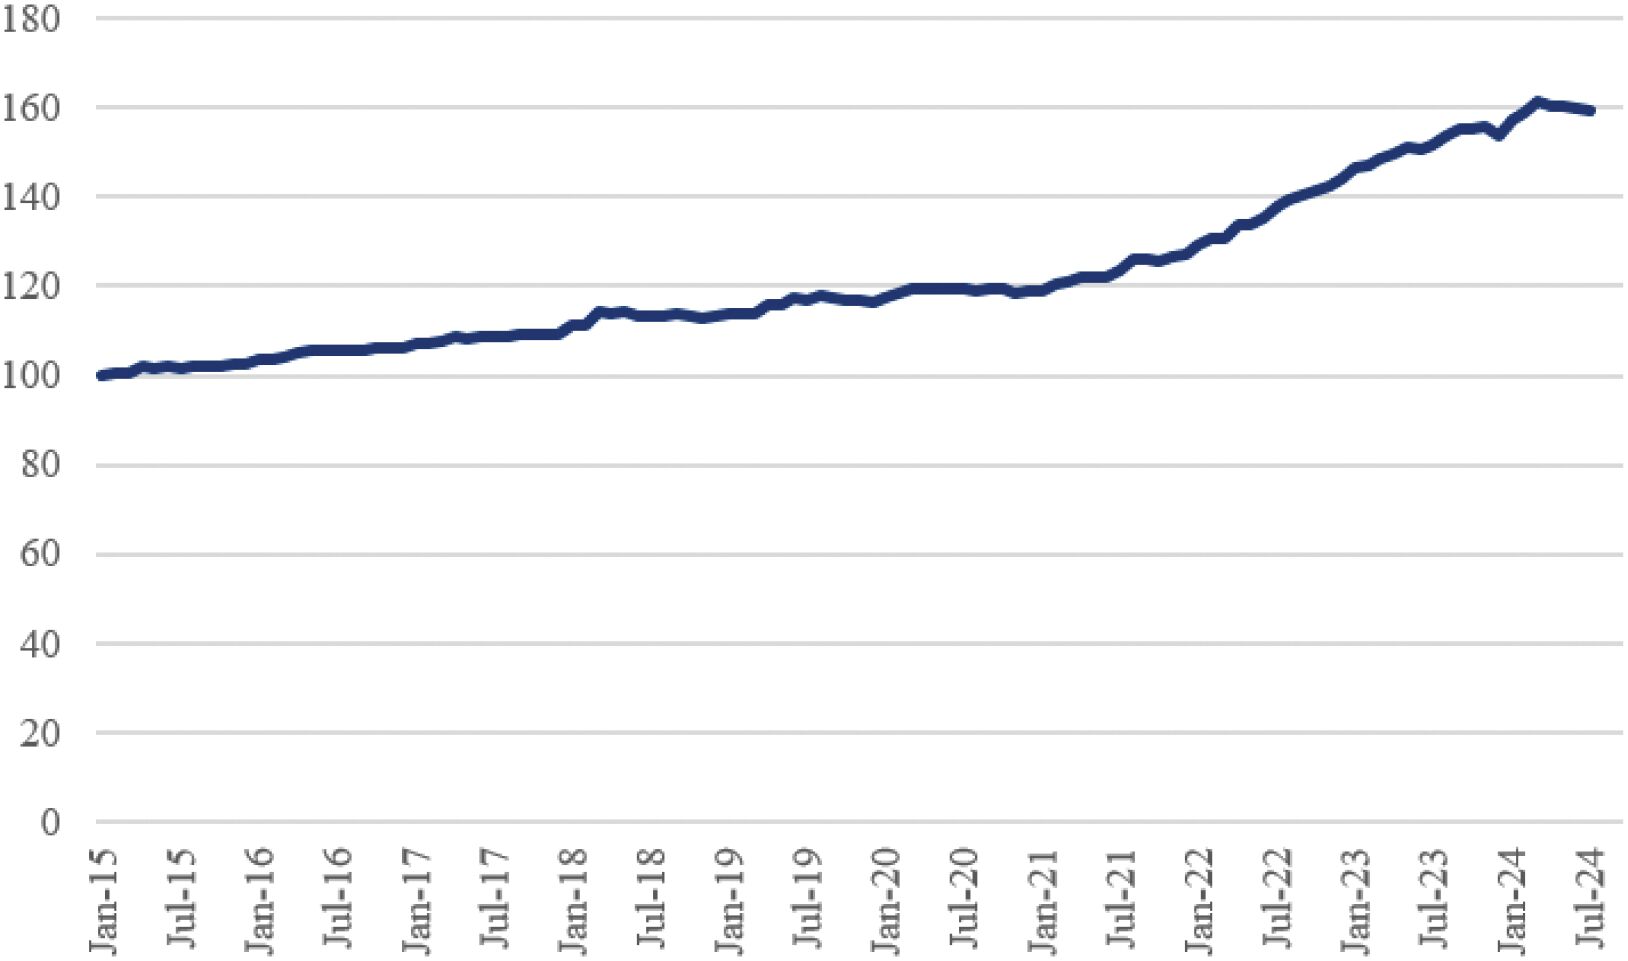
Source: Federal Reserve Economic Data, Indexed January 2015 = 100.
Producer Price Index: Nonmetallic Mineral Products: Treated Lightweight Aggregate and Crushed Slag, Minerals and Earths
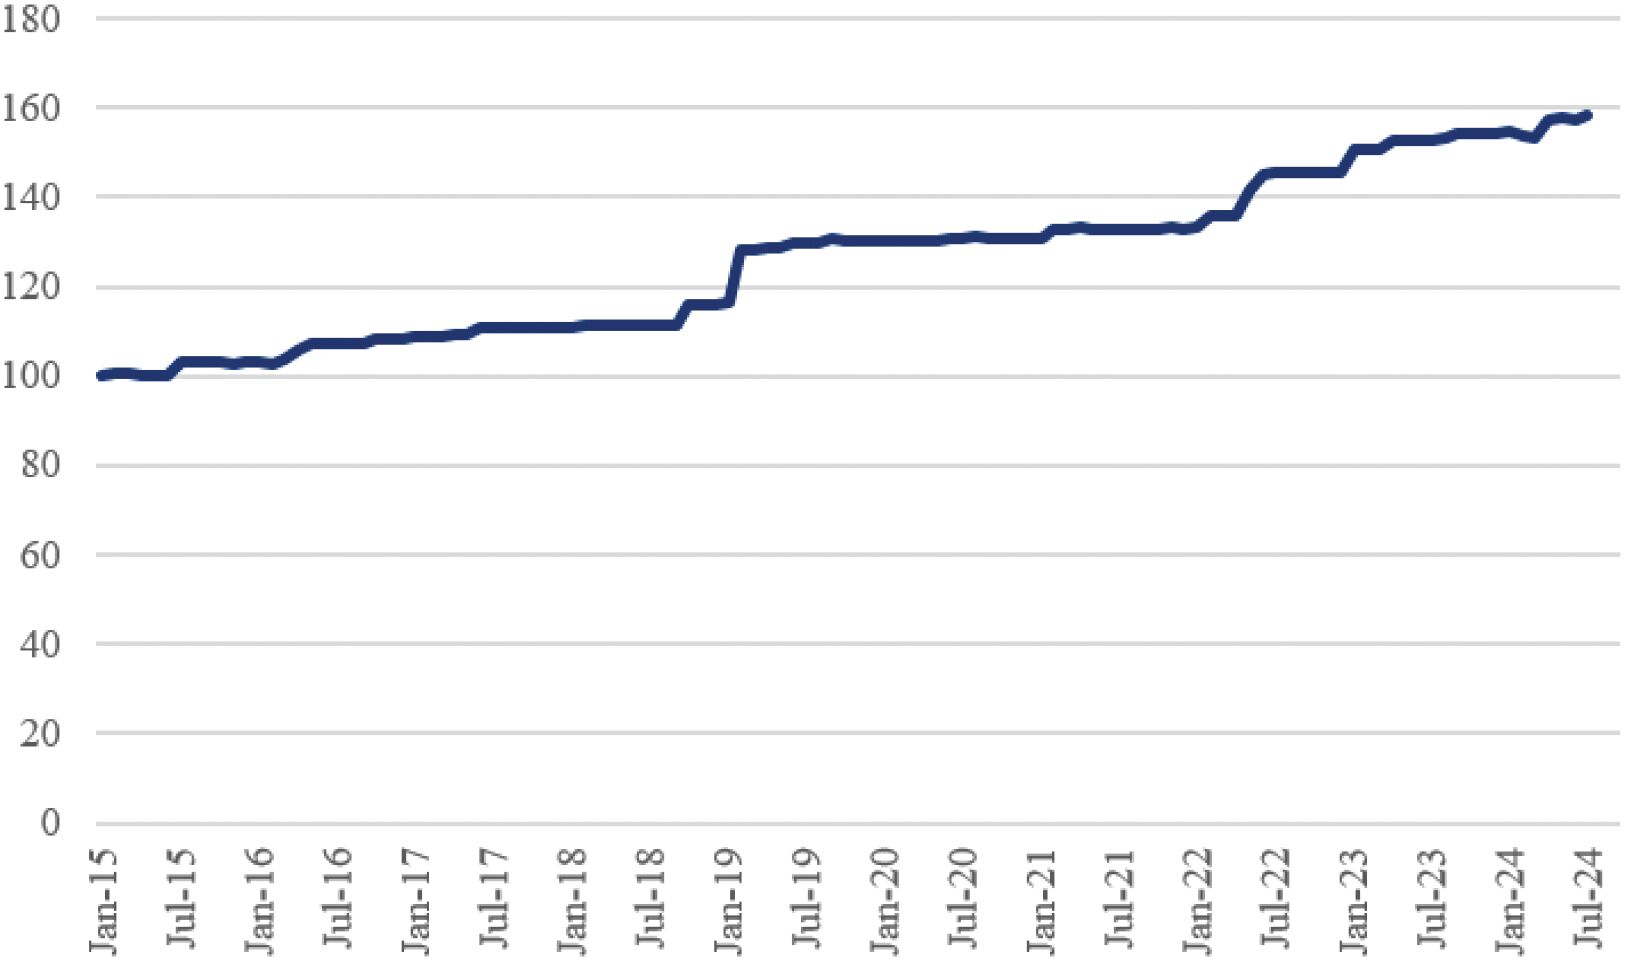
Source: Federal Reserve Economic Data, Indexed January 2015 = 100.
Increasing Demand for Lower-Carbon Cement and Other Green Products and Solutions
The construction materials industry is characterized by dynamic economic and technological transformational themes that we believe will drive the development of new technologies, materials, products and service models.
121
Table of Contents
For one, we believe the growing societal and industry demand for reduced carbon emissions are leading to an increase in demand for lower CO2 construction materials.
The construction materials industry is rapidly evolving, creating opportunities to address new pools of demand for products that tackle the need for energy transformation, decarbonization and sustainable construction materials, resilient urbanization, smart and sustainable cities and long-lasting refurbishment and renovation of critical infrastructure. Further, new construction technologies such as prefabricated and modular construction, drones, 3D printing, building information model (BIM), virtual reality models in planning and design and cloud-based workflow models will require new, lighter and more durable high-performance products and innovative solutions, generating new addressable value pools of high growth and high margin products and solutions.
Communities, consumers and businesses increasingly have a heightened awareness and desire to embrace more sustainable practices. This social shift towards carbon reduction is not only fostering innovation but is also creating opportunities for the development of greener construction products and methods. According to S&P Global, 45% of companies included in the S&P 500 index have committed to net-zero emissions targets. These companies are often at the forefront of this shift, having committed to significant reductions in their carbon footprints, including those related to their construction activities. Additionally, MSAs such as Miami-Dade and New York have made the significant environmental commitments of being net-zero on carbon emissions by 2050 and 2040, respectively. These commitments will provide significant funding to less carbon intensive construction and product development.
In response, manufacturers of heavy construction materials, including us, are prioritizing the development and use of less carbon-intensive raw materials and SCMs, alternative fuels and CCUS. These trends are expected to accelerate as more companies, municipalities and industries align with global sustainability goals, further intensifying the development of less carbon-intensive construction materials and techniques.
Supplementary cementitious materials such as fly ash and slag are industrial byproducts that can improve the strength, permeability, durability, consistency and hydraulic factors of concrete, utilized as replacements to clinker in the cement production supply chain. Cement manufacturers are investing to secure reliable sources of SCMs amid concerns regarding limited availability and rising prices. SCMs can substantially reduce the carbon footprint associated with traditional cement and concrete, and we expect industry players to continue to increase the use of SCMs and invest behind technology that allows for production of higher quality SCMs.
The cement production process is energy intensive, requiring high amounts of process fuels and electricity. Traditionally, cement manufacturers have utilized fossil fuels, including coal, natural gas and oil to produce clinker. The industry as a whole is investing in technologies and capabilities that allow for the beneficial reuse of industrial waste streams as fuels that replace coal, natural gas and oil. These alternative fuels serve a variety of purposes, including (i) the reduction of energy input costs in the cement production process, (ii) the reduction in greenhouse gas emissions associated with cement production and (iii) creating a beneficial use for industrial waste streams that keeps the material from landfills.
Further, the cement industry is increasingly investing in CCUS technologies to capture the carbon dioxide produced during the calcination process and store it underground or repurpose it in other industrial applications.
Investment in technologies enabling lower carbon and greener cement production is anticipated to improve energy efficiency and open new revenue streams by catering to the growing market demand for less carbon-intensive building materials and services, which can command a price premium compared to carbon-intensive products.
Our Core Products
Our core products include cement, aggregates, ready-mix concrete, concrete blocks and fly ash. We sell our products to residential, non-residential and infrastructure end markets along the Eastern Seaboard.
122
Table of Contents
Cement
The cement production process leverages aggregates that are mined from quarries and transported to the cement manufacturing facility. Once quarry materials are brought to a cement production plant, they are ground into fine dust, fed into a kiln, heated by combustion of conventional and alternative fuels and transformed into small granules known as clinker. The clinker is then ground with gypsum, limestone and other additives to become cement. Companies in the cement industry manufacture multitudes of cement variations, including but not limited to, OPC, Portland-limestone, masonry, pozzolanic and other hydraulic types of cement, each with varying uses in specific construction and various applications. Companies in the cement industry sell the product primarily to concrete applications, along with various other end-use applications.
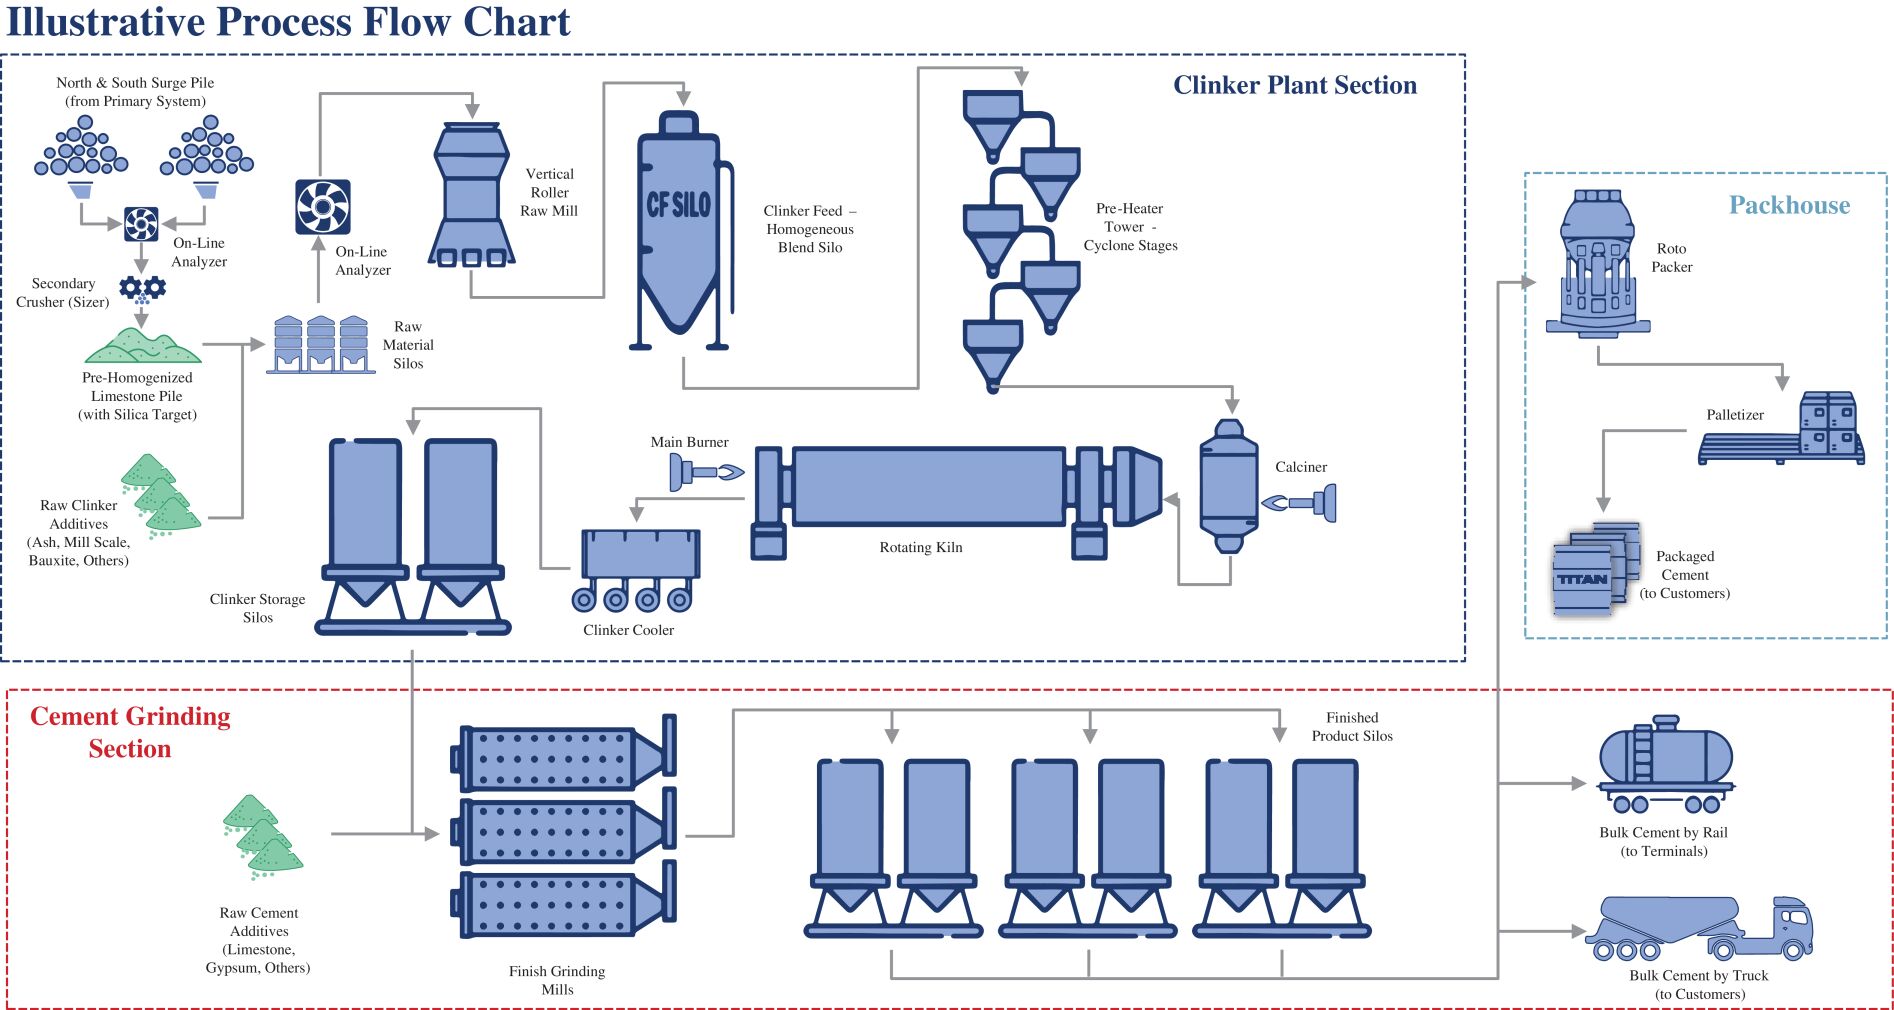
Note: Illustrative process chart based on our Pennsuco plant.
According to the PCA, approximately 120 million tons of cement were sold and transported in North America in 2023, of which 33 million tons were consumed along the Eastern Seaboard. According to the PCA, cement consumption in the Eastern Seaboard is expected to grow at a 1.8% CAGR between 2020 and 2050, compared to the expected 1.3% CAGR across the United States. In Florida and the Mid-Atlantic, cement consumption is expected to grow by approximately 20% and 13% from 2024 to 2029, respectively, outpacing the rest of the United States, according to the 2024 Summer PCA Forecast by States.
Aggregates
Aggregates products include crushed stone, sand and gravel and are primarily used in manufacturing concrete, asphalt and unbound base applications. Companies in the aggregates industry mine from quarries and sell the product to various end-use applications, including concrete producers.
Due to the high weight-to-value ratio of aggregates, materials are typically transported economically over a limited distance.
123
Table of Contents
Aggregates Limestone and Stone & Gravel ('000s Short Tons)
| 2013 | 2014 | 2015 | 2016 | 2017 | 2018 | 2019 | 2020 | 2021 | 2022 | CAGR 2013-2022 |
||||||||||||||||||||||||||||||||||
| Florida |
74,185 | 79,587 | 92,043 | 101,633 | 102,405 | 107,916 | 112,546 | 115,743 | 120,042 | 126,325 | 6.1 | % | ||||||||||||||||||||||||||||||||
| New Jersey |
12,473 | 13,726 | 13,542 | 14,257 | 15,726 | 15,732 | 15,656 | 14,668 | 14,668 | 14,991 | 2.1 | % | ||||||||||||||||||||||||||||||||
| New York |
56,769 | 55,667 | 62,170 | 59,966 | 58,312 | 59,304 | 60,076 | 56,328 | 59,635 | 59,084 | 0.4 | % | ||||||||||||||||||||||||||||||||
| North Carolina |
11,662 | 11,210 | 11,729 | 12,588 | 14,032 | 14,429 | 14,694 | 12,908 | 15,300 | 15,532 | 3.2 | % | ||||||||||||||||||||||||||||||||
| South Carolina |
15,664 | 15,807 | 14,958 | 14,021 | 14,418 | 14,771 | 14,804 | 16,369 | 14,738 | 15,972 | 0.2 | % | ||||||||||||||||||||||||||||||||
| Virginia |
36,839 | 23,380 | 31,151 | 27,150 | 29,707 | 27,899 | 27,040 | 26,092 | 26,665 | 25,177 | -4.1 | % | ||||||||||||||||||||||||||||||||
|
|
|
|
|
|
|
|
|
|
|
|
|
|
|
|
|
|
|
|
|
|
|
|||||||||||||||||||||||
| Total TA Markets |
207,593 | 199,377 | 225,593 | 229,616 | 234,600 | 240,052 | 244,815 | 242,108 | 251,048 | 257,081 | 2.4 | % | ||||||||||||||||||||||||||||||||
|
|
|
|
|
|
|
|
|
|
|
|
|
|
|
|
|
|
|
|
|
|
|
|||||||||||||||||||||||
| Total United States |
1,795,826 | 1,844,216 | 1,965,121 | 1,974,739 | 1,990,657 | 2,057,093 | 2,117,265 | 2,100,464 | 2,136,798 | 2,189,357 | 2.2 | % | ||||||||||||||||||||||||||||||||
|
|
|
|
|
|
|
|
|
|
|
|
|
|
|
|
|
|
|
|
|
|
|
|||||||||||||||||||||||
Source: USGS
Ready-Mix Concrete
Ready-mix concrete refers to unhardened mixed concrete delivered to job sites. Ready-mix concrete is manufactured in batching plants according to a set recipe and then delivered to construction sites in a freshly mixed state using trucks. It is mixed in specific proportions of cement, water, aggregates and sometimes additives, ensuring consistency and quality. This method allows for precise control over the concretes properties, such as strength and workability, making it a convenient option for various construction projects.
According to Concrete Financial Insights, approximately 400 million cubic yards of ready-mix concrete were sold and transported in the United States in 2023.
Concrete Blocks
Concrete blocks are made from a mixture of cement, water and aggregate and are used in building construction. Florida is the largest concrete block market in the United States since concrete blocks are required by the South Florida building code due to their energy efficiency, storm and fire resistance qualities, termite resistance and design flexibility. We believe that the expected increase in severe weather events caused by climate change may continue to increase demand for concrete blocks due to their storm and fire resistance qualities.
Fly Ash
SCMs, such as fly ash, are used in cement and concrete production to enhance the durability, impermeability, workability and sustainability of concrete. Fly ash is generated as a by-product of coal combustion in the generation of electricity by utilities and can be recycled for use as a replacement to clinker in the cement production process, improving grinding efficiency and reducing the carbon footprint of the final product.
While some fly ash produced as an industrial byproduct may be used as a clinker replacement in the manufacturing of cement or as a cement replacement in the production of concrete without further treatment, other sources of fly ash may require beneficiation or other treatment. Depending on the efficiency and the type of coal combustion process at the electric utility, fly ash can vary significantly in composition as well as the amount of the unburnt carbon it contains. Providers of fly ash for cement manufacturing or concrete production collect fly ash and treat it to a desired, consistent mineral composition, allowing for use as a cement or concrete additive.
124
Table of Contents
Key End Markets of the Construction Industry
Our products primarily serve the residential, non-residential and infrastructure construction end markets. These end markets are expected to grow over the coming years, as shown below:
Historical and Forecast Construction Put-in-Place in the United States
| ($ in Billions) | 2021 | 2022 | 2023 | 2024 | 2025 | 2026 | 2027 | 2028 | CAGR 2021-2028 |
|||||||||||||||||||||||||||
| Residential |
$ | 137 | $ | 142 | $ | 139 | $ | 145 | $ | 157 | $ | 174 | $ | 195 | $ | 214 | 2.8 | % | ||||||||||||||||||
| Nonresidential |
73 | 91 | 110 | 115 | 121 | 125 | 131 | 136 | 4.0 | % | ||||||||||||||||||||||||||
| Nonbuilding |
47 | 52 | 59 | 74 | 83 | 82 | 82 | 80 | 3.4 | % | ||||||||||||||||||||||||||
|
|
|
|
|
|
|
|
|
|
|
|
|
|
|
|
|
|
|
|||||||||||||||||||
| Total |
$ | 257 | $ | 285 | $ | 308 | $ | 334 | $ | 360 | $ | 381 | $ | 407 | $ | 430 | 3.3 | % | ||||||||||||||||||
|
|
|
|
|
|
|
|
|
|
|
|
|
|
|
|
|
|
|
|||||||||||||||||||
Source: Dodge Data & Analytics Annual Construction Starts Put-in-Place Value Estimates June 2024
Residential
Cement and related products have broad applications in the single family and multifamily residential construction industry, for applications across the new build and renovation/refurbishment spectrum. Cement products are utilized in the concrete and mortar that forms the foundation of the house. Cement products are also leveraged to create or otherwise build concrete building blocks, pavers, driveways, sidewalks, mortar and grout.
We believe there is structural undersupply in residential construction. It is estimated that the U.S. residential market is underbuilt by 3.4 million homes as of May 2024, of which approximately 417,000 are in Florida according to the PCA. Housing demand is also increasing, according to the PCA, 89 million people in the United States are in the prime first-time home buyer age range of 25 to 44 as of May 2024.
According to the U.S. Census Bureau, annual residential construction spending in the United States has more than doubled since 2013. Spend growth is driven by multiple key end-market dynamics, such as undersupply of single-family housing units and positive demographic trends. Based on data from the Federal Reserve Economic Data (FRED), total annual single-family housing starts in the United States were approximately 0.9 million in 2023. This compares to 1.4 million on average from 2000 to 2007. Despite the decrease in single family housing starts from long-term averages, multi-family starts grew to over 400,000 units per year in the years following the COVID pandemic.
Non-residential
Cement, aggregates and related products are used in the non-residential construction industry to build commercial and industrial buildings, for example, manufacturing facilities, shopping centers, data centers, warehouses, hospitals, schools, hotels and restaurants. Cement is often favored as a construction input for the non-residential sector due to its ease of use, strength, durability and versatility.
Non-residential commercial construction is expected to accelerate. The DMI, which measures non-residential building projects in planning and is a key indicator of forward construction spending, is currently above historical averages. Manufacturing spending in the United States has seen a strong increase since 2021, supported by government initiatives related to the onshoring of manufacturing, with the CHIPS Act and the IRA directing more than $422 billion in incentives for domestic manufacturing, supporting demand for heavy industrial projects.
Infrastructure
Cement, aggregates and other related products are used in the infrastructure construction industry to build, renovate and refurbish bridges, roads, highways, airports, military facilities, tunnels, water and sewage treatment and distribution facilities, and any other project that is funded by federal, state or local governments.
125
Table of Contents
Infrastructure construction is primarily driven through government contracts, which are based on the necessary repair and replacement of old infrastructure and new development in the United States. The IIJA authorized $1.2 trillion of transportation and infrastructure spending, with $550 billion going towards new investments and programs and the rest budgeted for continued investment in existing vital infrastructure.
Under the IIJA, the six key states in which we operate will receive an aggregate of $81.7 billion in additional federal funds for infrastructure projects announced as of June 11, 2024. The IIJA is expected to lead to 48 million tons of incremental cement demand.
Industry Drivers for Key States in Which We Operate
We operate in the Eastern Seaboard of the United States. These markets are expected to experience some of the strongest volume growth trends in the United States.
U.S. and Titan America Markets Cement Consumption
| ('000 Short Tons) |
2020 | 2025 | 2030 | 2035 | 2040 | 2045 | 2050 | Growth 2020-2050 |
CAGR 2020-2050 |
|||||||||||||||||||||||||||
| Florida |
8,913 | 10,106 | 12,019 | 13,553 | 15,057 | 16,235 | 17,412 | 8,500 | 2.3 | % | ||||||||||||||||||||||||||
| New Jersey |
1,595 | 1,636 | 1,855 | 1,983 | 2,116 | 2,247 | 2,377 | 783 | 1.3 | % | ||||||||||||||||||||||||||
| New York |
3,196 | 3,711 | 4,003 | 4,051 | 4,084 | 4,092 | 4,081 | 884 | 0.8 | % | ||||||||||||||||||||||||||
| North Carolina |
3,296 | 3,801 | 4,234 | 4,601 | 4,975 | 5,364 | 5,776 | 2,480 | 1.9 | % | ||||||||||||||||||||||||||
| South Carolina |
1,863 | 2,284 | 2,547 | 2,835 | 3,134 | 3,451 | 3,789 | 1,926 | 2.4 | % | ||||||||||||||||||||||||||
| Virginia |
2,325 | 2,530 | 2,693 | 2,888 | 3,083 | 3,277 | 3,471 | 1,146 | 1.3 | % | ||||||||||||||||||||||||||
|
|
|
|
|
|
|
|
|
|
|
|
|
|
|
|
|
|
|
|||||||||||||||||||
| Total Titan Key Markets |
21,188 | 24,067 | 27,350 | 29,911 | 32,449 | 34,666 | 36,906 | 15,719 | 1.9 | % | ||||||||||||||||||||||||||
|
|
|
|
|
|
|
|
|
|
|
|
|
|
|
|
|
|
|
|||||||||||||||||||
| United States |
114,739 | 122,959 | 136,347 | 145,170 | 153,012 | 160,193 | 167,225 | 52,486 | 1.3 | % | ||||||||||||||||||||||||||
|
|
|
|
|
|
|
|
|
|
|
|
|
|
|
|
|
|
|
|||||||||||||||||||
Source: PCA Long Term Outlook 2024. Note: Includes Portland and Masonry cement.
Federal Funding IIJA, Announced Funding ($ Billions)
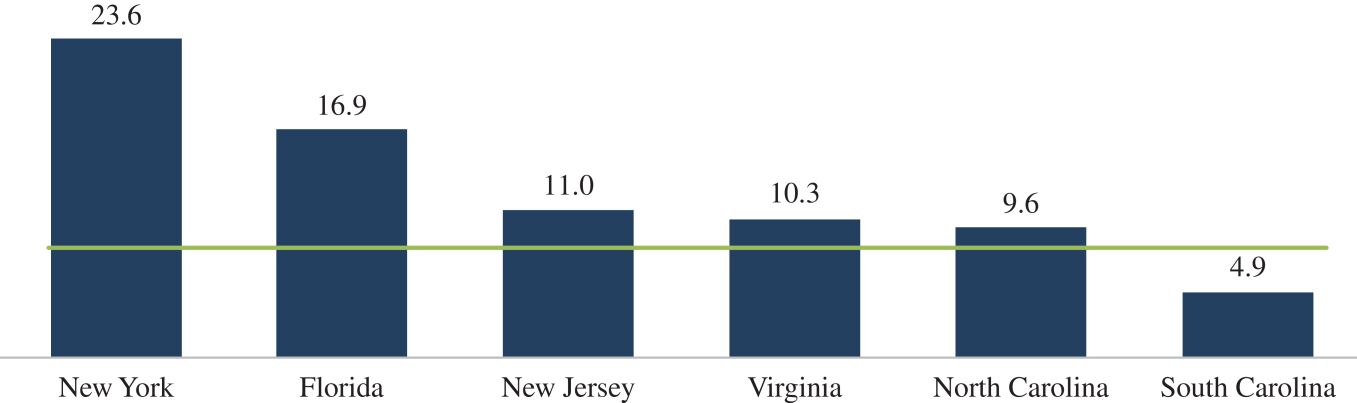
Source: whitehouse.gov/Invest
More broadly, over the next few years, our geographic exposure is expected to see a cumulative construction spend that exceeds the U.S. average. From 2024 to 2028, the six key states in which we operate are expected to spend an average of approximately $273 billion.
126
Table of Contents
Estimated Cumulative Construction Spend, 2024-2028 ($ Billions)
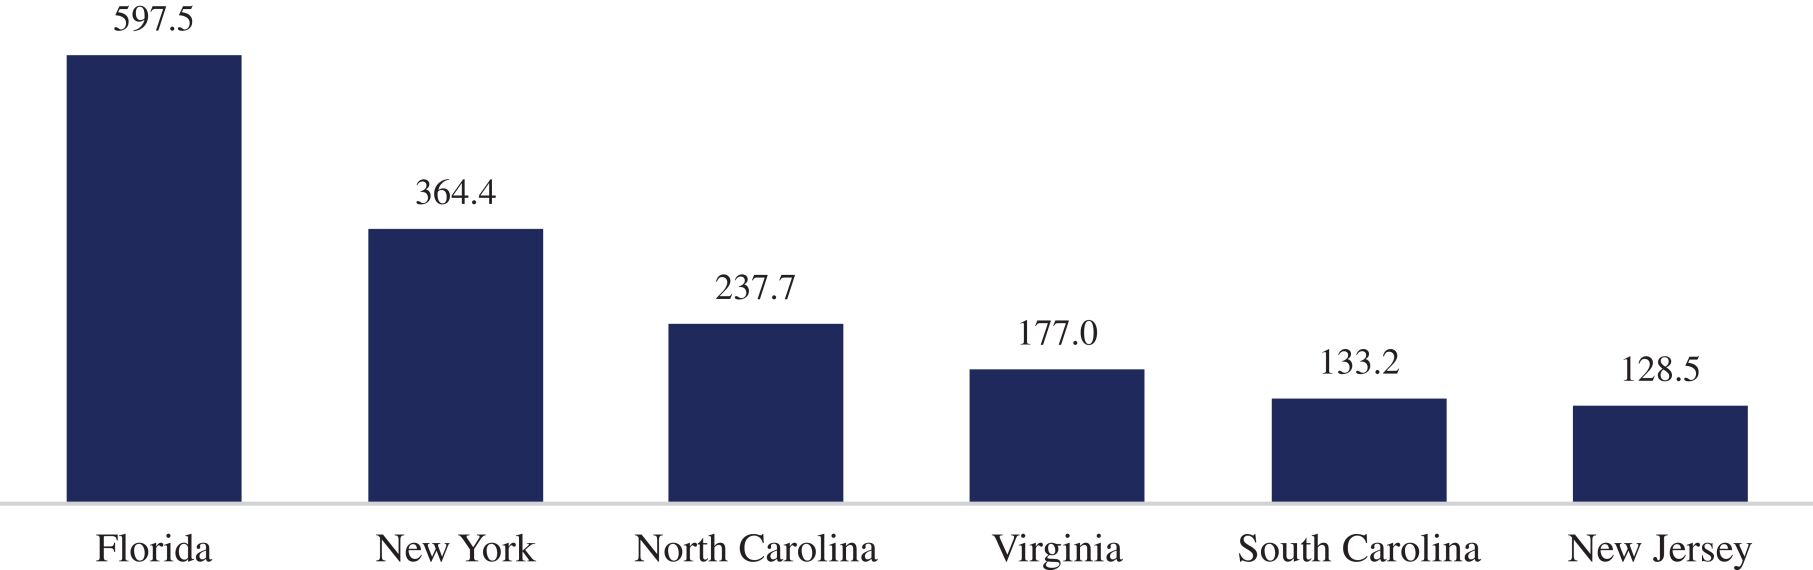
Source: Dodge Data & Analytics Annual Construction Put-in-Place Value Estimates
Population growth and domestic migration are key drivers for demand in residential construction and transportation infrastructure spending.
For the six key states in which we operate, population growth is expected to grow at the same rate as the U.S. average. The six key states in which we operate are expected to have an average population growth of approximately 0.7% compared to the U.S. average of approximately 0.7% from 2024 to 2029 according to the CDC State Population Projection database.
Estimated Population Growth CAGR (2024-2029)
| ('000's) |
2014 | 2024 | 2025 | 2026 | 2027 | 2028 | 2029 | CAGR 2014-2024 |
CAGR 2024-2029 |
|||||||||||||||||||||||||||
| Florida |
20,794 | 25,383 | 25,912 | 26,450 | 26,996 | 27,550 | 28,113 | 2.0 | % | 2.1 | % | |||||||||||||||||||||||||
| New Jersey |
9,210 | 9,603 | 9,637 | 9,670 | 9,703 | 9,736 | 9,769 | 0.4 | % | 0.3 | % | |||||||||||||||||||||||||
| New York |
19,531 | 19,552 | 19,540 | 19,528 | 19,516 | 19,503 | 19,490 | 0.0 | % | -0.1 | % | |||||||||||||||||||||||||
| North Carolina |
9,875 | 11,298 | 11,449 | 11,602 | 11,756 | 11,912 | 12,069 | 1.04 | % | 1.3 | % | |||||||||||||||||||||||||
| South Carolina |
4,604 | 4,957 | 4,990 | 5,022 | 5,054 | 5,086 | 5,117 | 0.7 | % | 0.6 | % | |||||||||||||||||||||||||
| Virginia |
8,376 | 9,275 | 9,364 | 9,455 | 9,546 | 9,638 | 9,731 | 1.0 | % | 1.0 | % | |||||||||||||||||||||||||
|
|
|
|
|
|
|
|
|
|
|
|
|
|
|
|
|
|
|
|||||||||||||||||||
| Total TA Markets |
72,391 | 80,068 | 80,892 | 81,727 | 82,571 | 83,425 | 84,290 | 1.0 | % | 1.0 | % | |||||||||||||||||||||||||
|
|
|
|
|
|
|
|
|
|
|
|
|
|
|
|
|
|
|
|||||||||||||||||||
| Total United States |
319,668 | 346,669 | 349,439 | 352,229 | 355,035 | 357,862 | 360,711 | 0.8 | % | 0.8 | % | |||||||||||||||||||||||||
|
|
|
|
|
|
|
|
|
|
|
|
|
|
|
|
|
|
|
|||||||||||||||||||
Source: CDC State Population Projection database
127
Table of Contents
Company Introduction
Titan America is a leading vertically integrated, multi-regional manufacturer and supplier of heavy building materials and services operating primarily on the Eastern Seaboard. We have built what we believe is a unique and differentiated building materials platform in the markets we serve. Today, our manufacturing, logistics and customer support capabilities span across critical building materials and products, including cement and SCMs, aggregates, ready-mix concrete, concrete block and other ancillary products. Additionally, we believe that our market leadership in lower carbon cement and green concrete solutions positions us to benefit from growing demand for building materials that contribute to lower carbon emissions. We believe our vertically integrated business model and continued investment in our extensive logistical capabilities have enabled us to grow with our diverse customer base across infrastructure, residential and non-residential end markets. By leveraging these competitive advantages across our two reportable segments, the Mid-Atlantic and Florida, we believe that we are in a strong position to drive meaningful growth and enhanced profitability into the future.
We are a leading provider of heavy building materials in Florida and the Mid-Atlantic. We serve markets that benefit from population growth, economic growth and technology and innovation trends that are among the strongest in the United States. We are also a leading provider of building materials that contribute to lower carbon emissions than traditional building materials and/or beneficial reuse of waste materials. We have installed our own state-of-the art alternative fuel processing facility that converts waste to fuel, and we have earned TRUE Platinum Zero Waste certification, the highest ranking, in the United States for cement, as awarded by the TRUE Zero Waste certification program. Our emissions have been reduced by our improved efficiencies, and we have achieved the ISO 50001 energy certification. Further, we have achieved the EPA Energy Star award each year for the past 17 years for the Roanoke Plant and the past 16 years for the Pennsuco plant. According to PCA rankings, our Roanoke Plant and Pennsuco plant are among the top five performers by thermal efficiency.
Our executive management team has led Titan America to experience growth in scale, product portfolio and geographic footprint. This growth was driven by our management teams targeted investment strategy, which has enhanced production capacity and strengthened distribution and logistics capabilities in high-growth markets. These efforts include expanding cement and SCM storage, scaling import capacity and leveraging digital investments to optimize logistics execution and boost asset reliability across our vertically integrated operations. Between fiscal years 2013 and 2023, we have grown our sales from $539 million to approximately $1.6 billion (an 11% CAGR), our net income went from a loss of $65.4 million to a positive $155.2 million and our Adjusted EBITDA increased from $36 million to $328 million (a 25% CAGR) while our net income margin has grown from negative 12% to positive 10% during that same period.
As a result of our continuous investment program to modernize and scale our operations, we have experienced 50% revenue growth, 150% net income growth and 65% Adjusted EBITDA growth from fiscal 2019 to fiscal 2023. Additionally, we have reduced our cement operations CO2 emissions per metric ton of cementitious materials by 18%, from 718 kg of net CO2 per metric ton in 2019 to 587 kg of net CO2 per metric ton in 2023.
Our scaled, vertically integrated network of more than 100 facilities includes some of the largest cement plants, import terminals, mines, ready-mix concrete plants, fly ash processing plants and concrete block production lines in our core markets. Our cement plants are capable of producing approximately 3.8 million tons of cement annually, over 95% of which is Lower-Carbon Cement. Our cement manufacturing activities are supported by a network of mining operations containing a total of 474 million tons of reserves as of May 1, 2024, which we are in the process of expanding through various opportunities.
128
Table of Contents
The following charts present a summary of revenue, net income, Adjusted EBITDA(1)(2) and Capital Expenditures(1)(3) for the fiscal years ended December 31, 2023, 2022 and 2021 and the nine months ended September 30, 2024 and 2023:

| (1) | After the Contribution of Titan Atlantic to Titan America SA, on January 1, 2025, Titan America LLC divested its STET segment in a sale for cash, to be settled no later than January 31, 2025, to Titan Cement Netherlands B.V., a wholly-owned subsidiary of Titan Cement International, which is outside the scope of this offering. |
| (2) | Adjusted EBITDA is a non-IFRS financial measure we use to evaluate the performance of our business. For the definition of this measure, see Managements Discussion and Analysis of Financial Condition and Results of OperationsNon-IFRS Measures. |
| (3) | Capital Expenditures includes investments in property, plant and equipment and investments in identifiable intangible assets. |
In the fiscal year ended December 31, 2023, Titan America delivered $1.6 billion of revenue, net income of $155.2 million and Adjusted EBITDA of $328.4 million. In the nine months ended September 30, 2024, Titan America delivered $1.2 billion of revenue, net income of $129.5 million and Adjusted EBITDA of $286.9 million. Titan America also delivered 6% of revenue growth for the last twelve months ended September 30, 2024.
129
Table of Contents
Since our initial investment in the Essex Cement import terminal in Metro New York in 1989, we believe we have built one of the most comprehensive, capable and reliable building materials platforms on the Eastern Seaboard through focused and strategic investments.
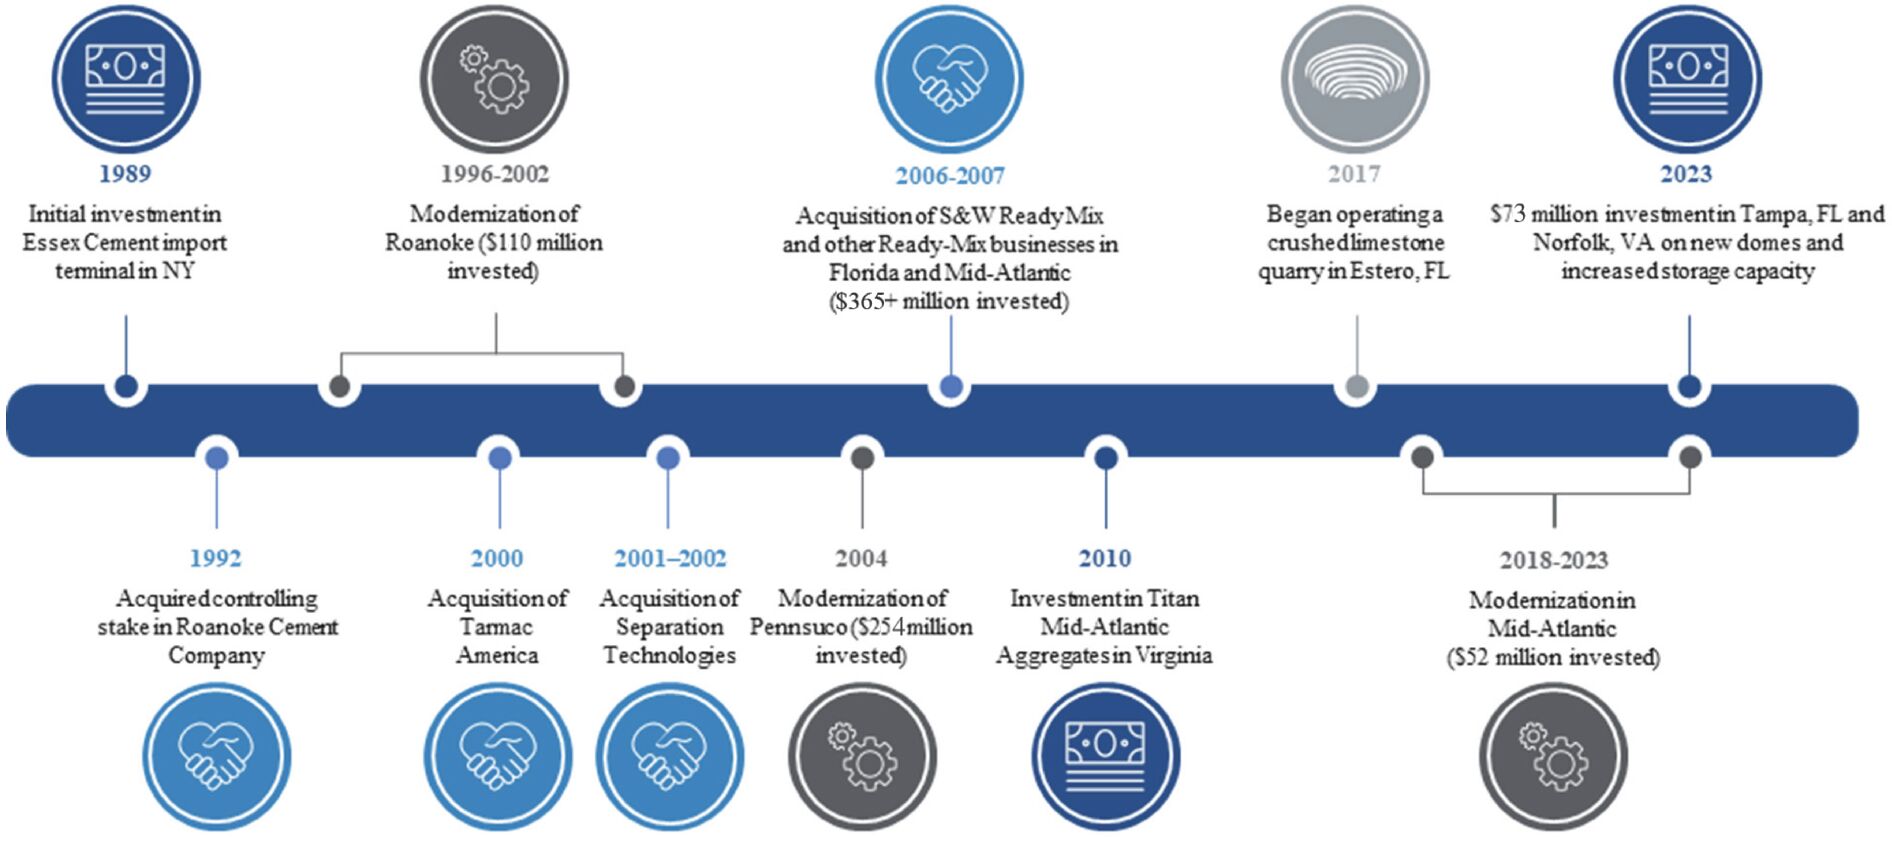
In 1992, we acquired 59% of Roanoke Cement Company and all its related assets, establishing our domestic manufacturing and regional distribution capabilities in the Mid-Atlantic region through the addition of our Roanoke Plant, our Norfolk Terminal and a rail-connected distribution network in Virginia and North Carolina.
Between 1996 and 2002, we invested $110 million in our Roanoke Plant, which included a major modernization of its clinker and cement production process, as well as the addition of a preheater/precalciner, a new clinker cooler, new clinker silos, a new finish mill and a new packaged cement line.
In 2000, we acquired Tarmac America Inc., including the remaining 41% of Roanoke Cement Company, giving us initial positions in ready-mix concrete and block operations across the State of Florida, as well as our Pennsuco facility that produces cement, aggregates, ready-mix concrete and concrete block.
In 2002, we acquired Separation Technologies, a market leader in fly ash beneficiation and marketing. Throughout the early 2000s, we made significant investments to expand and improve the logistics and import capabilities of the business establishing a cement import terminal at the Port Tampa Bay, Florida, and modernizing our Essex Terminal.
Between 2001 and 2006, we invested approximately $254 million in our Pennsuco plant, which included modernization efforts with the commissioning of a state-of-the-art clinker production line, significantly increasing clinker production capacity at much lower energy consumption rates, and the addition of a new finish mill and a new packaging operation.
Between 2006 and 2007, we invested approximately $365 million to significantly expand our ready-mix footprint through the acquisition of S&W Ready Mix, which operated 26 concrete plants in the Carolinas, the Mechanicsville Concrete Company and five plants under the Powhatan Ready Mix brand in and around Richmond, Virginia. We also completed acquisitions of three ready-mix businesses on the west coast of Florida, including nine concrete plants located in and between Tampa and Fort Myers. In addition to these acquisitions, we installed 11 greenfield ready-mix concrete plants and one block production line throughout our territory which expanded our geographic footprint and improved density of delivery and manufacturing capacity in growing markets.
In early 2010, we invested in a sand mine in Sussex County, Virginia, followed by commencing our Castle Sands Operation in 2011 and Branchville, Virginia in 2019.
130
Table of Contents
From 2014 to 2023, we invested $53 million in an overland conveyor and two new draglines at the Pennsuco quarry.
In 2017, we entered into a long-term mining royalty agreement and began operating a crushed limestone quarry in Estero, Florida, near Fort Myers. We upgraded the operations by installing a dragline and mobile mining fleet, as well as expanding the existing permit to substantially increase the base of reserves, all of which provide a stable source of aggregates for both external sale and internal consumption.
Between 2018 and 2023, we invested $52 million in modernizing our logistics network in the Mid-Atlantic, including (i) investments in increasing silo storage capacity and installation of an automated loadout system at our Roanoke Plant, (ii) expansion of the Winston-Salem, Charlotte, Selma and Wilmington rail terminals to allow for multiple products, optimized storage and distribution capabilities and (iii) installation of a hybrid loadout system at the Norfolk Terminal capable of loading both trucks and rail cars.
In 2023, we completed a $73 million investment at our Port Tampa Bay Terminal and our Norfolk Terminal, constructing new domes, adding multi-product storage capacity of approximately 70,000 tons each, as well as on other repairs and refurbishments.
Governmental Regulations
Our U.S. operations are subject to extensive EHS laws and regulations in the jurisdictions in which we operate. These regulations cover among other things, land use, permitting, remediation, mine reclamation, operation and closure of landfills, air emissions, the generation, transportation and disposal of solid waste and hazardous substances, contamination, water quality, wastewater discharge, and other environmental considerations, as well as mine safety and occupational and community health and safety. Environmental laws and regulations may require us to install pollution control equipment at our facilities, clean up spills and other contamination and correct environmental hazards, including payment of all or part of the cost to remediate sites where our past activities, or the activities of other parties, caused environmental contamination. Liability may also arise through the acquisition or ownership or operation of properties and businesses, especially properties or operations where hazardous materials were used historically. We work to ensure our material handling practices meet industry standards and legal requirements, ensuring employee safety from hazardous materials.
Additionally, our operations require numerous governmental environmental, mining and/or other approvals and permits. Environmental operating permits are subject to modification, renewal and revocation and can require us to make capital, maintenance and operational expenditures to comply with the applicable requirements. We operate our facilities subject to permits and licenses governing, among other things, the discharge of pollutants into air and water and the generation, transportation and disposal of solid waste and hazardous substances, obtained from federal, state and local authorities in the jurisdictions where such facilities are located. For example, our Roanoke Plant operates under various permits issued by the USACE, the Commonwealth of Virginia, and Botetourt County, VA. Our Pennsuco plant operates under permits issued by the USACE, the State of Florida and Miami-Dade County, FL. We work to ensure we remain in substantial compliance with the permitting requirements that are material to the operation of our business.
Our U.S. operations must comply with federal climate laws and regulations. The EPAs regulations target GHG emissions from industrial sources identified by the EPA as large GHG emission sources, including cement manufacturing. Since December 29, 2009, the EPAs Mandatory Reporting of GHGs Rule requires certain industrial sectors exceeding certain emission thresholds to report their GHG emissions annually. In 2010, the EPA set GHG thresholds for the New Source Review PSD and Title V Operating Permit programs for facilities with emissions above certain thresholds. Cement plants must obtain these permits if they exceed the limits, and new major sources or significant modifications at major sources must secure pre-construction permits that include pollution limits based on BACT. Applying for, complying with, reporting under, renewing and maintaining these permits can involve significant costs and delays. Future GHG regulations could materially impact U.S. operations and the cement industrys financial condition.
131
Table of Contents
Key Recent Investments and Initiatives
Recent investments we have made seek to capitalize on dynamic growth themes in the U.S. economy, including decarbonization, circular economy, resilient urbanization, infrastructure modernization, refurbishment and renovation, new construction technologies and high-performance products. We believe these initiatives contribute to and will act as significant drivers of growth.
Decarbonization
We are actively pursuing decarbonization by leveraging new technologies and high-performance products. The direct CO2 emissions related to cement production originate primarily from the sintering of raw materials (primarily limestone) and the fuel combustion necessary to produce clinker, which is the main component of cement. We have been focusing on reducing the CO2 emissions related to clinker production by utilizing higher amounts of alternative fuels and natural gas in our kilns. In addition, we are actively pursuing government funds to explore and develop new technologies like indirect calcination and carbon capture and sequestration to further reduce the carbon footprint of our clinker.
We have developed new cement types requiring less carbon intensive inputs that perform equally or better than conventional cements, resulting in lower CO2 content of the final product. We have replaced over 95% of our OPC with Lower-Carbon Cement, improving the CO2 emissions per ton of product by up to 10% compared to OPC. We are currently investing in the development of our Type IT cement (a ternary cement blend) that requires even less amount of clinker while delivering equal or better performance than Lower-Carbon Cement. Depending on the type of SCM used (such as fly ash, slag, calcined clay or natural pozzolans) the total reduction in clinker quantity can reach up to 50% compared to OPC cements, resulting in a significant reduction of the CO2 emissions per ton of product.
Utilizing greener cement types such as Type IL and Type IT, developing new concrete formulations (such as GreenCrete®) and deploying AI/ML solutions to improve the batching accuracy and the quality control of our ready-mix process will further reduce the overall carbon footprint in our concrete products, supporting our commitment of net-zero GHG emissions by 2050.
Our investments in recycled aggregates further support our commitment to sustainable construction practices. Our investment in the production of calcined clay will offer our Roanoke cement operation the ability to produce a high performing Type IT cement with locally-sourced raw materials. Also, the use of natural pozzolans at our plants as the main ingredient of Type IT cement is part of our broader strategy to enhance our product offerings and meet the increasing demand for sustainable construction materials.
Cement manufacturing requires significant amounts of fuel to generate the right temperatures for the raw materials inside the kilns different physical and chemical transformations. By looking into ways of reducing the use of fossil fuels that contribute to the cement carbon footprint, we developed our alternative fuels program, which takes different non-hazardous waste streams from a wide array of sources, industries and economic sectors and transforms them into fuel for our manufacturing facilities, reducing a portion of the need for fossil fuels and raw materials, while providing an environmentally and economically sound alternative to landfills and reducing our net emissions of GHGs.
Our alternative fuels program is a zero-waste solution, as no residue or combustion byproduct is generated. The clinker manufacturing process, which involves high temperatures (up to 3,600° F), high turbulence and long residence times in the kiln, facilitates the nearly complete destruction of any harmful chemical compounds emitted by the clinkering process, which is continuously monitored by certified emission monitoring systems according to federal and state regulations.
Our cement plants are permitted to utilize a variety of fuels such as coal, pet coke, natural gas, used oil, biomass and waste-derived fuels, which allows us to flex to the optimal fuel source, achieving the lowest cost and/or CO2 emissions.
132
Table of Contents
We recently invested $14 million to build an alternative fuel processing and production facility at our Pennsuco plant, utilizing commercial and industrial waste streams to manufacture our alternative fuels. Pennsuco is the only cement plant in Florida as of July 31, 2024 to have a solid waste processing permit, allowing for true, vertically-integrated alternative fuel production capabilities. Additionally, the Roanoke Plant can feed multiple solid alternative fuels with technical capabilities able to reach up to 30% thermal substitution rate, depending on the quality of the fuels.
Since 2019, our decarbonization efforts have led to an almost 20% reduction in CO2 emissions intensity, from 718 kg of net CO2/metric ton cementitious in 2019 to 587 kg/mt at the end of 2023. Net CO2 emissions exclude all CO2 generated from the combustion of alternative fuels since they are treated as carbon neutral. Utilization of alternative fuels results in indirect GHG (not only CO2) savings at landfills and incineration plants where these wastes may otherwise be disposed of. When such waste streams decompose at the landfills, more of the organic carbon will partially convert to methane which is 28 times more potent than CO2 for heat trapping. These savings can partly, fully or more than fully offset the direct CO2 emissions from waste combustion at the cement plant, so they are excluded in the reporting of the net CO2 emissions according to reporting guidelines adopted by the Global Cement Concrete Association in 2018.
Circular Economy
To promote a circular economy, we focus on recycling and reusing materials. Our recycled aggregates and crushed concrete initiatives involve converting waste materials into valuable construction resources, thereby reducing the need for virgin raw materials. Our use of alternative fuels showcases our innovative methods to repurpose industrial byproducts. 10% to 15% of the raw materials used for clinker and cement production are byproducts of other industrial processes.
Resilient Urbanization
We contribute to resilient urbanization by developing products and solutions designed for urban environments facing the effects of climate change. The inherent strength and durability of concrete construction enable communities to mitigate damage and recover faster from extreme weather. As more communities invest in infrastructure to combat the effects of extreme weather and sea-level rise, concrete is expected to be a material of choice for critical infrastructure. Our high-durability products, including marine and underwater concrete, are designed to survive harsh conditions. Our products contribute to extended service life of critical infrastructure in even the harshest conditions in our markets, increasing the availability and reducing the need for maintenance and repairs.
Infrastructure Modernization
Infrastructure modernization is at the core of our strategy, with significant investments in advanced materials and technologies. Our investments in pre-cast technologies and mobile ready-mix concrete plants are designed to meet the increasing demands for modern infrastructure. These initiatives are designed to ensure the timely and efficient delivery of high-quality construction materials for new roads, bridges and public facilities.
Home Refurbishment and Renovation
We support the large and growing home refurbishment and renovation market with a variety of products that allow contractors and homeowners to refresh the exteriors of their existing buildings with high-quality and high-performance materials.
The exterior home renovation market is projected to reach nearly $600 billion annually by 2027, an increase from $322.8 billion in 2014, driven by an aging housing inventory which contributes to growing demand for high-quality, durable and aesthetically pleasing materials. Recognizing this trend, we provide a variety of products tailored for the refurbishment and renovation market, including block, stucco, paver and mortar offerings. Further, we are exploring an expansion of our product line to include precast lintels and sillskey structural elements that enhance both the functionality and appearance of residential properties.
133
Table of Contents
In addition to our core refurbishment and repair product offerings, we are also exploring expansion into other critical areas of exterior home renovation, with the goal of ensuring that our product portfolio is comprehensive and caters to the diverse needs of our customer base.
New Construction Technologies
We are at the forefront of the implementation and commercialization of new construction technologies, particularly with our 3D printing initiatives. Our partnerships with 1Print and Natrx for the production and development of high-performance concrete utilizing our proprietary 3D mortar formulations exemplify our commitment to innovation. These technologies enable more efficient and precise construction methods, reducing waste and enhancing structural integrity. Additionally, our extended joint-spacing concrete technology provides durable flooring solutions, crucial for modernizing warehouses and distribution centers, enhancing their longevity and performance while also allowing for the implementation of automation technology.
High-Performance Products
Our portfolio includes high-performance concrete and cementitious products tailored to meet increasingly demanding construction needs for infrastructure and commercial markets. High-strength and high-modulus elasticity concretes are designed for increasingly tall and slender high-rise buildings in major urban markets. High-durability concretes are developed for projects requiring extended service life in extreme conditions, including landmark tunnels and bridges. These products include marine and underwater concretes designed for saltwater exposure. Our GreenCrete® product line provides independently validated less carbon-intensive concrete mixtures (based on third-party measurements of embodied CO2 content relative to industry benchmark specifications) while enhancing performance across all applications. Our lower carbon and high performing cements and supplementary cementitious materials are critical to enable these concrete mixes. We believe that our high-performance products not only enhance the quality of construction but also support sustainable and resilient development.
Digital Transformation
We are also committed to digital transformation. We are early adopters of AI/ML technologies in our industry, which we employ to increase plant reliability and capacity utilization, improve product quality, proactively manage operating and maintenance costs and improve energy efficiency. These initiatives place our cement plants in the top five most efficient in the U.S. cement industry out of companies participating in a 2022 PCA survey.
We created a Digital Center of Excellence in 2022, which has driven digital transformation across our entire supply chain and fostered continuous improvement and fine-tuning of existing industrial AI/ML solutions, as well as the development and implementation of similar solutions in our commercial and logistics activities. With our cement manufacturing plants fully end-to-end digitalized, we recently implemented a new-to-market dynamic logistics and decision support system based on real-time data analytics and optimization algorithms that improve customer service and reduce logistics costs. This sophisticated AI/ML application provides optimum planning and scheduling of product deliveries, taking into consideration disruptions related to weather and/or real-time traffic events. Our Digital Center of Excellence is also testing and exploring new technologies, including robotics, drones, autonomous vehicles, remote-operated mining equipment and other cutting-edge technology.
This digital transformation strategy allows us to connect our logistics network further downstream, helping us better serve our customers. A recently developed and deployed AI/ML solution that allows for real-time optimization of the logistics and distribution of our ready-mix concrete products and has shown positive results and productivity improvements for our Florida ready-mix business. It will soon be deployed in the Mid-Atlantic.
Our investments in state-of-the-art operations and process control systems have also resulted in the deployment of predictive maintenance systems, based on data analytics for equipment faults and process anomaly detection to improve the reliability of our operations and predictive quality analytics that improve product quality and consistency.
134
Table of Contents
Separation Technologies and SCMs
Recognizing the need for continued, proprietary investment in more eco-friendly and green concrete alternatives to traditional cement, we acquired a controlling stake in ST in 2002. ST is a market leader in fly ash beneficiation and marketing, replacing certain inputs in the cement and concrete manufacturing processes with an industrial waste stream that would otherwise be landfilled, significantly improving the green attributes of our products.
STs proprietary fly ash beneficiation process is a proven technology that produces fly ash, an almost-zero CO2 specification grade SCM, that can be used as an additive in novel blended cements or as a partial replacement for cement in ready-mix concrete. Fly ash is the by-product of coal combustion for the generation of electricity from power plants. Since all of the CO2 emitted during the electricity generation is accounted for at the power plant, the fly ash produced does not result in any independent CO2 separate from the coal combustion. STs proprietary technology uses an electrostatic process to remove any excess unburnt carbon in the fly ash, making it usable for concrete production. This process results in zero direct CO2 emissions because it does not involve any fuel combustion. However, in certain cases where power plants utilize ammonia for their environmental controls, the resulting fly ash requires further processing with a proprietary ammonia removal process also developed by ST. This process requires combustion of natural gas which emits low amounts of CO2; thus, the almost-zero CO2 footprint of this material. Similarly, if the source of fly ash is from landfill and pond impoundments, it will require drying through combustion of fuels (usually natural gas) prior to electrostatic processing, which results in low amounts of CO2 emissions. Overall, when compared to cement, the resulting CO2 footprint of processed fly ash is significantly lower and helps improve the overall carbon footprint of concrete when used as a cement substitute.
Complementing the proprietary fly ash beneficiation technology are other processes ST has developed for the re-burn and reuse of unburned coal. Electrostatic separation of unburnt carbon from the processed fly ash results in the production of a higher-carbon content material trademarked as EcoThermTM. This material can be returned to the utility for reburn, substituting part of the coal used for electricity generation or used as an additive for clinker production, replacing a small portion of raw materials and fuel needed for this process. In addition to STs processed ash facilities, we have additional locations under contract with electric utilities for the sale and marketing of other lower carbon, concrete-grade fly ash in Florida, Maryland, Pennsylvania, Indiana, Ohio and West Virginia.
Additionally, the ST technology has been adapted to produce specification-grade SCM from fly ash that has been disposed of in landfill and pond impoundments. The deployment of the ST technology in the reclamation of ash landfills will be driven not only by those cement companies seeking to develop long-term reserves of SCMs to achieve their decarbonization goals, but also by electric utilities seeking to remediate these ash impoundments to comply with regulatory or stakeholder pressure. This push by electric utilities to remediate ash disposal impoundments is a growing trend driven by recently promulgated U.S. EPA coal combustion residual rules, state-level mandates and shareholder and non-governmental organization pressure.
The development of projects using STs proprietary technology with third parties is led by the STET segment. Prior to this offering, Titan America LLC divested the STET segment in a sale for cash, to be settled no later than January 31, 2025, to Titan Cement Netherlands B.V., a wholly-owned subsidiary of Titan Cement International, which is outside the scope of this offering. Prior to the divestiture, the intellectual property associated with the proprietary technology that resided within ST was transferred from ST to ST Equipment & Technology LLC, a legal entity within the STET segment. ST will continue to operate fly ash processing plants and market fly ash and will also continue to pursue growth opportunities. Where either legacy operations or new growth opportunities are required, ST will enter into agreements with ST Equipment & Technology LLC (or successor) to license and use the proprietary technology and these agreements may include ST paying lump sum payments for the purchase of the proprietary equipment as well as ongoing fees for licensing and technical support. See Certain Relationships and Related Party TransactionsSTET Licensing Agreements.
Our Reportable Segments
Due to the regional nature of our business, we report our operating results in two reportable segments: Florida and Mid-Atlantic. We run our operations nimbly allowing us to pivot resources to markets we support with the greatest demand based on market conditions.
135
Table of Contents
The following charts show revenue by segment for the fiscal year 2023 and the nine months ended September 30, 2024:
|
|
|
| (1) | Represents the revenue associated with the STET segment. The STET segment is a nonreportable operating segment that develops, manufactures, sells and services triboelectrostatic separators and related equipment used to beneficiate fly ash, industrial minerals, and food and feed organics. After the Contribution of Titan Atlantic to Titan America, on January 1, 2025, Titan America LLC divested the STET segment in a sale for cash, to be settled no later than January 31, 2025, to Titan Cement Netherlands B.V., a wholly owned subsidiary of Titan Cement International, which is outside the scope of this offering. |
Florida Reportable Segment
Our Florida reportable segment consists of our cement, aggregates, ready-mix concrete, concrete block and fly ash operations within the State of Florida. We currently operate one cement plant, three mines, 40 ready-mix locations with 45 batch plants, eight concrete block locations with 13 production lines, two fly ash facilities and one multi-product marine import terminal along with related logistics infrastructure.
In fiscal year 2023, our Florida reportable segment generated $969.9 million in segment external revenue and $221.2 million in segment adjusted EBITDA, an increase of $161.4 million in segment external revenue and $90.7 million in segment adjusted EBITDA compared to fiscal year 2022. In the nine months ended September 30, 2024, our Florida reportable segment generated $762.4 million in segment external revenue and $197.0 million in segment adjusted EBITDA, an increase of $33.1 million in segment external revenue and $37.2 million in segment adjusted EBITDA compared to the nine months ended September 30, 2023.
Cement Operations
Our Florida reportable segment operates our Pennsuco plant in Medley, Florida, which is the largest cement plant in the State of Florida by capacity, according to the 2024 North American Cement Directory (SEMCO Publishing, 2024). Our Pennsuco plant currently has a cement production capacity of 2.4 million tons, which, through ongoing focused and strategic investments, we expect will increase to over 3.0 million tons by 2030. 100% of our Pennsuco facilitys production is Lower-Carbon Cement.
Our Pennsuco plant has a cement storage capacity of approximately 72,000 tons across 12 silos. Additionally, the plant offers approximately 67,350 tons of clinker storage capacity across 10 silos. Ongoing investments that are planned for completion in fiscal year 2026 are expected to add 30,000 tons of clinker storage capacity. Our logistics capabilities are underpinned by 21,000 feet of high-capacity rail lines with a direct connection to the FEC railway and truck loadout capacity with four loadout bays operating 24 hours, seven days a week. An on-site packaging facility at Pennsuco, commissioned in 2005, supports our position as the number one producer and marketer of packaged masonry and stucco cement in Florida according to USGS data and our production of packaged masonry and stucco cement in Florida.
136
Table of Contents
We invested $14 million in an alternative fuel processing facility at Pennsuco that can produce a consistent heat value fuel for its kiln by processing and blending commercial and industrial waste. We have secured multi-year contracts to supply feedstock streams. This alternative fuel facility was commissioned in late 2019. The Pennsuco plant has the proper infrastructure and is permitted to receive, process and utilize several different conventional fuels and alternative fuels.
Our investment in rail-served cement capacity has resulted in two additional terminals in Edgewater and Jacksonville, Florida, allowing for cost-effective transportation and distribution of our products throughout the FEC.
To efficiently and effectively provide cement products to the Gulf Coast and central regions of Florida, we have invested in building out intermodal logistics capabilities at our Port Tampa Bay Terminal. The import facility includes five recently refurbished silos and a dome with approximately 70,000 tons of capacity that was commissioned in July 2023. These improvements allow us the capability to handle multiple products with a total storage capacity of approximately 120,000 tons of cement and cementitious materials.
Our Port Tampa Bay Terminal can receive 75,000-ton vessels, providing cost effective import capabilities into the Florida market where barriers to entry are high and opportunities for import terminals within the state are few. 100% of the grey cement imported to our Port Tampa Bay Terminal is Lower-Carbon Cement. Our Port Tampa Bay Terminals strategic location in Tampa, along with the rail capabilities, allow us to effectively service the entire peninsula of Florida. With our Port Tampa Bay Terminals multi-product capabilities, including IL and SCMs, we are able to service the entire Florida peninsula. Our Port Tampa Bay Terminal includes three truck loadouts and a rail loadout on the CSX rail line. We are also permitted and able to import, store and ship over 700,000 tons of aggregates per year at our Port Tampa Bay Terminal. Our Port Tampa Bay Terminal has also averaged over 650,000 tons of imported cement annually over the last three years, with an ability to manage approximately 2.5 million tons of cement annually.
Aggregates
Our aggregate operations include three mining locations with eight rail terminals as of September 30, 2024. Our Pennsuco aggregate operation is one of the largest quarries in Florida and is adjacent to our Pennsuco cement plant. Situated on the FEC rail line allows us to supply PNS aggregate from Miami-Dade County all the way to Jacksonville utilizing our network of terminals. The hard limestone rock requires drilling and blasting before excavation. Our three large mining draglines provide significant excavation capacity.
The mobile equipment fleet utilized in our aggregates operations includes four 19 cubic yard loaders and eight 100-ton haul trucks. Following an investment of $12.8 million in 2016, the primary crushing is now completed on-site at the Pennsuco quarry, thereby reducing traditional haul distances and minimizing mobile equipment required in favor of an extensive 3.5-mile electrified overland conveyor system connecting the mining operations with the cement and aggregate plants. The processing plant receives run-of-mine aggregates and produces both finished and fractionated products for blending rail shipments or special orders. The aggregate loadout includes truck and rail loading with a rail-loading capacity of 97 railcars per day and the ability to store more than 200 railcars on site. The Pennsuco rail yard is served by the FEC railroad, providing access to the network of terminals and aggregate distribution yards along the FEC.
Ready-Mix Concrete
The Florida ready-mix business includes 45 batching units at 40 locations servicing the entire peninsula of Florida, capable of handling multiple cements and SCMs and producing a broad array of high-performing concrete mixes suitable for complex construction applications. Additional investment is underway to include additional batching units with the goal of expanding our footprint.
We also provide our customers with portable ready-mix plant capabilities for large projects, such as the ones associated with the IIJA and other large projects requiring high-volume and flexible delivery. Additionally, we support our customers in adopting and integrating new products developed us through our innovation and product quality function, as well as optimizing their mix designs and production processes.
137
Table of Contents
Our ready-mix business is fully back-integrated, with access to a strategically-located and reliable supply of primary raw materials, mainly cement and aggregate needed for concrete production.
Block
Our block business includes both retail and business-to-business channels. The 13 flexible production units are strategically located throughout our markets to support 266 retail home improvement stores and key masonry contractors. The Pennsuco facility, with four production units, we believe is the largest single-block plant in Florida by production capacity as of September 30, 2024, capable of producing over 20 million blocks annually. Each location produces both standard and specialty block, maintaining a mix of products in stock to reduce transportation costs and customer response time. The manufacturing process involves utilizing our nearest distribution locations for aggregates and cement. Additional growth investments include two new production facilities currently under development.
Fly Ash
We utilize fly ash in our cement and ready-mix manufacturing, which is partly supplied from two processing plants operated by ST (TECO and Crystal River). Our TECO facility has access to STETs proprietary electrostatic technology and ammonia removal technology. These systems serve to assure concrete-grade fly ash quality regardless of the quality generated from the power plant. Additionally, the TECO facility has 30,000 tons of feed storage and 16,000 tons of final product storage capacity to partially mitigate some of the vagaries in ash generation by the power plant. Our Crystal River ash source attains product specification without processing and is interchangeable with ash sourced from our TECO facility.
We also import fly ash through the Port Tampa Bay facility to supply external customers and internal needs.
Mid-Atlantic Reportable Segment
Our Mid-Atlantic reportable segment consists of our cement, aggregates, ready-mix concrete and fly ash operations throughout the Mid-Atlantic region, most concentrated in Virginia, North Carolina, South Carolina, New York and New Jersey, capable of serving surrounding states such as Maryland, West Virginia, Kentucky, Tennessee, Pennsylvania, Ohio and Indiana areas with fly ash. We currently operate one cement plant, four mines, 42 ready-mix locations with 47 batch plants, along with related logistics infrastructure and import terminals.
In fiscal year 2023, our Mid-Atlantic reportable segment generated $619.7 million in segment external revenue and $118.3 million in segment adjusted EBITDA, an increase of $66.4 million in segment external revenue and $45.5 million in segment adjusted EBITDA compared to fiscal year 2022. In the nine months ended September 30, 2024, our Mid-Atlantic reportable segment generated $481.0 million in segment external revenue and $100.5 million in segment adjusted EBITDA, an increase of $19.4 million in segment external revenue and $11.5 million in segment adjusted EBITDA compared to the nine months ended September 30, 2023.
Cement Operations
Our Mid-Atlantic reportable segment operates the only cement plant in the Commonwealth of Virginia, our Roanoke Plant. Our Roanoke Plants current cement production capacity is 1.5 million tons, and investment is underway with the goal of increasing production capacity to 1.8 million tons by 2030.
Our Roanoke Plant maintains high-capacity rail and truck loadout capabilities, with a maximum storage capacity of over 90,000 tons dedicated to cement with 38 silos directly or indirectly connected to the three loadout bays and the packaging operation. We invested over $5.4 million over the last three years to refurbish and restore most of the cement silos in our Roanoke Plant, which increases the rate of transfer from cement silos to loading bays since completion of the upgrade. In addition, our Roanoke Plant has three silos dedicated to clinker storage with a total capacity of 50,000 tons.
The Mid-Atlantic cement operations also include the Norfolk Terminal, with 28,000 tons of silo storage and a new dome with approximately 70,000 tons of capacity that was commissioned in December 2023. Together,
138
Table of Contents
these improvements allow us to handle multiple products with a total storage capacity of nearly 100,000 tons of cement and cementitious materials. Our Norfolk Terminal can receive 55,000-ton vessels and also includes two truck loadouts, a rail loadout and a hybrid truck/rail loadout capable of shipping on either CSX or on the Norfolk Southern rail line.
The Roanoke Plants location also makes it the closest cement plant to key markets in North Carolina. We believe that our proximity to key, growing markets combined with our extensive intermodal logistics capabilities positions us to effectively serve our markets and customers in Virginia, Tennessee, West Virginia, North Carolina and South Carolina.
Our Mid-Atlantic cement operation also operates our Essex Terminal, with a storage capacity of 65,000 tons across a bank of four silos. Our Essex Terminal can receive and unload 55,000-ton vessels and distribute product with three high-capacity automated truck loadouts. Our Essex Terminal averaged over 850,000 tons of cement imports annually over the last three years, effectively serving Metro New York.
Aggregates
We operate three aggregate facilities under the name of Titan Mid-Atlantic Aggregates LLC, strategically located to support our vertical integration model. Our operation in New Castle, Virginia supplies critical minerals to the Roanoke Plant for the manufacture of clinker which assures long-term, secure sourcing and supplies concrete grade masonry and asphalt sand to external ready-mix concrete, fiber board siding and asphalt paving customers. Our Mid-Atlantic aggregates business also includes operations in Sussex County and Branchville, Virginia. These facilities self-supply into our internal ready-mix concrete business providing supply security. All of our aggregate facilities produce concrete, asphalt masonry sands and critical minerals with vertically integrated downstream channels to market through cement and ready-mix.
Ready-Mix Concrete
Our concrete products business in Mid-Atlantic consists of 46 ready-mix batch plants across 42 sites, with 22 plants in Virginia and 24 plants in the Carolinas, each capable of handling multiple cements and SCMs and producing a broad array of high-performing concrete mixes suitable for any type of complex construction application. We also have additional portable ready-mix plant capabilities for large IIJA and other infrastructure projects that require high-volume dedicated and flexible delivery as well as rapid entry into new locations.
Fly Ash
Our Mid-Atlantic fly ash business consists of one of the largest networks of fly ash sources in the Mid-Atlantic, located in Baltimore, Maryland and York Haven, Pennsylvania (both with proprietary electrostatic separation processing systems and a combined 87,000 tons of product storage), Maidsville, West Virginia, Brilliant, Ohio and Clifty Creek, Indiana. These sources provide fly ash that has either been processed through our proprietary technology or meets required ASTM specifications without processing, supply material for both internal use by our concrete businesses as well as direct sales to customers.
Our Competitive Strengths
We believe we are well positioned to capitalize on favorable trends for future growth because of the following competitive strengths:
Leading Market Positions in Several Fast-Growing Economic Mega-Regions of the Eastern Seaboard with Strategically Placed Facilities and Terminals
We are one of the largest suppliers of cement in Florida, Virginia and the Carolinas, and occupy a leading position in Metro New York. Based on cement imports and cement plant capacity divided by the total size of the market as reported by PCA, we occupy 31.3% of the Florida market, 30.0% of the Virginia and the North
139
Table of Contents
Carolina markets and 24.1% of the Metro New York market. This makes us one of the largest suppliers of building materials in three out of the 11 economic mega-regions of the United States, areas that contain multiple metropolitan areas that are densely populated and offer attractive demographics and population growth.
Our cement plants and marine and land terminals are strategically located to increase proximity and shorten transport time to our end customers across our three economic mega-regions. Our network of facilities allows us to maximize logistical efficiency while maintaining a significant geographic reach. For example, our Roanoke Plant combined with our Norfolk Terminal and an extensive logistics network of rail terminals, loadouts and storage facilities, efficiently services our markets and customers in Virginia, Tennessee, West Virginia, South Carolina and North Carolina. In Florida, our Pennsuco facility is the only plant on the FEC rail network serving the east coast of Florida, while our Port Tampa Bay Terminal supports Tampa and the west coast of Florida, one of the fastest growing regions in the country.
Vertically Integrated Business Model Providing Strategic Flexibility and Reliable Production
We believe we have established a vertically integrated business model that allows us to reliably supply our customers with high-quality products. Additionally, our vertical integration gives us visibility into the needs of customers up and down the value chain.
Our vertically integrated manufacturing and distribution network of more than 100 facilities includes two cement plants, three marine import terminals, rail-connected logistics terminals, mines, ready-mix concrete batch plants, block production lines and fly ash processing plants across our core markets. We believe that our extensive, high-capacity logistics network provides flexible and reliable sourcing to help meet the needs of our customers, even in times of market disruptions. Below we have provided a diagram illustrating the vertical integration of our operations and products.
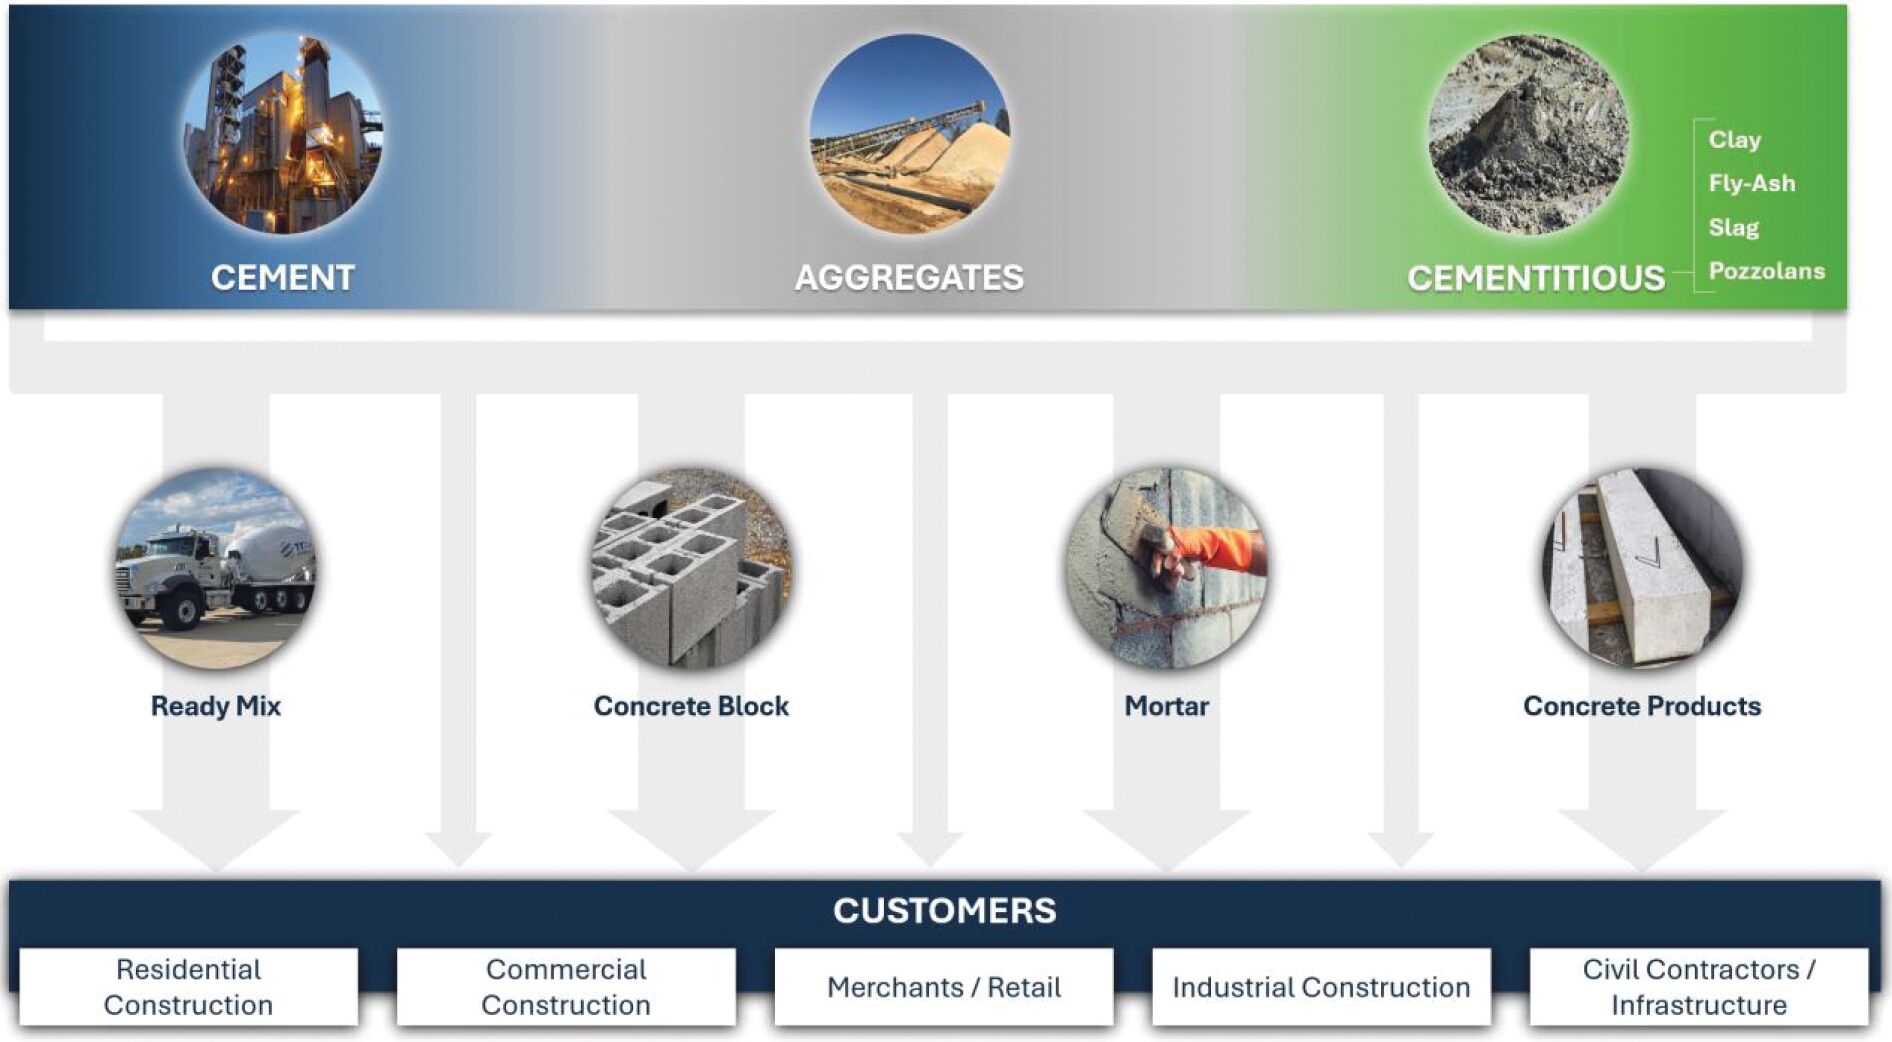
Our vertical integration allows us full control of the quality, availability and supply of raw materials and intermediates for production of consistently high-quality products across the construction value chain, as evidenced by our multiple NRMCA Producer Excellence in Quality Awards. For example, we use our own limestone to produce clinker, cement and aggregates. We leverage our internally-supplied clinker and SCMs to produce our cement, which is then used together with our aggregates to manufacture our concrete products. Our ready-mix concrete and concrete block operations source nearly 100% of their cement inputs from our own internal supply.
140
Table of Contents
We believe our vertically integrated business model helps us establish a strong presence in the market with increased proximity to our customers, providing a 360-degree view of their needs. In addition to providing convenience and communication, it gives us the capability to develop, test and optimize new products for the market. We believe that all of these factors differentiate us in the marketplace and, as a result, positions us for customer retention and growth.
Comprehensive Logistics Network with Strategically Placed Facilities and Terminals
The construction materials sector is a localized industry due to the high cost of transportation of cement, concrete, aggregates and other products. Further, customer job sites operate on extremely time-sensitive workflows and rely on consistent and readily-available supplies of key construction products. Customers can neither rely on, nor can suppliers afford, long supply chains. Reliability and timeliness of supply are critical success factors.
Our production and import facilities and extensive intermodal logistics networks are strategically placed to increase proximity and shorten transport time to our end customers. These networks connect our aggregate sites, import terminals and cement plants to regional markets across the Eastern Seaboard. We believe our network delivers efficiency, flexibility and security of supply for our customers.
Our cement plants and marine and land terminals are strategically located to serve multiple Mega-Regions and growing local markets across the Eastern Seaboard. For example, our Roanoke Plant combined with our Norfolk Terminal and an extensive logistics network of rail terminals, loadouts and storage facilities, efficiently services our markets and customers in Virginia, North Carolina, South Carolina and adjacent markets in Tennessee and West Virginia. In Florida, our Pennsuco facility is the only plant on the FEC rail network serving the east coast of Florida, while our Port Tampa Bay Terminal supports Tampa and the west coast of Florida, one of the fastest growing regions in the country.
The Mid-Atlantic Titan Network
141
Table of Contents
The Florida Titan Network
Intense Focus on Customer Service and Solutions
Through our more than 120 years of industry experience and focus on operational excellence, we believe we have fostered deep customer trust and satisfaction. We have direct access up and down the value chain, and a 360-degree view that allows us to identify emerging market trends and customer preferences and the opportunity to provide tailored, engineered solutions.
Our product development program is centered around driving innovation, productivity, performance and sustainability across our portfolio, with a keen focus on meeting emerging market demands and enhancing our competitive edge. Our initiatives are strategically designed to leverage technological advancements, optimize operational efficiency of our own operations and those of our customers and deliver high-performance, environmentally sustainable solutions to our customers and the broader concrete construction value chain.
We offer several benefits to our customers, including:
| 1. | Quality Products: We are known for our reliable and durable products, that perform well in various construction applications. |
| 2. | Customization: We provide tailored solutions to meet specific project requirements, including specialized blends for different environmental conditions and comprehensive logistics for all product lines to meet demanding project schedules and needs. |
| 3. | Sustainability: We aim to emphasize increasingly eco-friendly practices, offering products with lower carbon footprints and promoting more sustainable construction methods. |
| 4. | Technical Support: Customers benefit from our expert guidance and support throughout the construction process, from product selection to application, including post-sale customer service and support. |
142
Table of Contents
| 5. | Reliable Supply Chain: With strategically located plants and distribution centers, as well as ample product storage capacity at our cement and aggregate operations, concrete product plants, land-based and marine import terminals, we believe we are positioned to deliver a timely and consistent supply of materials that is buffered against supply volatility. We have invested across our logistics network to add storage and expand loadout capacity at our land and marine terminals with the goal of reducing waiting times and increasing our customers logistics efficiency and to increase our product offering. |
| 6. | Innovation: We invest in research and development, aiming to constantly improve product formulations and construction practices that meet emerging needs. Our investment in AI/ML has brought advanced logistics for better delivery of our products and reduced costs. Customers benefit from real-time project key performance indicators (KPIs), delivery mapping, electronic proof of pick-up/delivery and push notifications. |
| 7. | Intense customer focus: We heavily engage with customers from senior executive business and technical levels to our front line commercial, customer support and technical teams. We seek to understand and solve issues our customers face and constantly improve the ease of doing business. We maintain a strong end user engagement and focus to understand new trends, future demands and develop the next product and service that our customers will need. |
Significant Installed Capacity Ready to Capture Market Growth
As the industry enters what we believe to be a new multi-year growth phase, we have expanded our capacity with the goal of meeting what we expect will be a growing demand for our products and services. Our average cement sales volume over the past three years was approximately 5.6 million tons and our three marine import terminals are capable of receiving and distributing approximately 6.3 million tons of cement annually, as of December 31, 2023. This capacity is a result of significant investments that we have made to expand our import terminals along the Eastern Seaboard, including a combined $73 million to increase capacity at our Port Tampa Bay Terminal and our Norfolk Terminal.
Our Port Tampa Bay Terminal averaged over 650,000 tons of imported cement annually over the last three years, with an ability to manage approximately 2.5 million tons annually. We are also permitted and able to import, store and ship over 700,000 tons of aggregates per year at our Port Tampa Bay Terminal. At our Norfolk Terminal, we imported approximately 450,000 tons of cement annually over the last three years, and we can manage approximately 1.9 million tons annually. Our Essex Terminal averaged over 850,000 tons of cement imports annually over the last three years, with capabilities to manage approximately 1.9 million tons annually. With our differentiated multi-product capabilities, we can import different types of cements, SCMs, aggregates and other bulk products.
The Eastern Seaboard requires imports of cement, aggregates and SCMs to supplement domestic production. With construction activity expected to increase in the coming years, the need for imported construction products is expected to rise. Cement imports have always been an integral and flexible part of our business model. With our import capabilities, we are able to flex our supply to meet market demand, such as quickly increasing our imports to meet increased demand while expanding our geographic reach and the ability to cost effectively serve these market areas.
Proven Track Record of Successful Innovation Merging Global Trends with Local Needs
We believe our latest product and technology developments position us at the forefront of innovation and sustainability, directly addressing emerging market trends and enhancing our competitive strengths across the construction industry. Furthermore, we believe our focus on innovation allows us to better address high growth and high margin product and service opportunities.
143
Table of Contents
Our innovation helps to solve critical industry and society needs, addressing themes such as , (i) the path to net-zero emissions, (ii) construction productivity, (iii) novel construction technologies, (iv) circular economy and (v) climate adaptation.
| | The path to net-zero: We believe we are a pioneer in developing and commercializing lower carbon, high-performing cement, enabled by manufacturing and material science innovations. This is exemplified by fully converting from OPC to Lower-Carbon Cement, which has up to 10% lower CO2 emissions per-ton than OPC. We have completed the development and industrial-scale testing of our ternary blended cements (Type IT) which has up to 50% lower CO2 emissions per-ton than OPC and is currently produced at both of our cement plants. These cements have received approvals by the DOT in the markets where we operate. With a strong emphasis on decarbonization, we believe our Greencrete® branded concrete products, which offers independently validated less carbon-intensive concrete mixtures while enhancing performance across all applications, align strongly with the industrys shift towards sustainable construction practices. |
| | Construction productivity: We have invested in and embraced AI/ML capabilities that allow us for predictive maintenance capabilities, enabling continued growth in productivity, which until now has steadily declined industry-wide for decades. We believe that continued investment in construction technology and property technology, including 3D printing and new concrete applications, will enable productivity gains across the residential, non-residential and infrastructure construction markets. |
| | Novel construction technologies and high-performance products: As a result of our continuous investment in new, innovative materials, we have created several novel construction technologies and high-performance products, including (i) proprietary 3D concrete printing materials that cater to the growing demand for durable, resilient and efficient building materials, (ii) underwater concrete solutions that are engineered to meet the challenges posed by rising sea levels and coastal erosion, (iii) extended joint spacing concrete which is used in modern warehouses and distribution centers to accommodate modern robotics for efficient and safe operations and (iv) high-performance concrete (concrete with compressive strength in excess of 12,000 pounds per square inch) for use in ultra-deep foundations and high-rise construction that allows our customers to provide a sound structural base for at a fraction of the volume of material usually required. Further, our high-performance concrete technology can employ in situ maturity meters for precise curing and strength development confirmation, giving our customers new and non-destructive methods of approving in place concrete products. |
| | Circular economy: Our commitment to the circular economy is demonstrated through our recycled aggregates initiative, offering a more sustainable alternative to virgin materials that are mined from quarries. Additionally, we leverage industrial waste streams as critical sources of fuel and raw material for cement and concrete manufacturing. Furthermore, we are currently working on initiatives related to upcycling concrete waste, recognizing that much of the construction and demolition waste produced in the U.S. is currently downcycled or disposed of in landfills. Lastly, we have invested around carbon capture, utilization and storage, as well as alternative raw materials that reduce the amount of carbon-intensive clinker used in our cement manufacturing operations. |
| | Climate adaptation: Several communities in our key markets, including New York City, the Hampton Roads region of Virginia and South Florida, are investing in infrastructure to contribute to resiliency and mitigate the effects of climate change. For instance, we developed proprietary cementitious mixes for 3D-printed seawalls and reefs that mitigate wave impacts especially during extreme weather events. We are part of the South Florida Climate Tech Hub consortium to launch and scale innovations for resiliency and adaptation. |
Our innovation capabilities are fostered by our Titan Product Development and Application Labs, Digital Center of Excellence, Innovation HUB (expected to open in early 2025), Titan Corporate Venture Capital, partnerships with universities and national labs, and the new South Florida ClimateReady Tech Hub (of which we are a consortium member) which is focused on scaling infrastructure and energy innovations for climate change.
144
Table of Contents
Each of these initiatives underscores our commitment to leading the market with high-performance, sustainability-minded solutions.
Strong Financial Track Record, Healthy Cash Flow Generation and Proven Ability to Manage Leverage
Our strong and competitive position has contributed to a track record of consistent above-market growth and profitability improvement since 2013. Since key members of our executive management team were appointed in 2014, we have achieved a revenue CAGR of 11% from fiscal year 2013 through fiscal year 2023. Over the same period, our net income grew by $221 million and our Adjusted EBITDA has grown at a CAGR of 25%. In 2023, our net cash provided by operating activities grew to $227.1 million and our Free Cash Flow grew to $108.5 million. As of December 31, 2023, our Ratio of Total Debt to Net Income was 2.6 to 1.0 and our Ratio of Net Debt to Adjusted EBITDA was 1.2 to 1.0. In the nine months ended September 30, 2024, our net cash provided by operating activities grew to $197.1 million and our Free Cash Flow grew to $83.8 million. As of September 30, 2024, our Ratio of Total Debt to Net Income was 2.5 to 1.0 and our Ratio of Net Debt to Adjusted EBITDA was 1.1 to 1.0. For additional information about, and a calculation of, Adjusted EBITDA, Free Cash Flow, Net Debt and Ratio of Net Debt to Adjusted EBITDA, which are non-IFRS measures, see Managements Discussion and Analysis of Financial Condition and Results of OperationsNon-IFRS Measures.
We believe that the diversified nature of our end markets and customer base, as well as our vertically integrated business model, provides increased stability for our business relative to other building materials manufacturers. The infrastructure, residential and non-residential end markets have historically operated on different cycles and benefit from varied demand drivers. The stability of our diversified end markets has allowed us to generate free cash flow throughout economic cycles, which we have historically deployed to manage leverage, invest in organic growth opportunities and make strategic acquisitions.
An Independent Business that Benefits from the Support of a Well-Established Parent Company
Established in 1902, Titan Cement International, our parent, is a leading global cement producer. Since our initial investment in the United States in 1989, we have operated as a largely independent U.S. subsidiary. While our operations are all handled domestically and our current U.S. management team has driven significant growth in the business since 2014, we benefit from intercompany loans and credit facilities made available to us through TGF, a wholly owned subsidiary of Titan Cement International. These intercompany loans and credit facilities are based on financial terms contained in the arms length agreements consummated among TGF and its third-party lenders, each of which benefit from Titan Cement Internationals credit rating. The intercompany loans and credit facilities made available to Titan America contain no financial or other covenants and utilize the favorable market pricing obtained by TGF as a result of Titan Cement Internationals credit rating. For these reasons, we believe the overall pricing and terms of the intercompany agreements are better than those that Titan America could independently secure in the credit markets. We also benefit from services agreements with Titan Cement International, pursuant to which Titan Cement International provides us with technical, functional and other support services, including the services of the in-house engineering team of our parent company, with whom we partner to develop proprietary technology that aims to make cement production faster, more cost-efficient and better for the environment. With essentially two teams working on developing new technology and processes to improve our operations, we believe we are at the forefront of innovation in our industry. See Certain Relationships and Related Party Transactions.
On a yearly basis, Titan America LLC enters into ordinary course of business supply agreements under the master supply agreement with Titan Cement Company S.A., an affiliate of TCI, for the purchase of a predetermined amount of cement and cementitious products for the following year at a price based on the arms length principle in accordance with the U.S. transfer pricing rules and the relevant OECD guidelines. See Certain Relationships and Related Party Transactions.
Dedicated Management Team with a Proven Track Record of Stable, Above-Market Growth and Fiscal Responsibility
Our executive management team collectively has approximately 225 years of combined experience, which is leveraged across the organization and supported by a strong set of local and regional managers who have operational expertise in the industry.
145
Table of Contents
Our executive management team has successfully guided us through various economic cycles, including the COVID-19 pandemic. Under our current senior management teams leadership, we have grown our sales from $539 million in 2013 to $1.6 billion in fiscal 2023, our net income went from a loss of $65.4 million to a positive $155.2 million and our net income margin has grown from negative 12% to positive 10% during that same period.
We believe that our executive management teams experience navigating through economic cycles, as well as our diversified end markets and customer base and vertically integrated business model, provides increased stability for our business relative to other building materials manufacturers. The infrastructure, residential and non-residential end markets have historically operated on different cycles and benefit from varied demand drivers. The stability of our diversified end markets has allowed us to generate free cash flow throughout economic cycles, which our executive management team has historically deployed to manage leverage, invest in organic growth opportunities and make strategic acquisitions.
Growth Strategies
We intend to leverage our competitive strengths to create shareholder value through the following core growth strategies:
Cement Capacity Expansion
We are currently investing behind expansion of capacity at our Pennsuco facility and our Roanoke Plant that we expect will increase total cement production capacity by 29% to 4.9 million tons by 2030, compared to our current cement production capacity of 3.8 million tons as of September 30, 2024. With a goal of increasing cement production to three million tons at our Pennsuco facility and 1.8 million tons at our Roanoke Plant by 2030, we plan to invest in new grinding mills and repurpose existing assets for additional grinding capacity.
We expect that the additional cement capacity will allow us to meet higher demand with domestic production, while maintaining our flexibility provided by our import capabilities to further increase supply. The planned additional cement capacity includes (i) a flash calciner project at our Roanoke Plant, which will be partially funded by the DOE, and (ii) fine calcined clay production capacity, blended downstream without extra grinding, thus supporting lower carbon cement production.
We are also developing a plan to expand our Pennsuco facilitys cement storage by 30,000 tons and enhance loadout capabilities with new loading bays. We plan to engage an outside engineering firm to study upgrades to the existing systems and design the extra storage and loadout needed to handle three million tons of annual cement production.
To increase unloading capacity, Port Tampa Bay is currently investing $20 million in a new berth in front of our Port Tampa Bay Terminal. We will have priority right at this new berth with 72-hours written notice, subject to limited exceptions, as per an agreement with Tampa Port Authority, which allows us to berth our vessels without delay or restrictions in connection with other port traffic. With the goal of efficiently distributing our Pennsuco facilitys additional capacity, we plan to invest and expand existing rail terminals on the FEC railway to double existing cement rail volumes.
Supplementary Cementitious Materials: Grow Domestic Production, Imports and Volume from New Sources
We plan to invest in growth of domestic production and imports of SCMs, which are an important input in the long-term decarbonization of the cement industry. By capitalizing on our proprietary ST electrostatic separation technology, we are pursuing agreements with coal fired power plants for the reclamation and beneficiation of landfills and freshly generated fly ash sources across the Eastern Seaboard. This will provide new sources of fly ash to be utilized for the production of blended cements as well as used in engineered concrete formulations.
146
Table of Contents
We expect that our investment in calcined clay, which is partially funded by the DOE, will result in additional sources of an important cementitious material utilized in the production of blended cements and other engineered concrete applications, further diversifying our product portfolio.
We plan to capitalize on our parent companys owned pozzolan reserves and our import terminals to supply pozzolan, another important element of blended cements and engineered ready-mix concrete formulations. We also will pursue long-term supply contracts to import other cementitious materials such as fly ash and slag from reliable sources around the world.
Aggregates: Strengthen Position through Investment in Reserves and Exploration
Through our exploration program we are focused on identifying and securing new coarse and fine aggregates sources that can efficiently serve our markets. In addition, we are pursuing potential new sources of aggregates outside our markets by rail and marine delivery. The size and layout of our Norfolk Terminal and Port Tampa Bay Terminal enables the inbound movements of offshore aggregates directly into our markets utilizing Panamax class vessels.
Since 2014, we have added critical reserves to our existing aggregates operations through the acquisition of incremental adjacent property, modifications to existing permits and applying new technologies, including ultra fines recovery, deploying innovative dredge equipment, recycling various construction concrete waste materials and optimizing process plant recoveries.
Strengthen Ready-Mix and Block Businesses through Focused Investment in Downstream Capabilities
To better capitalize on expected growth within our residential, non-residential and infrastructure construction end markets, we are planning to invest in expansion of the reach and capabilities of our ready-mix and block business.
Within our ready-mix concrete business, we intend to invest in 10 to 15 new fixed and portable plants over the next five years. We specifically intend to create a mobile ready-mix concrete division to focus on serving public and private mega-projects, by installing the mobile units right at the customer job sites. We believe that this model will result in planning and operational efficiencies for both our customers and us. This will also allow us to remain close to our customers to provide tailored solutions for services and products.
We intend to expand our block business geographic footprint with at least two additional production locations in the next five years, while at the same time augmenting our existing capabilities at our 13 production lines.
We expect our success in ready-mix concrete and block to continue to help drive growth across all products of our vertically integrated model.
Tapping into New Value Pools and Accelerating Green Growth through Continued Investment in and Development of Financially Attractive, Less Carbon-Intensive Products and Solutions
We intend to continue investing in and developing our portfolio of less carbon-intensive products and solutions as we drive toward achieving our goal of carbon neutrality across the cement and concrete value chain by 2050. We believe we can grow our revenue as the demand for differentiated less carbon-intensive products and solutions is expected to accelerate over the coming years.
Our product development program is centered around driving innovation, productivity, performance and sustainability across our portfolio, with a keen focus on meeting emerging market demands and enhancing our competitive edge to drive revenue growth and margin expansion. Our initiatives are strategically designed to leverage technological advancements, optimize operational efficiency of our own operations and those of our customers and deliver high-performance, environmentally sustainable solutions to our customers.
147
Table of Contents
We plan to build on the foundation of our recently developed high-performance concrete and cementitious products tailored to meet increasingly demanding construction needs for infrastructure and commercial markets. These products and solutions include:
| | High-strength and high-modulus elasticity concretes, which are designed for increasingly tall and slender high-rise buildings in major urban markets. |
| | High-durability concretes developed for projects requiring extended service life in extreme conditions, including landmark tunnels and bridges. |
| | Marine and underwater concretes, designed and specialized for corrosive environments. |
| | Our GreenCrete® product line, which offers independently validated less carbon-intensive concrete mixtures (based on third-party measurements of embodied CO2 content relative to industry benchmark specifications) while enhancing performance across all applications. |
| | BrightCem®, an industry-first performance-based cement with a reduced CO2 footprint. |
| | Proprietary 3D mortars for both residential and marine applications. |
| | Extended joint spacing concrete, which addresses specific challenges in the automation of the warehouse and distribution industry, providing a durable low joint surface to allow the use of robotic solutions. |
Our lower carbon and high performing cements and supplementary cementitious materials are critical to enable these concrete mixes. We believe that our high-performance products not only enhance the quality of construction but also support sustainable and resilient development.
Leverage our Vertically Integrated Business Model to Grow our Existing Market Positions
Externally, our ability to manufacture and deliver aggregates, cement, SCM, ready-mix concrete and concrete blocks allows us to act as a single-source supplier for customers across all construction end markets. Our extensive logistics network, comprised of marine and land terminals, railways, trucks, modern infrastructure and technology, enables us to service customers, including major project sites. In 2023, we completed a $73 million investment at our Port Tampa Bay Terminal and our Norfolk Terminal, constructing new domes, adding multi-product storage capacity of approximately 70,000 tons each, as well as on other repairs and refurbishments.
Customers rely on suppliers with condensed, local supply chains due to the cost-intensive nature of transporting cement products. We intend to leverage our vertically integrated business and robust logistical network to serve our existing clients and to grow our current market positions.
Drive Digitalization as a Critical Enabler for Top-Line and Margin Growth with Dynamic Manufacturing, Logistics and Customer Experience Solutions
We plan to continue investing in digital transformation and AI/ML technologies as we see it as a critical enabler to drive operational excellence and growth. We are among the first cement producers to implement a full set of AI/ML digital solutions that have improved the productivity, efficiency and reliability of our manufacturing operations. Both of our cement plants are now utilizing RTO that improves equipment throughput while minimizing energy consumption, AI/ML-based predictive maintenance tools that improve the reliability and stability of the operations and AI/ML-based predictive quality analytics that improve product quality and consistency. We believe that our position as a technological innovator in our markets positions us to take advantage of growth opportunities and develop further efficiencies in our operations.
Capitalizing on the knowledge and experience gained from the industrial digitalization applications, we are developing and implementing an AI/ML application for real-time optimization of our logistics and distribution network managing the scheduling and delivery of our concrete products. These algorithms will allow for better
148
Table of Contents
scheduling of daily deliveries, taking into account external disruptions like weather and traffic events and keeping the customer aware of their product delivery status. This advanced digital application coupled with a dynamic, end-to-end cloud-based customer portal will transform the way our customers interact with us, improving the overall customer experience while contributing to distribution cost reduction and productivity increases of our ready-mix concrete operations.
Enhance our Platform Capacity and Utilization through the Implementation of Internal Initiatives Supporting Growth and Profitability
Our current executive management team has a robust track record of driving improvement in the business and a proven ability to execute strategic initiatives since 2014. In addition to the above strategies, we have a slate of initiatives focused on growth, driven by operational excellence, asset utilization, pricing, raw material procurement, cost controls and freight/distribution logistics, targeting improvements in our cost structure and overall profitability. Lastly, we are making strategic investments in new assets to enhance our material storage and distribution facilities, mineral reserves and delivery capacity.
Expand into Adjacent Market Segments within the Construction Value Chain
In addition to our growth strategies pertaining to our existing geographies and core products, we are constantly evaluating opportunities to expand via greenfield development or potential acquisitions into adjacent market segments across the construction value chain. This evaluation process represents a strategic effort to capitalize on high-growth opportunities within the construction industry and emerging market needs from our customers. Successful expansion can generate additional revenue with margins that are enhancing to our core business, capitalizing on market demand and our ability to offer high-quality, durable products and services tailored to the specific needs of customers up and down the construction value chain.
For example, we are exploring an expansion into the precast market, specifically production of lintels, sills and pavers. We have the raw materials and technical capabilities to produce these high-margin products and we maintain commercial relationships and channels to the end user markets. These product markets represent an obvious adjacency into which we can grow.
We intend to remain disciplined in our approach with an aim to generate strong returns through capital deployment. We believe our capital resources provide us with ample financial flexibility to execute organic and inorganic growth opportunities.
Customers
Our customer base includes a diverse range of clients within the construction and building materials sector. This typically encompasses:
| 1. | Construction companies: Large and small construction companies, contractors and builders that use cement for applications within the residential, non-residential and infrastructure construction end markets. |
| 2. | Ready-Mix concrete producers: Companies that require bulk cement for mixing with aggregates and other materials for concrete production. |
| 3. | Public sector: Government agencies involved in infrastructure construction projects, including roads, bridges and public buildings. |
| 4. | Industrial clients: Businesses that require cement for manufacturing processes or specific applications, such as precast concrete products. |
We focus on providing high-quality products and services to meet the needs of our customer base, often emphasizing sustainability and innovation in our offerings.
149
Table of Contents
We (through our subsidiary companies) issue quotes and/or otherwise enter into sales agreements with our customers in the ordinary course of business, each of which include terms and conditions that govern delivery and payment of the products we sell. These agreements generally provide a limited warranty related to each of the products we sell that the materials sold will meet or exceed in all material respects applicable ASTM/ACI standards when tested in accordance with such standards.
Raw Materials and Suppliers
We use various raw materials in manufacturing our products, sourced from a diverse supplier base. The raw materials used include sand/aggregates, bauxite, fly ash, iron slag, gypsum, pozzolans, packaging (paper bags, shrink wrap) and chemicals (grinding aids, concrete admixtures). Other key inputs include kiln fuels (including natural gas, coal and alternative fuels), refractories, grinding media, spare and replacement parts for process and handling equipment, diesel fuel and electricity.
We source these raw materials from a broad range of key suppliers, both in the United States and overseas, with multiple options for key raw materials. We maintain strong relationships with our key suppliers both contractually and operationally, and we have a long history of sourcing these materials. These strong supplier relationships, along with our multiple sourcing options, assist in negotiating favorable sourcing terms, including product availability, payment terms and pricing. We enter into supply agreements with suppliers as appropriate to define and manage specifications/quality and scope of work, commercial terms, service levels, supply security and risk mitigation, warranties and claims and dispute resolution mechanisms. We actively monitor our supply agreements and relationships to optimize cost and performance, mitigate supply risk and strengthen our supply chain where possible.
Our top 20% of suppliers (with a spend of over $1 million) make up approximately one-third of our total spending as of September 30, 2024. Moving forward, we aim to maintain a diverse base of suppliers and do not expect the concentrations to materially change.
We have maintained a stable and long-standing relationship with most of our key suppliers, including our top 20% of suppliers who make up roughly a third of our external purchases, excluding intercompany purchases. Since 2021, we have been purchasing products or services from these suppliers on a consistent basis, in most cases, for several years prior as well. In addition, we have not had any significant supply or service disruptions from these suppliers since 2021.
Competition
We operate in the largely diverse construction materials industry on the Eastern Seaboard. Our competitors include large public companies and many small, privately held companies with varying degrees of vertical integration. In each of our markets there are small privately owned sand and gravel operators as well that can add to the competitive landscape. We believe we have a strong competitive profile and are well positioned in the markets we operate with high capacities and logistics capabilities with competitive costs to serve.
The construction materials industry has high barriers to entry. These barriers to entry include the capital-intensive nature of the heavy construction materials production process, as well as stringent regulations requiring new entrants to receive permits and approvals to operate, including acceptance from local communities.
Additionally, we compete in the construction materials industry with alternative building materials, such as wood, steel, glass, asphalt, precast concrete and masonry that may have environmental or related sustainability characteristics that appeal to certain customers.
We believe we have a competitive advantage through our suite of building materials and products, as well as our comprehensive logistics network. We can act as a single-source supplier which enhances our ability to win contracts for various materials and products in a variety of sizes and complexity levels. In addition, we believe that our focus on decarbonization and sustainable products gives us a competitive edge over our competitors that have not developed such products.
150
Table of Contents
We believe our diverse array of products and efficiencies, both from vertical integration and logistics, can attract customers and cultivate strong, mutually beneficial relationships that help us maintain a competitive advantage compared to our peers. This advantage is furthered through our ability to manufacture and efficiently self-supply many raw materials for our core products. Our strategic planning and coordination across our operations enable us to optimize the utilization of the entire manufacturing network, contributing to what we believe is superior customer service and overall experience.
Seasonality
The building materials we supply directly support the construction industry, which is seasonally impacted in some states, including those in the Mid-Atlantic business unit. Therefore, we generally record lower revenues and operating profits in the Mid-Atlantic during the first half of the year when adverse weather conditions may be present in the northern parts of the territory.
In contrast, sales and profitability are higher during the second half of the year, as favorable weather conditions support construction activity. Hence, any seasonal changes and other weather-related conditions, in particular extended rainy and cold weather in the spring and fall and major weather events, such as hurricanes, tornadoes, tropical storms and heavy snows, can lead to a decline in both the use of our products and demand for our services. The Carolinas and Florida are less seasonally impacted, with the corresponding construction season being more balanced across the year, but are susceptible to the impacts of hurricanes. This can intermittently affect third and fourth-quarter sales depending on the hurricane season intensity.
Intellectual Property
Our intellectual property and proprietary rights are valuable assets that are important to our business. In our efforts to safeguard our copyrights, trade secrets, trademarks and other intellectual property rights worldwide, we rely on a combination of federal, state, common law and international rights in the jurisdictions in which we operate.
As of September 30, 2024, we have been issued 30 trademark registrations providing protection for our family of brands as they relate to our various product lines, as well as 47 patents, covering novel technological developments in fields of electrostatic separation and associated separator systems, and beneficiation processes, as well an invention which meters waters in concrete production.
We also rely on non-disclosure agreements, invention assignment agreements, intellectual property assignment agreements, or license agreements with employees, independent contractors, consumers, software providers and other third parties, which protect and limit access to and use of our proprietary intellectual property.
Though we rely, in part, upon these legal and contractual protections, we believe that factors such as the skills and ingenuity of our employees, as well as the functionality and frequent enhancements to our platform, are larger contributors to our success in the marketplace.
Sustainability and Our Commitment to ESG
As a member of Titan Cement International with a rich history of approximately 120 years, our legacy is rooted in innovation and an unwavering commitment to responsible growth. We approach every challenge with an entrepreneurial spirit, focusing on three key areas: promoting lower carbon operations and supply chains, digitalizing our organization and delivering cutting-edge solutions to meet our customers needs.
We are committed to decarbonization and sustainable product development. We believe we are a leader in developing greener building materials and seek to expand our manufacturing reach further with new products across end markets.
151
Table of Contents
Titan Cement International has demonstrated leadership in sustainability through a wide array of initiatives across its operations, supported by ambitious ESG targets and science-based CO2 reduction goals. Titan Cement Internationals emphasis on transparency, ethical practices and environmental stewardship has positioned it as a leader in its sector, garnering recognition as a preferred partner for investors committed to ESG principles.
In July 2024, Titan Cement International was included in the FTSE4Good Index Series, created by FTSE Russell and designed to measure the performance of companies demonstrating strong ESG practices. In March 2024, our parent company received a 71/100 ESG score from the London Stock Exchange Group data and analytics, ranked 17 out of 120 construction materials companies. In February 2024, and for a second consecutive year, Titan Cement International received a top A score on climate action by the Carbon Disclosure Non-Profit Organization (CDP), recognizing its leadership in corporate transparency and performance on climate change.
Building on our strong sustainability performance over the years, in 2021, we launched our ESG targets for 2025 and beyond in accordance with Titan Cement International guidelines. They focus on four pillars:
| | decarbonization with annual targets on scope 1 (direct) and scope 2 (indirect) CO2 emissions, |
| | a growth-enabling work environment targeting improvements in the health and safety of our workforce, diversity and inclusion in the workplace and continuous development of our people, |
| | positive local impact related to plant emissions, quarry rehabilitation and biodiversity plans, local economic positive impact and community engagement programs and |
| | responsible sourcing for resource efficiency, recycling and recovery as well as reliable and sustainable supply chain. |
Titan Cement International was among the earliest cement companies globally to have its GHG emissions reduction targets approved by the Science Based Targets initiative (SBTi) as being in line with the 1.5°C pathway and among the first group of companies to receive approval for net-zero targets.
Over the past years, we have increased our ability to serve our market with less carbon-intensive products due to our new, high-capacity storage domes at our marine terminals and distribution network upgrades. By late 2022, we replaced the substantial majority of OPC sales with our Portland-limestone Lower-Carbon Cement, which has an embodied carbon reduction of up to 10%. Both cement plants now leverage end-to-end digitalization with autonomous AI/ML real-time optimizers and failure prediction algorithms, resulting in higher reliability, higher product quality and decreased energy consumption. Our cement production again achieved ISO 50001 Standard for Energy Management, TRUE Zero Waste and Energy Star certifications.
Human Resources and Employees
As of September 30, 2024, we had approximately 2,726 employees supporting our operations, 1,899 of whom are hourly workers. The remainder are salaried employees, 320 of whom are salaried non-exempt and 507 of whom are salaried exempt. Labor unions represent 120 of our employees.
We prioritize a strong workforce by recruiting talented employees through hiring and training employees to have the adequate skills, abilities and motivations to achieve our standards.
We prioritize health and safety in the workplace. We provide the resources needed and training for our employees to ensure safe work environments, including the following safety protocols:
Visible Felt Leadership. We perform leadership audits on a monthly basis at each site and cross-functional inspections on the quarter led by the safety teams in both Florida and Mid-Atlantic. Additionally, we have quarterly Ready-Mix Driver Council meetings to address any safety concerns from any of our professional drivers.
152
Table of Contents
Regular Safety Training. We provide in-depth on-boarding training for new employees and conduct monthly safety training at all locations including life-saving procedures training in all areas. Additionally, we employ ready-mix driver simulators in each region to develop defensive driving skills in a safe training environment.
Accountability and Recognition. We have won plant-wide and individual personnel safety awards including PCA site awards and National Ready-Mix Concrete Association (NRMCA) Driver of the Year and Safety Leader of the Year awards. Internally, we recognize Safety Leadership, Site Performance and Most Improved Awards.
Employee Engagement. We conduct safety skills competitions annually for our ready-mix and block teams. These winners compete statewide against our industry competitors for a chance to compete nationally. We require safety committees in each region and host employee town halls several times per year.
Compliance Monitoring. We monitor compliance through action item tracking and small group audits, cross-functional audits and annual audits.
Immediate Reporting and Tracking of all Incidents. We conduct regular management reviews for real-time incident management. Additionally, we utilize an incident management system (process map) for incident tracking. Internally, our lost time incident rate has remained below 0.10 over the last three years, with the MSHA-regulated sites at 0.00. Many of our sites have reported no lost time incidents over the last five years, including our Pennsuco plan and our Roanoke Plant.
Safety Awards. We have received many industry safety awards. The ready-mix concrete teams received the Gold Award from the NRMCA in 2024 for 11 of our plants, with many having multiple wins over the last three years. Our Pennsuco cement operation also received the PCA Chairmans Safety Award in 2021. The Pennsuco aggregates quarry has received the Sentinels of Safety Award from the National Mining Association (NMA) for the last four years in the large quarry category and 10 times overall. These awards are the most ever received by any quarry in the programs history.
Innovation and Technology
Our innovation and technology efforts contribute to the our carbon-neutral commitment and allow us to better meet customer needs for novel technologies, higher-performing materials and greater productivity. We will soon inaugurate the Titan America Innovation Hub (the Innovation Hub) located in Miami, Florida, to provide a collaboration space for innovators, startups, entrepreneurs and researchers to develop, launch and scale products and services for a safe, resilient and sustainable world. The Innovation Hub is closely linked to our product development and application laboratories network and informs and supports our innovation roadmap.
We provide technical services through an internal department (Technical Services). The primary mission of Technical Services is to assume a pivotal role as a technical expert specializing in cement product performance and its applications in concrete and masonry.
Acting as a liaison between operations, sales and management, Technical Services offers technical engineering guidance and aid in troubleshooting product performance issues for internal and external customers. The three primary functions of Technical Services are:
| | Technical support to internal and external customers; technical assistance to cement sales and operations teams, including proposing parameters and processes for ready-mix plants to improve performance; assessing and resolving customer complaints; technical expertise for special products; and communication between the cement plant and customers. |
| | Product and knowledge management: Assisting with the introduction of new products to the market, supporting product development, providing input into future products and specifications, consolidating and disseminating product knowledge, offering technical support for litigation cases, identifying opportunities for product development based on the needs of the local market, recording industrial |
153
Table of Contents
| experience and interesting cases in databases, reviewing concrete raw materials and monitoring processes, applying specialized knowledge of the DOT and developing and disseminating technical presentations and product information. |
| | Quality management: Conducting a thorough analysis of customer claims and identifying root causes related to process or production conditions. Developing comprehensive quality training programs customized for internal and external customers to improving their understanding and application of quality standards. Working closely with the technical center to lead research and development initiatives to enhance product quality and performance. Carrying out regular quality-related plant technical reviews and audits. |
We are a pioneer in developing and commercializing lower carbon, high-performing cement, enabled by manufacturing and material science innovations. We have fully converted from OPC to Type IL in our markets, which have up to 10% lower CO2 than OPC. We introduced BrightCem®, an industry-first ASTM C1157 performance-based cement with a high percentage of limestone for specialized end markets. We have obtained FDOT and Virginia Department of Transportation approval for Type IT ternary blended cement in our key markets, which feature up to 50% lower embodied CO2 than OPC. Looking to the future, we are pursuing the development of calcined clay, which is a next-generation, higher-performing SCM made with commonly available clays. Our Roanoke Cement Company was selected by the DOE to negotiate for funding to build a first-of-its-kind calcined clay production line in the United States to produce LC3.
We are conducting feasibility studies for CCUS facilities at both of our cement plants, including a project partially funded by the DOEs CarbonSAFE program and a project partially funded by the Southeast Regional CO2 Utilization and Storage Acceleration Partnership. The CCUS projects are evaluating the feasibility of developing regional CO2 storage hubs at our cement plant sites that would ultimately provide access for carbon safe storage within geological features beneath the premises of the cement plants, avoid dependency on external CO2 distribution networks and reduce the logistics and transportation costs of captured CO2 from our cement plants. They could also serve as a CO2 storage hub for nearby industrial CO2 emitters. Pennsucos studies are already advanced to phase II of the CarbonSAFE program that includes detailed geological studies with deep core drilling exploration inside the plants property at a total cost of $11.5 million the majority of which is funded by DOE. Roanoke has already completed phase I with the development of a general geologic model and has applied for funding to proceed to phase II similar to PNS. In addition to the scientific research, the projects include comprehensive community benefit plans, focusing on community and labor engagement, investments in job quality and a skilled workforce, diversity, equity, inclusion, accessibility and the Justice40 Initiative. The plans aim to develop a diverse list of community contacts, host engagement events and promote career opportunities in the CCS industry.
Both our Roanoke and Pennsuco plants have been certified to the ISO 50001 standard (Roanoke since 2018, Pennsuco since 2020), achieved TRUE Platinum certification for zero waste, and U.S. EPA Energy Star (the Roanoke Plant since 2007, Pennsuco since 2008).
Separation Technologies utilizes licensed, patented technology that processes dry powders and recycles waste streams sustainably and cost-effectively. ST also recycles coal combustion by-products and processes them into cementitious materials.
Our ready-mix concrete businesses create highly customized concrete mixes to meet the increasingly demanding expectations of our customers. Our GreenCrete® product line has third-party verified embodied CO2 contents well below industry averages. The embodied CO2 is the amount of CO2 associated with the production of any product, from raw material extraction until it leaves our plants. The embodied CO2 is quantified according to the Product Category Rules (PCRs) for cement and concrete and reported in an Environmental Product Declaration (EPD). PCRs and EPDs are in accordance with ISO standards and are recognized by our customers and government agencies such as EPA, Federal Highway Administration and General Services Administration. In accordance with ISO, the EPDs are third-party verified, which means we hired an independent organization to verify that our information is correct and in accordance with the PCRs.
154
Table of Contents
Additionally, our extended joint spacing concrete mixes offer low shrinkage and high cracking resistance, accelerating construction time and reducing long-term maintenance costs by eliminating the need for joints in commercial and industrial warehouse floors, offering a compelling value proposition for advanced manufacturing facilities that utilize robotics or other automated operations. We offer a line of marine concrete mixes to meet the growing needs of coastal infrastructure across our footprint, including seawalls, bridges, tunnels, wind farms and artificial reefs. Our HPC mixes enable our customers to operate on the cutting edge of strength, durability and deflection for high-rise construction.
We are a consortium member of the South Florida Ready Tech Hub, an initiative by the U.S. Department of Commerce to catalyze commercialization technologies to adapt to the growing climate challenges of rising sea levels, extreme weather and growing energy demand.
The Titan Groups CVC fund enables us to engage with and collaborate with some of the most innovative companies in our industry. For example, the CVC invested in Natrx. This North Carolina-based startup combines remote sensing, digital manufacturing and lower carbon cement to make 3D-printed seawalls to protect coastal assets and ecosystems. This investment expands the size of the available market in the areas in which we operate. Other CVC investments in North America include Rondo and Carbon Upcycling Technologies, each of which provides us with direct access to new technologies.
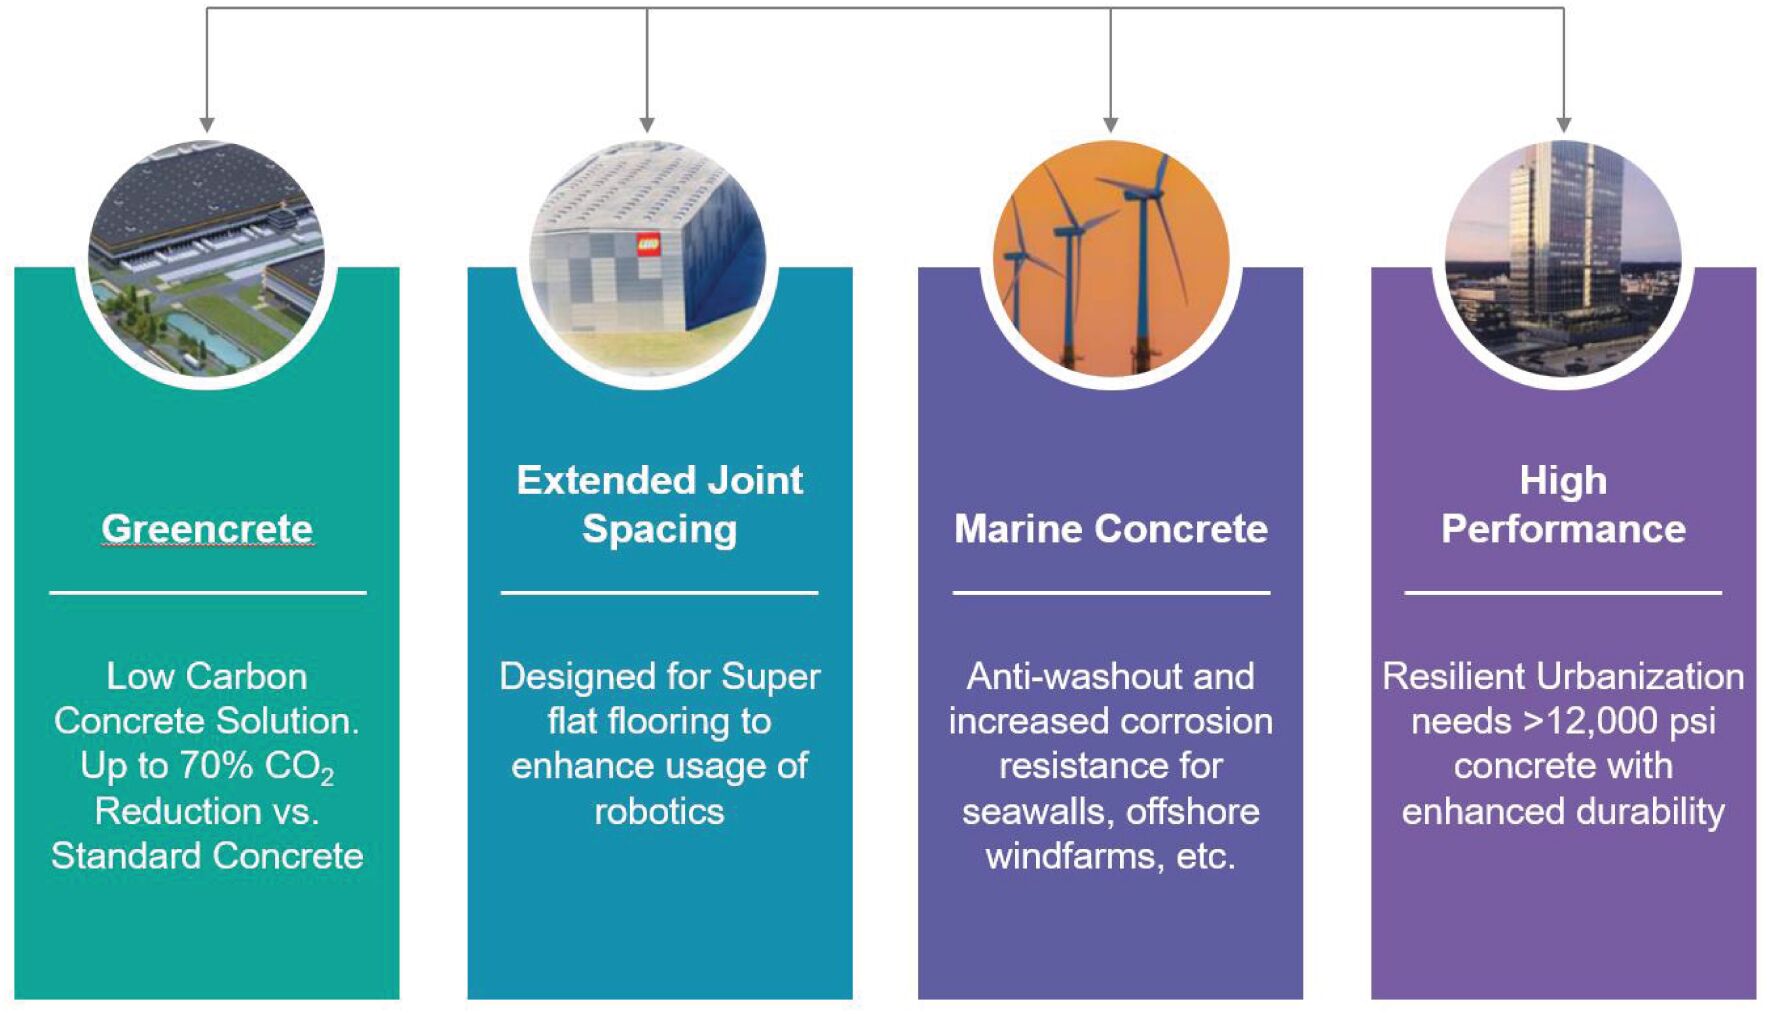
We have developed and sold patent-pending mixes for 3D concrete printing, an emerging and transformative technology that addresses construction labor shortages and lowers construction costs while enabling concrete to be used in new forms and functions.
The Titan Group
Founded in 1902 with the establishment of its first cement plant in Elefsina, Greece, the Titan Group of companies (the Titan Group) has grown steadily over more than a century, becoming a symbol of industrial development and social responsibility.
Initially recognized as Titan Cement S.A. in 1911 and listed on the Athens Stock Exchange in 1912, the Titan Group made several pioneering decisions early on, such as insuring its workforce against occupational accidents in 1922 and introducing employee bonuses well before they were mandated by law. The Elefsina plants
155
Table of Contents
refurbishment in 1937 and the introduction of new rotary kilns marked significant advancements in production capacity, positioning Titan Group as a key player in the Greek and global cement markets.
Throughout the mid-20th century, Titan Group continued to expand its operations and product offerings. By the 1950s, exports constituted a substantial portion of its sales, significantly contributing to Greeces total cement exports. Environmental consciousness also took root early, with the installation of the first environmentally friendly electrostatic filters in Greece. Titan Group established additional plants across Greece, including facilities in Thessaloniki, Drepano, and Kamari, and continued to innovate by setting up accident prevention committees, launching social programs and investing in vertical integration with mines and ready-mix concrete plants. Entering the new millennium, Titan Group became a founding member of several sustainability and social responsibility initiatives, cementing its commitment to sustainable development and community engagement.
By 2019, Titan Cement International became the parent company, listing on Euronext Brussels, Euronext Paris and the Athens Exchange, signifying a new era of growth and global presence.
Titan Group has been recognized as one of the most sustainable companies in the world, according to a 2024 Time Magazine analysis based on external ESG ratings and selected environmental and society performance indicators and is recognized as one of Europes Climate Leaders in the fourth edition of the prestigious list published by the Financial Times. In February 2024, and for a second consecutive year, our parent, Titan Cement International, received a top A score on climate action by the CDP in recognition of its leadership in corporate transparency and performance on climate change.
Titan Group has also recently been included in the FTSE Russell Large Cap Index and confirmed as a constituent in the FTSE4Good Index Series, which is designed to measure the performance of companies based on strong ESG commitments.
The Titan Group has built a large body of proprietary knowledge and corporate infrastructure that continue to help drive the growth and performance of our business. The Titan Group has a proud corporate history of approximately 120 years and operates in 15 countries, with world-class reliability and an industry-leading cost structure. From manufacturing expertise to logistical capabilities, customer focus, product engineering and various corporate functions, we have been able to and will continue to be able to utilize Titan Cement Internationals broad suite of capabilities to maintain market leadership positions across our geographic footprint.
156
Table of Contents
Set forth below are organizational charts displaying the corporate structure of Titan Group as follows: (i) prior to the Reorganization Transactions and the offering, (ii) after the Reorganization Transactions and before the offering and (iii) after the Reorganization Transactions and after the offering:
Organizational Chart Prior to the Reorganization Transactions and the Offering
157
Table of Contents
Organizational Chart After the Reorganization Transactions and Prior to the Offering
158
Table of Contents
Organizational Chart After the Reorganization Transactions and After the Offering
Our Technical and Innovation Capabilities
Since 2006, we have enhanced our manufacturing, distribution and innovation with the creation of our own corporate engineering function.
| | Pursuing innovation and product quality through research and development and introducing and certifying new products. This includes integrating cutting-edge technologies, staying ahead of industry trends, modifying product performance standards and pursuing funding for these innovations. |
| | Technology and process improvements in the areas of: |
| | Structural engineering and critical infrastructure maintenance employing progressive technologies such as drones and AI/ML for fault detection. |
| | Mining and reserves management, encompassing evaluation, planning and oversight of quarry expansions. |
| | Energy management and optimizing consumption to ISO 50001 standards and Energy Star benchmarks. |
| | Industrial decarbonization research for the development of carbon capture and sequestration solutions, along with acquiring government grants to apply these technologies. |
| | Electrical engineering and upgrades of power distribution and plant control networks. |
159
Table of Contents
| | Execution and oversight of major capital projects from conceptual studies to construction management and commissioning utilizing advanced digital tools like Building Information Modeling and 3D digital twins to streamline collaborations and integrate new installations within existing setups. |
| | Implementing maintenance engineering practices across all product lines to boost reliability and reduce maintenance costs, leveraging sophisticated equipment monitoring, AI/ML for fault detection, outage planning and applying advanced robotics, drones and augmented reality for regular plant inspections. |
| | Environmental and sustainability programs, including fostering stakeholder and community relations for significant projects, annual sustainability reports and tracking essential ESG metrics for us. |
Logistics
We believe our network delivers efficiency, flexibility and security of supply for our customers.
Our cement plants and marine and land terminals are strategically located to serve multiple Mega-Regions and growing local markets across the Eastern Seaboard. For example, our Roanoke Plant combined with our Norfolk Terminal and an extensive logistics network of rail terminals, loadouts and storage facilities, efficiently services our markets and customers in Virginia, North Carolina, South Carolina and adjacent markets in Tennessee and West Virginia. In Florida, our Pennsuco facility is the only plant on the FEC rail network serving the east coast of Florida, while our Port Tampa Bay Terminal supports Tampa and the west coast of Florida, one of the fastest growing regions in the country.
As of September 30, 2024, we have the capacity to import more than six million tons of cementitious materials per year on full-size vessels, increasing our total annual cement capacity and providing critical, real-time flexibility to respond to changes in demand. These terminals and import facilities provide connections to our manufacturing plants and end consumers through a comprehensive mix of intermodal transportation capabilities. Both our Roanoke Plant and Pennsuco are directly connected to key rail lines. Through our comprehensive logistics network and capabilities, we are able to deliver both domestically manufactured and imported materials to optimize logistics, minimize costs and contribute to high customer satisfaction through reliable, on-time and full-order fulfillment.
We operate a hauling business that provides extensive, logistical proficiency for the in-house delivery of cement, fly ash and aggregates, ensuring supply chain stability and oversight. By leveraging both external logistics specialists and our internal team, we assess market-by-market logistics expenses and efficiency to decide when to employ third-party carriers compared to in-house or mixed transportation methods.
As of September 30, 2024, we operate 47 hauling trucks at S&W Ready-Mix, of which 24 are cement tankers and 23 are dump trucks. This provides us with greater control over our supply chain, aiming to maintain a timely and reliable delivery of materials, which is crucial for maintaining project schedules and customer satisfaction. By managing these logistics in-house, we optimize our routes and loads, reducing transportation costs and increasing efficiencies. Having this flexibility allows for quick responses to changing project demands, leading to improved service quality and fostering stronger customer relationships.
We have a substantial fleet of ready-mix trucks that we maintain through a comprehensive maintenance, repair and refurbishment program. Our fleet allows us to flex trucks to locations of need based on business trends, customer needs and specific project demands.
160
Table of Contents
The following maps illustrate the efficiencies we provide customers as a result of our vertical integration and logistical network:
The Mid-Atlantic Titan Network
The Florida Titan Network
161
Table of Contents
Our Properties
We maintain corporate offices at 5700 Lake Wright Drive, Suite 300, Norfolk, Virginia, with a corporate office for Titan Florida LLC, located at 800 Fairway Drive, Suite 200, Deerfield Beach, Florida. We have additional offices in Roanoke, Virginia and Clinton, North Carolina. At the local level, each office aims to carry a range of product lines and inventory levels to service our customer preferences effectively. Throughout the United States, we operate and maintain sites, including two cement plants, three import terminals, seven active quarries, 82 active ready-mix locations, eight concrete block plants, seven fly ash processing plants, 12 distribution locations, which consist of 10 cement terminals, eight concrete block distribution yards and two concrete block logistical hubs. In addition to the previously mentioned operations, we have locations currently under development or vacant/surplus. Out of our 140 sites, 105 are owned by us and 35 are leased properties. For more information on our non-mining properties, see Business.
Mining Summary Disclosure
We mine limestone, dolostone, shale and natural sand and other materials used for cement production and aggregates. These products are used to support our cement plants and to produce blended aggregates utilized as general aggregates, ready-mix concrete and as masonry sands. We currently own and operate mining operations in Medley, Florida (Pennsuco), Troutville, Virginia (Roanoke), New Castle, Virginia (Castle Sands), Waverly, Virginia (Heard Sand), Branchville, Virginia (Branchville Sand), Clermont, Florida (Center Sand Mine), Estero, Florida (Corkscrew Mine) and Stuarts Draft, Virginia (DM Conner). We own the mining resources in Castle Hayne, North Carolina (Castle Hayne) which is currently operated by Martin Marietta Materials, Inc. All of our properties are permitted for mining under current regulatory requirements. We consider the Pennsuco and Roanoke properties to be our only material mining properties as defined by Regulation S-K Subpart 1300.
The location of all mining properties are provided in the figures below:
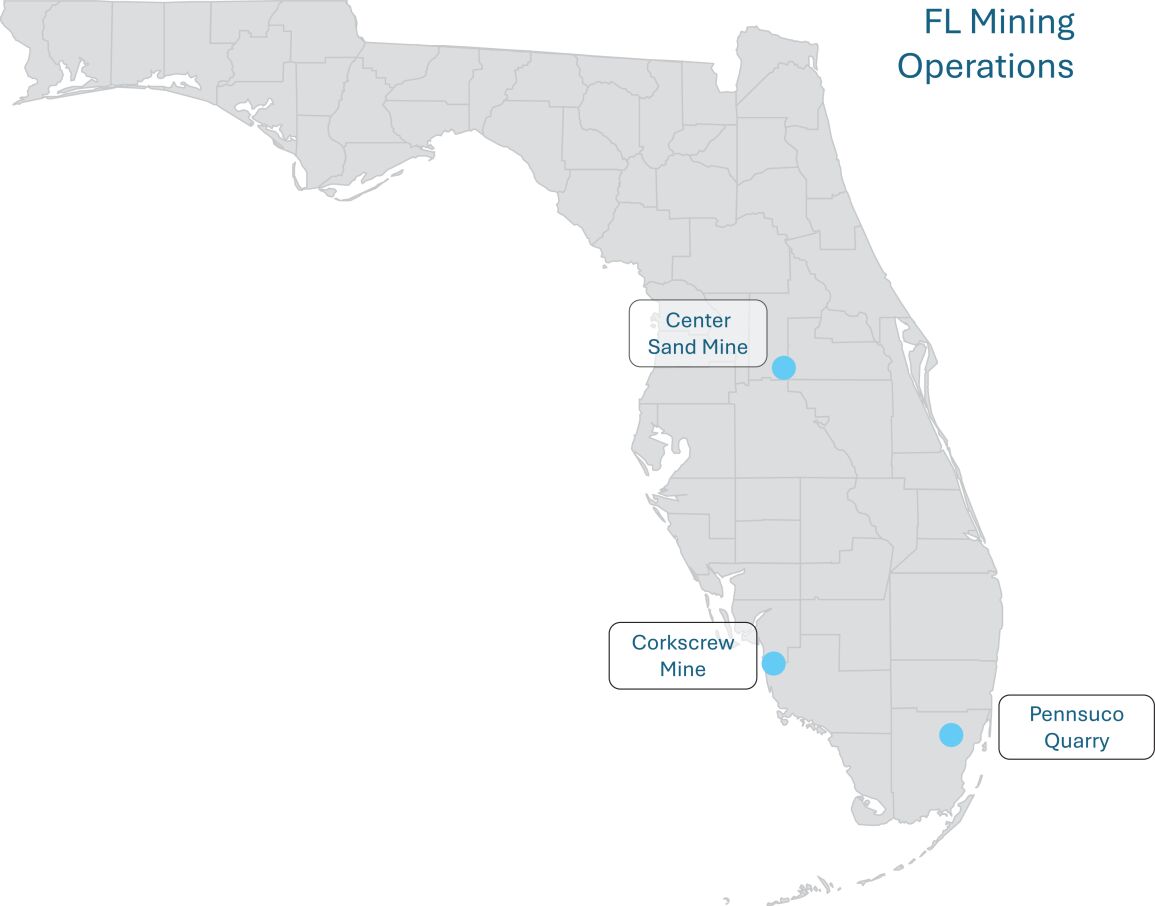
162
Table of Contents
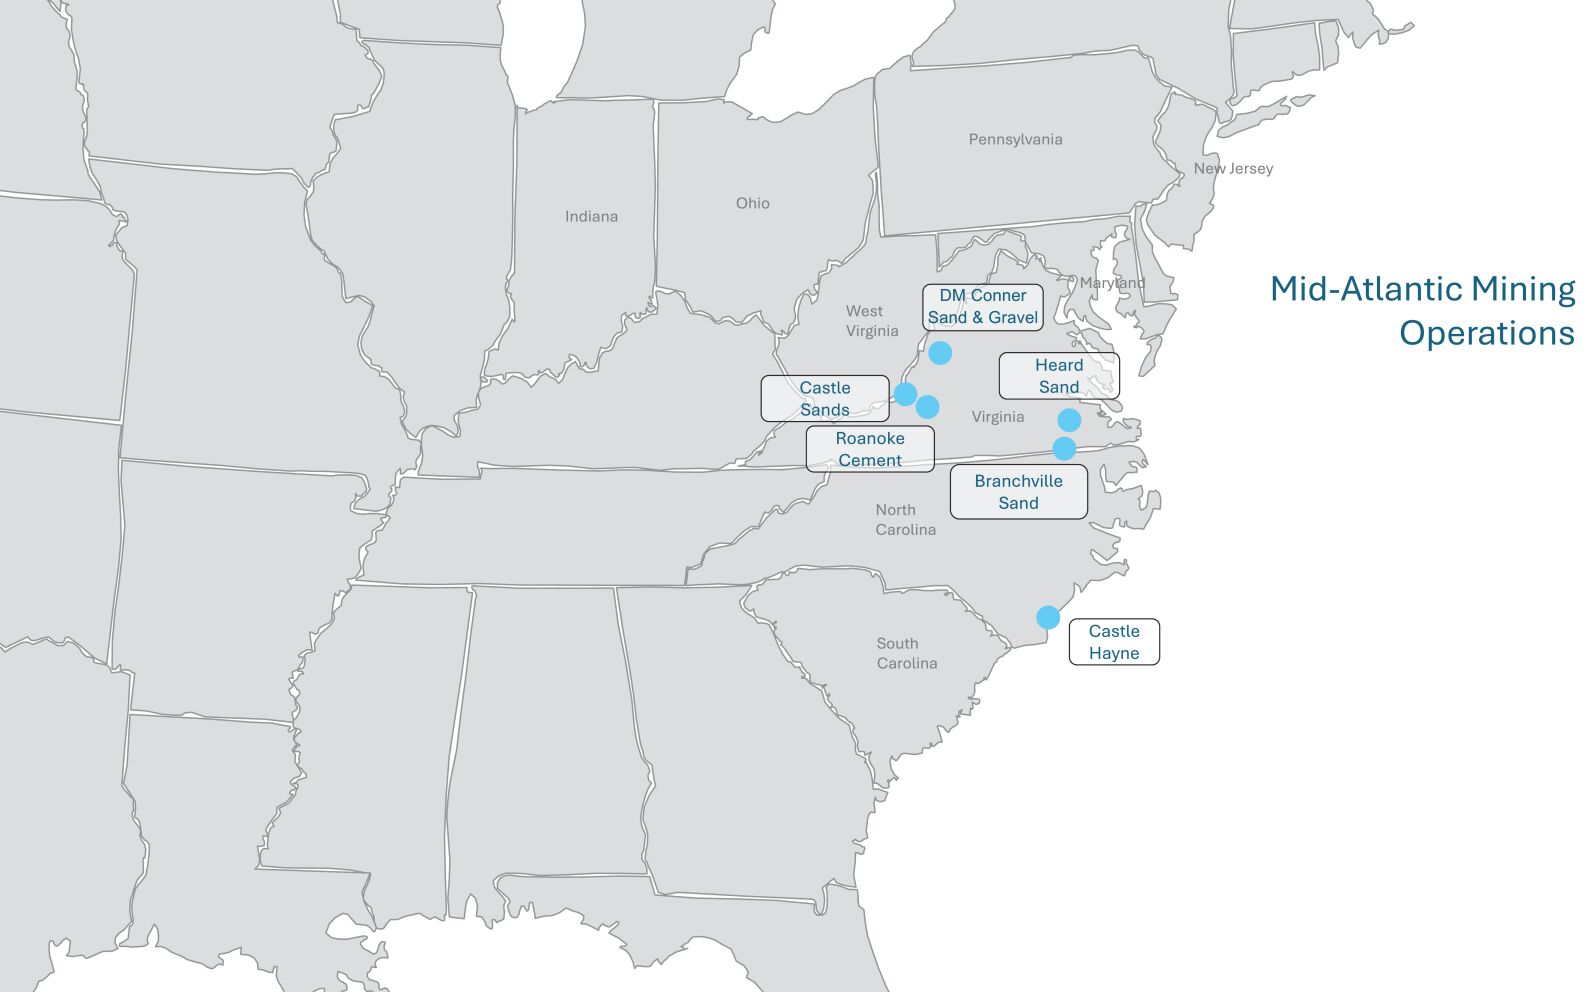
Annual Production
ANNUAL PRODUCTION FOR THE PAST THREE YEARS
(tons per year)
| Product |
2023 | 2022 | 2021 | |||||||||
| Limestone |
||||||||||||
| Pennsuco |
9,543,088 | 10,048,834 | 10,431,132 | |||||||||
| Roanoke |
1,521,050 | 1,466,415 | 1,407,905 | |||||||||
| Castle Sands |
| | | |||||||||
| Heard Sand |
| | | |||||||||
| Branchville Sand |
| | | |||||||||
| Center Sand Mine |
| | | |||||||||
| Corkscrew Mine |
399,299 | 823,364 | 991,481 | |||||||||
| Castle Hayne |
326,002 | 429,159 | 449,987 | |||||||||
|
|
|
|
|
|
|
|||||||
| Total |
11,789,439 |
|
12,767,772 |
|
13,280,504 | |||||||
| Dolostone |
||||||||||||
| Pennsuco |
| | | |||||||||
| Roanoke |
42,615 | 20,708 | 16,896 | |||||||||
| Castle Sands |
| | | |||||||||
| Heard Sand |
| | | |||||||||
| Branchville Sand |
| | | |||||||||
| Center Sand Mine |
| | | |||||||||
| Corkscrew Mine |
| | | |||||||||
| Castle Hayne |
| | | |||||||||
|
|
|
|
|
|
|
|||||||
| Total |
42,615 | 20,708 | 16,896 | |||||||||
| Shale |
||||||||||||
| Pennsuco |
| | | |||||||||
| Roanoke |
403,723 | 402,171 | 481,888 | |||||||||
| Castle Sands |
| | | |||||||||
| Heard Sand |
| | | |||||||||
| Branchville Sand |
| | | |||||||||
163
Table of Contents
| Product |
2023 | 2022 | 2021 | |||||||||
| Center Sand Mine |
| | | |||||||||
| Corkscrew Mine |
| | | |||||||||
| Castle Hayne |
| | | |||||||||
|
|
|
|
|
|
|
|||||||
| Total |
403,723 | 402,171 | 481,888 | |||||||||
| Natural Sand |
||||||||||||
| Pennsuco |
| | | |||||||||
| Roanoke |
| | | |||||||||
| Castle Sands |
331,860 | 323,792 | 338,624 | |||||||||
| Heard Sand |
477,827 | 168,559 | 324,922 | |||||||||
| Branchville Sand |
286,450 | 223,261 | 313,432 | |||||||||
| Center Sand Mine |
319,057 | 374,134 | 389,529 | |||||||||
| Corkscrew Mine |
| | | |||||||||
| Castle Hayne |
| | | |||||||||
|
|
|
|
|
|
|
|||||||
| Total |
1,415,194 | 1,089,746 | 1,366,507 | |||||||||
| Other |
||||||||||||
| Pennsuco |
| | | |||||||||
| Roanoke |
46,038 | 26,166 | | |||||||||
| Castle Sands |
| | | |||||||||
| Heard Sand |
| | | |||||||||
| Branchville Sand |
| | | |||||||||
| Center Sand Mine |
| | | |||||||||
| Corkscrew Mine |
| | | |||||||||
| Castle Hayne |
| | | |||||||||
|
|
|
|
|
|
|
|||||||
| Total |
46,038 | 26,166 | | |||||||||
We acquired DM Conner on October 20, 2024 from D.M. Conner, Inc. DM Conner has historically produced an immaterial amount of sand and gravel and we are now developing the site. Because of the date acquisition, historical production at the DM Conner site was not produced by us, and DM Conners production is not included in our historical annual production for the past three years.
Surface open pit mining methods are utilized at all of our quarry locations. We own our Pennsuco, Roanoke, Castle Hayne and DM Conner mining properties and lease our Castle Sands, Branchville Sand, Center Sand, Corkscrew Mine and mining properties. We own a portion of the Heard Sands property but lease the actively mined portion. We operate all of our mining properties except for Castle Hayne, which is currently operated by Martin Marietta Materials, Inc. Our reserves and resources are on properties that are permitted, or are expected to be permitted, for mining under current regulatory requirements.
Although we are actively mining aggregates at all of our properties, we have reported Reserves only for the material properties, Pennsuco and Roanoke, as no Resources or Reserves have been estimated by a Qualified Person for our other properties. Therefore, in accordance with Regulation S-K Subpart 1300, Pennsuco and Roanoke properties on production stage and the other properties are deemed to be at exploration stage. We periodically perform sub-surface exploration at most of our sites through drilling methods, and we expect to engage a qualified person to estimate mineral reserves or resources at our other properties in the future.
Resources and Reserves
The following tables summarize our Reserves and Resources as of May 1, 2024 for Roanoke and May 24, 2024 for Pennsuco. The sole purpose of the operational and related financial data presented is to demonstrate the economic feasibility of the Reserves for the purpose of reporting in accordance with subpart 1300 of Regulation S-K, and should not be used for other purposes. The information presented originates from comprehensive techno-economic modeling, which is subject to change as assumptions and inputs are updated, and as a result,
164
Table of Contents
does not guarantee future operational or financial performance. As this is the first time that Reserves and Resources have been estimated for Pennsuco and Roanoke by a Qualified Person, there are not mineral reserve or mineral resource information for prior dates. Our Reserves and Resources are on properties that are permitted, or are expected to be permitted, for mining under current regulatory requirements. We have not estimated resources and reserves for any property other than Pennsuco and Roanoke. Our Qualified Person is Continental Placer Inc. (CPI). CPI is not an employee, or affiliate of Titan America and does not have an ownership, royalty or other interest in Pennsuco or Roanoke.
May 2024-RESOURCES(1)
| Measured Resources | Indicated Resources | Measured + Indicated Resources |
Inferred Resources | |||||||||||||||||||||||||||||||||||||||||||||||||||||||||||||
| Amount | %SiO2 | %CaO | %Al2O3 | Amount | %SiO2 | %CaO | %Al2O3 | Amount | %SiO2 | %CaO | %Al2O3 | Amount | %SiO2 | %CaO | %Al2O3 | |||||||||||||||||||||||||||||||||||||||||||||||||
| Limestone |
||||||||||||||||||||||||||||||||||||||||||||||||||||||||||||||||
| Pennsuco(2) |
27,235 | 24.7 | 38.3 | | 20,081 | 15.2 | 45.4 | | 47,316 | 20.67 | 41.31 | | | | | | ||||||||||||||||||||||||||||||||||||||||||||||||
| Roanoke(3) |
84,000 | 8.9 | 47.7 | 1.8 | | | | | 84,000 | 8.9 | 47.7 | 1.8 | | | | | ||||||||||||||||||||||||||||||||||||||||||||||||
| Total |
111,234 | 12.8 | 45.4 | 1.8 | 20,081 | 15.2 | 45.4 | | 131,316 | 13.14 | 45.4 | 1.8 | | | | | ||||||||||||||||||||||||||||||||||||||||||||||||
| Dolostone |
||||||||||||||||||||||||||||||||||||||||||||||||||||||||||||||||
| Pennsuco(2) |
| | | | | | | | | | | | | | | | ||||||||||||||||||||||||||||||||||||||||||||||||
| Roanoke(3) |
28,100 | 11.0 | 33.0 | 1.6 | 190 | 12.9 | 31.2 | 1.4 | 28,290 | 11.0 | 33.0 | 1.6 | 96 | 15.6 | 31.0 | 1.3 | ||||||||||||||||||||||||||||||||||||||||||||||||
| Total |
28,100 | 11.0 | 33.0 | 1.6 | 190 | 12.9 | 31.2 | 1.4 | 28,290 | 11.0 | 33.0 | 1.6 | 96 | 15.6 | 31.0 | 1.3 | ||||||||||||||||||||||||||||||||||||||||||||||||
May 2024-RESERVES(1)
| Proven Reserves | Probable Reserves | Total Reserves | ||||||||||||||||||||||||||||||||||||||||||||||
| Amount | %SiO2 | %CaO | %Al2O3 | Amount | %SiO2 | %CaO | %Al2O3 | Amount | %SiO2 | %CaO | %Al2O3 | |||||||||||||||||||||||||||||||||||||
| Limestone |
||||||||||||||||||||||||||||||||||||||||||||||||
| Pennsuco(2) |
240,886 | 13.71 | 46.4 | | 193,180 | 18.29 | 43.6 | | 434,066 | 15.75 | 45.15 | | ||||||||||||||||||||||||||||||||||||
| Roanoke(3) |
36,000 | 7.8 | 48.5 | 1.7 | 4,100 | 7.6 | 47.9 | 1.2 | 40,100 | 7.78 | 48.54 | 1.65 | ||||||||||||||||||||||||||||||||||||
| Total |
276,886 | 12.95 | 48.5 | 1.7 | 197,280 | 18.07 | 47.9 | 1.2 | 474,166 | 15.08 | 48.54 | 1.65 | ||||||||||||||||||||||||||||||||||||
| Dolostone |
||||||||||||||||||||||||||||||||||||||||||||||||
| Pennsuco(2) |
| | | | | | | | | | | | ||||||||||||||||||||||||||||||||||||
| Roanoke(3) |
3,200 | 15.8 | 31.4 | 1.43 | 68 | 18.3 | 30.8 | 1.16 | 3,268 | 15.85 | 1.42 | 31.39 | ||||||||||||||||||||||||||||||||||||
| Total |
3,200 | 15.8 | 31.4 | 1.43 | 68 | 18.3 | 30.8 | 1.16 | 3,268 | 15.85 | 1.42 | 31.39 | ||||||||||||||||||||||||||||||||||||
| Shale |
||||||||||||||||||||||||||||||||||||||||||||||||
| Pennsuco(2) |
| | | | | | | | | | | | ||||||||||||||||||||||||||||||||||||
| Roanoke(3) |
12,000 | 19.7 | 38.7 | 4.4 | | | | | 12,000 | 19.7 | 38.7 | 4.4 | ||||||||||||||||||||||||||||||||||||
| Total |
12,000 | 19.7 | 38.7 | 4.4 | | | | | 12,000 | 19.7 | 38.7 | 4.4 | ||||||||||||||||||||||||||||||||||||
| (1) | Mineral Resources are exclusive of Reserves. Resources and Reserves are estimated as of May 24, 2024 for Pennsuco and May 1, 2024 for Roanoke. Tons are rounded to the nearest 1,000s. |
| (2) | For Pennsuco, price assumptions used for resource and reserve estimations are $136.00 per ton of cement and $21.00 per ton of blended aggregates. These prices were selected by the Qualified Person. Cement prices are based on figures from the USGS and aggregates prices are based on the average selling price for products at the site. There was no cutoff grade used for the Resource estimate, as nearly all material from the quarries can be used. The point of reference for our Reserve and Resource estimates was the limestone surge pile at the plant area. A recovery factor of 95% is utilized to convert in-situ volumetrics to recoverable resources and reserves and a process recovery of nearly 100% for the cement plant and 75% for the aggregates plant. |
| (3) | For Roanoke, price assumptions used for Resource and Reserve estimations are $136.00 per ton of cement. This price was selected by the Qualified Person and is based on figures from the USGS. There was no cutoff grade used for the Resource and Reserve estimate as nearly all carbonate material from the quarries can be used. The point of reference for our Reserve estimates was the raw material stack, located after the primary crusher. A recovery factor of 95% is utilized to convert in-situ volumetrics to recoverable resources and reserves and a process recovery of nearly 100% for the cement plant. |
Individual Property Disclosure
Pennsuco
Pennsuco is in Miami-Dade County, Florida and is positioned approximately 14 miles northwest of the city center of Miami. The site is comprised of 68 separate property tracts, all of which are owned by Titan America or
165
Table of Contents
through its subsidiary companies. In total the property encompasses 6,465 acres. The Pennsuco mine is located at coordinates 25°5237 N and 80°2227 W. The net book value of the Pennsuco mine, inclusive of mining and beneficiary equipment located in Medley, Florida as well as relevant mining tenements, as of December 31, 2023 was $253 million.
The property is bisected by the Florida Turnpike. The area west of the Turnpike is the area of the mining activity and the area to the east is the location of the aggregate plant, cement facility, ready-mixed concrete plant, and the concrete block plant, plus support facilities.
Pennsucos mining operations produce limestone by using draglines for the execution of the virgin reserves. For the lower portion of the reserves that draglines are unable to recover, the dredge mining method will be used. We currently expect to begin dredge mining in 2028. Limestone reserves are estimated across eleven pits. The primary crushing is now completed on-site at the Pennsuco quarry, thereby reducing traditional haul distances and minimizing mobile equipment required in favor of an extensive 3.5-mile electrified overland conveyor system connecting the mining operations with the cement and aggregate plants.
Our cement plant has a production capacity of 2.4 million tons and a cement storage capacity of approximately 72,000 tons across 12 silos. Additionally, the plant offers approximately 67,350 tons of clinker storage capacity across 10 silos. For additional information on our cement plant, see BusinessOur Reportable Segments.
Our aggregate plant is adjacent to our cement plant and its capacity is approximately 7 million tons per annum. The processing plant receives run-of-mine aggregates and produces both finished and fractionated products for blending rail shipments or special orders. The aggregate loadout includes truck and rail loading with a rail-loading capacity of 97 railcars per day and the ability to store more than 200 railcars on site. The Pennsuco rail yard is served by the FEC railroad, providing access to the network of terminals and aggregate distribution yards along the FEC. For additional information on our aggregate plant, see BusinessOur Reportable Segments.
Our ready-mix plant is adjacent to our cement plant and its capacity is 190,000 cubic yards of concrete per annum. This ready-mix plant sits on 2 acres of land and has two concrete mixers, enhancing the yards per hour capacity compared to other plants. For additional information on our ready-mix plant, see BusinessOur Reportable Segments.
Our concrete block plant is adjacent to our cement plant and is capable of producing over 20 million blocks annually. The concrete block plant contains four production units and produces both standard and specialty block, maintaining a mix of products in stock to reduce transportation costs and customer response time. For additional information on our concrete block plant, see BusinessOur Reportable Segments.
Mining Rights for Pennsuco
All Pennsuco mining rights are fully owned by deed by subsidiaries of Titan America SA.
166
Table of Contents
Location of Pennsuco operations
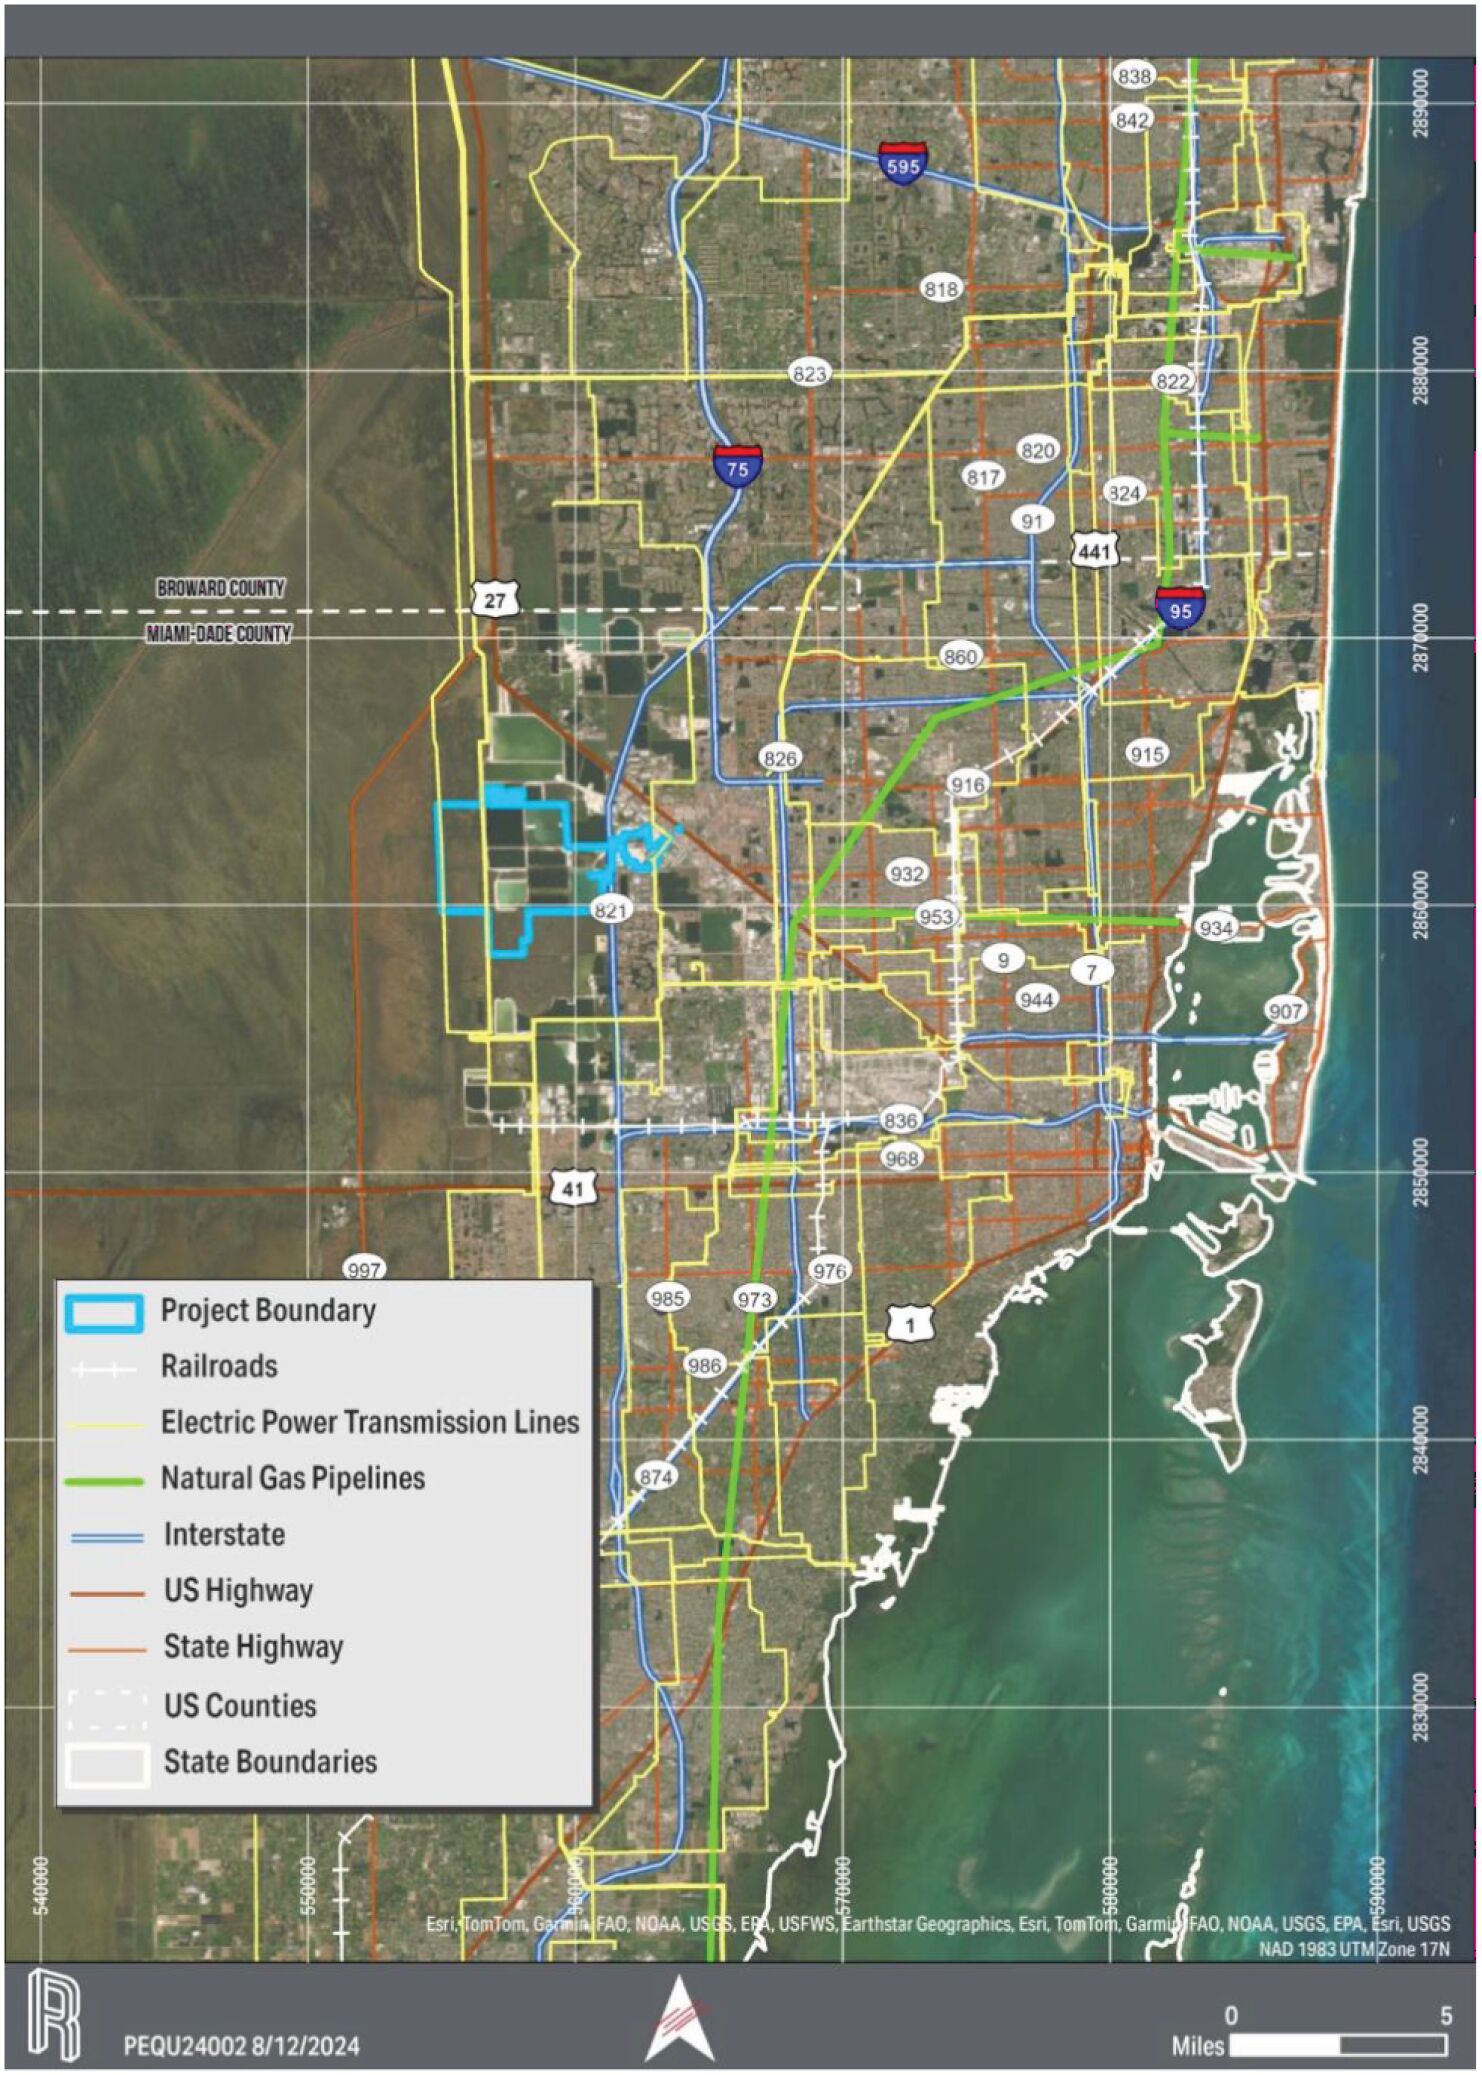
Infrastructure
The main entrance roads for the facility and throughout the cement, ready mix, and block operations are two-lane, paved roads. The roads around the plants, paved and unpaved, are two-way and approximately 30 feet wide, allowing standard commercial and personal vehicle traffic.
Natural gas service to the site was established in 2019-2020. A new regulation station at NE Hialeah Gate Station was built at the Florida Gas Transmission take-off point. The service distribution pipeline provides resilient
167
Table of Contents
service to the facility. The system was designed and tested to serve the cement plants full load (100% natural gas firing). All Titan-owned natural gas equipment was installed in 2020.
The site has rail access to the FEC Railway, which runs between Miami and Jacksonville. The rail yard at the site accommodates 260 rail cars, comprised of 21,000 feet of rail tracks and switches.
Florida Power and Light (FPL) provides electric service to the site from the 165 MW capacity Pennsuco Substation. This substation supplies transmission-level voltage (230kV) to the Titan America-owned, 40 MW substation. In a transmission fault, the substation breakers trip, isolating the system, and our electrical feed is then transferred from other transmission sources within North and South Miami-Dade County. The Titan America-owned substation supplies power to the cement, aggregate, and quarry operations. This substation has three step-down transformers (from 230 kV to two units for 13.8 kV and one for 4.16 kV). The emergency power supply is delivered to the Titan America-owned substation. The four generators (4160 V, 1650 kW, 286 A each) can support critical loads and lighting services during a primary utility failure.
Natural gas is the primary fuel consumed by the cement operation; however, three alternative fuels are available for consumption: Tire-Derived Fuel, Processed Engineered Fuel, and recycled-used oils for use in the cement plant kiln and preheat system.
Two main fuel storage areas are on site, the main fuel farm and the quarry fuel tank. The main fuel farm contains two 10,000-gallon diesel tanks and one 2,000-gallon gasoline tank. The quarry fuel tank is a double-walled 10,000-gallon diesel tank. There are five backup generators with self-contained fuel tanks to provide electricity to operating equipment during power failures.
History
The site has been in operation as a cement production and aggregate facility since 1962 beginning with Maule Industries. It was obtained by Lone Star Florida Cement Inc. in 1978, Tarmac America Inc. in 1988, Tarmac Florida Inc. in 2000 and Titan Florida LLC in 2004.
Summary of Resources and Reserves
Pennsuco Summary of Mineral Resources as of May 24, 2024
| Mineral Assemblage (% of materials) |
||||||||||||
| Resource Category |
Limestone (thousand tons) |
Grades/qualities (%SiO2) |
Grades/qualities (%CaO) |
|||||||||
| Measured |
27,235 | 24.7 | 38.3 | |||||||||
| Indicated |
20,081 | 15.2 | 45.4 | |||||||||
| Measured + Indicated |
47,316 | 20.7 | 41.4 | |||||||||
| Inferred |
| | | |||||||||
|
|
|
|
|
|
|
|||||||
| Total Mineral Resources |
47,316 | 20.7 | 41.4 | |||||||||
|
|
|
|
|
|
|
|||||||
| (1) | There was no cutoff grade used for the resource estimate. |
| (2) | Price assumptions used for resource and reserve estimations are $136.00 per ton of cement and $21.00 per ton of blended aggregates. |
168
Table of Contents
Pennsuco Summary of Mineral Reserves as of May 24, 2024
| Mineral Assemblage (% of materials) |
||||||||||||
| Reserve Category |
Limestone (thousand tons) |
Grades/qualities (%SiO2) |
Grades/qualities (%CaO) |
|||||||||
| Proven |
240,886 | 13.7 | 46.4 | |||||||||
| Probable |
193,180 | 18.3 | 43.6 | |||||||||
|
|
|
|
|
|
|
|||||||
| Total Mineral Reserves |
434,066 | 15.8 | 45.1 | |||||||||
|
|
|
|
|
|
|
|||||||
| (1) | Mineral resources are exclusive of reserves. Price assumptions used for resource and reserve estimations are $136.00 per ton of cement and $21.00 per ton of blended aggregates. |
| (2) | A recovery factor of 95% is utilized to convert in-situ volumetrics to recoverable resources and reserves. |
As this is the first time that Resources and Reserves have been estimated for Pennsuco in accordance with subpart 1300 of Regulation S-K, there is no Resource or Reserve information for prior dates for comparison.
The expected life of mine for Pennsuco quarries is 57 years.
The material assumptions and criteria for disclosing Resources and Reserves are described in the Technical Report Summary for this property, prepared by CPI (a Qualified Person, as defined in subpart 1300 of Regulation S-K), dated August 30, 2024, and filed as exhibit 96.1 to our registration statement on Form F-1, in particular Sections 11 and 12.
The price assumptions selected by the Qualified Person and are based on figures from the USGS for cement prices and aggregates prices are based on the average selling price for aggregate products at the site. There was no cutoff grade used for the Resource estimate, as nearly all limestone from the quarries can be used. Reserves and Resources are defined by a complex optimization process which is explained in detail in Sections 11 and 12 of the Pennsuco TRS. The point of reference for our Reserve and Resource estimates was the limestone surge pile at the plant.
The limestone material mined on site is suitable for both cement and construction aggregate production. As such, a true cut-off grade does not exist, but we have set a raw mix target of 12 percent SiO2 for cement plant usage. The low silica upper part of the deposit defined by geology and geochemistry has a mean of 6.47 percent with a standard deviation of 1.23 percent, and this material can be used to meet the targeted 12 percent SiO2. No grade considerations exist for limestone use as construction aggregate. Economic cut-off is not a factor because all material has approximately the same strip ratio. All Resources are converted to recoverable at the surge pile utilizing a 95% recovery. There is a 5% loss attributed to mining and primary crushing of the material.
For reporting mineral resources, each drill hole data point within the model was defined with an influencing area or radius of influence (ROI) for Mineral Resource classification into either Inferred, Indicated or Measured categories in increasing levels of confidence. The ROI for each category is listed as follows: (i) Inferred 5,280 ft, (ii) Indicated 2,640 ft and (iii) Measured 1,320ft.
Pennsuco has decades of operating and of sales history. The market and economics are detailed in Section 17 and 19 of Pennsuco TRS. The majority of the Resources are converted to Reserves and details of the economic parameters are found in Section 12 of Pennsuco TRS. The modifying factors applied to convert Resources to Reserves were (i) owned property, (ii) permit status with federal, state and local government, (iii) detailed mine planning with well understood mining methodology, (iv) Economic viability and (vi) engineering study of mining and economic feasibility of dredge mining.
Condition of Property
The Pennsuco property spans multiple land sections and platted subdivisions and is bisected by the Florida Turnpike with the mining activity occurring west of the turnpike in unincorporated Miami-Dade County and the cement and aggregates processing plants located on the east side of the turnpike in the Town of Medley, Miami-Dade County.
169
Table of Contents
Mining operations are located over the Biscayne Aquifer and the Northwest Wellfield Protection Areas. Due to the proximity to these areas, there are restricted uses to protect the drinking water supply. Allowable land uses within the Northwest Wellfield include limestone quarrying, rock crushing, and aggregate plants, but not concrete batch plants. Fuels and lubricants are allowed to be used in the rock mining operation. However, a variance from the Environmental Quality Control Board would be needed for the use of hazardous materials other than fuels and lubricants and for generating hazardous and liquid wastes. In addition to these restrictions, there are several Miami-Dade County reservations and setbacks associated with canals and levees on or near the property and two high-voltage electricity transmission lines cross the mining area from north to south. These power lines are located on either Titan America property with an easement to Florida Power or on Florida Power-owned property. There are rights-of-way access points across this power line Assessment of title commitments rendered no risks or encumbrances that preclude the proposed activity on the site.
Numerous drilling campaigns have been completed at the site. For additional information, see Exhibit 96.1 Technical Report Summary on the Pennsuco operations of this registration statement.
Roanoke
The Roanoke site is in Botetourt County, Virginia and currently consists of approximately 2,589 acres controlled by Titan America. The nearest major city is Roanoke, Virginia, 13.5 miles south from the site. The site is the accumulation of 24 tax parcels totaling approximately 2,567 acres. The Roanoke mine is located at coordinates 37°2743 N, 79°5942 W. The net book value of the Roanoke mine, inclusive of mining and beneficiary equipment located in Botetourt County, Virginia as well as relevant mining tenements, as of December 31, 2023 was $97 million.
The mining rights for Roanoke are shown in the table and figure below.
The mining operations at Roanoke consist of the Catawba Farm quarry, where we produce limestone and dolostone, and the Lone Star East quarry, where we produce limestone and dolostone. All mineral extraction is used for cement production; materials from the two active quarries are blended based on their chemical composition.
Our cement plant has a production capacity of 1.5 million tons and a cement storage capacity of approximately 90,000 tons across 38 silos. Additionally, the plant offers approximately 50,000 tons of clinker storage capacity across three silos. For additional information on our cement plant, see BusinessOur Reportable Segments.
Mining Rights for Roanoke
All Roanoke mining rights are fully owned by deed by subsidiaries of Titan America SA.
170
Table of Contents
Location of Roanoke operations
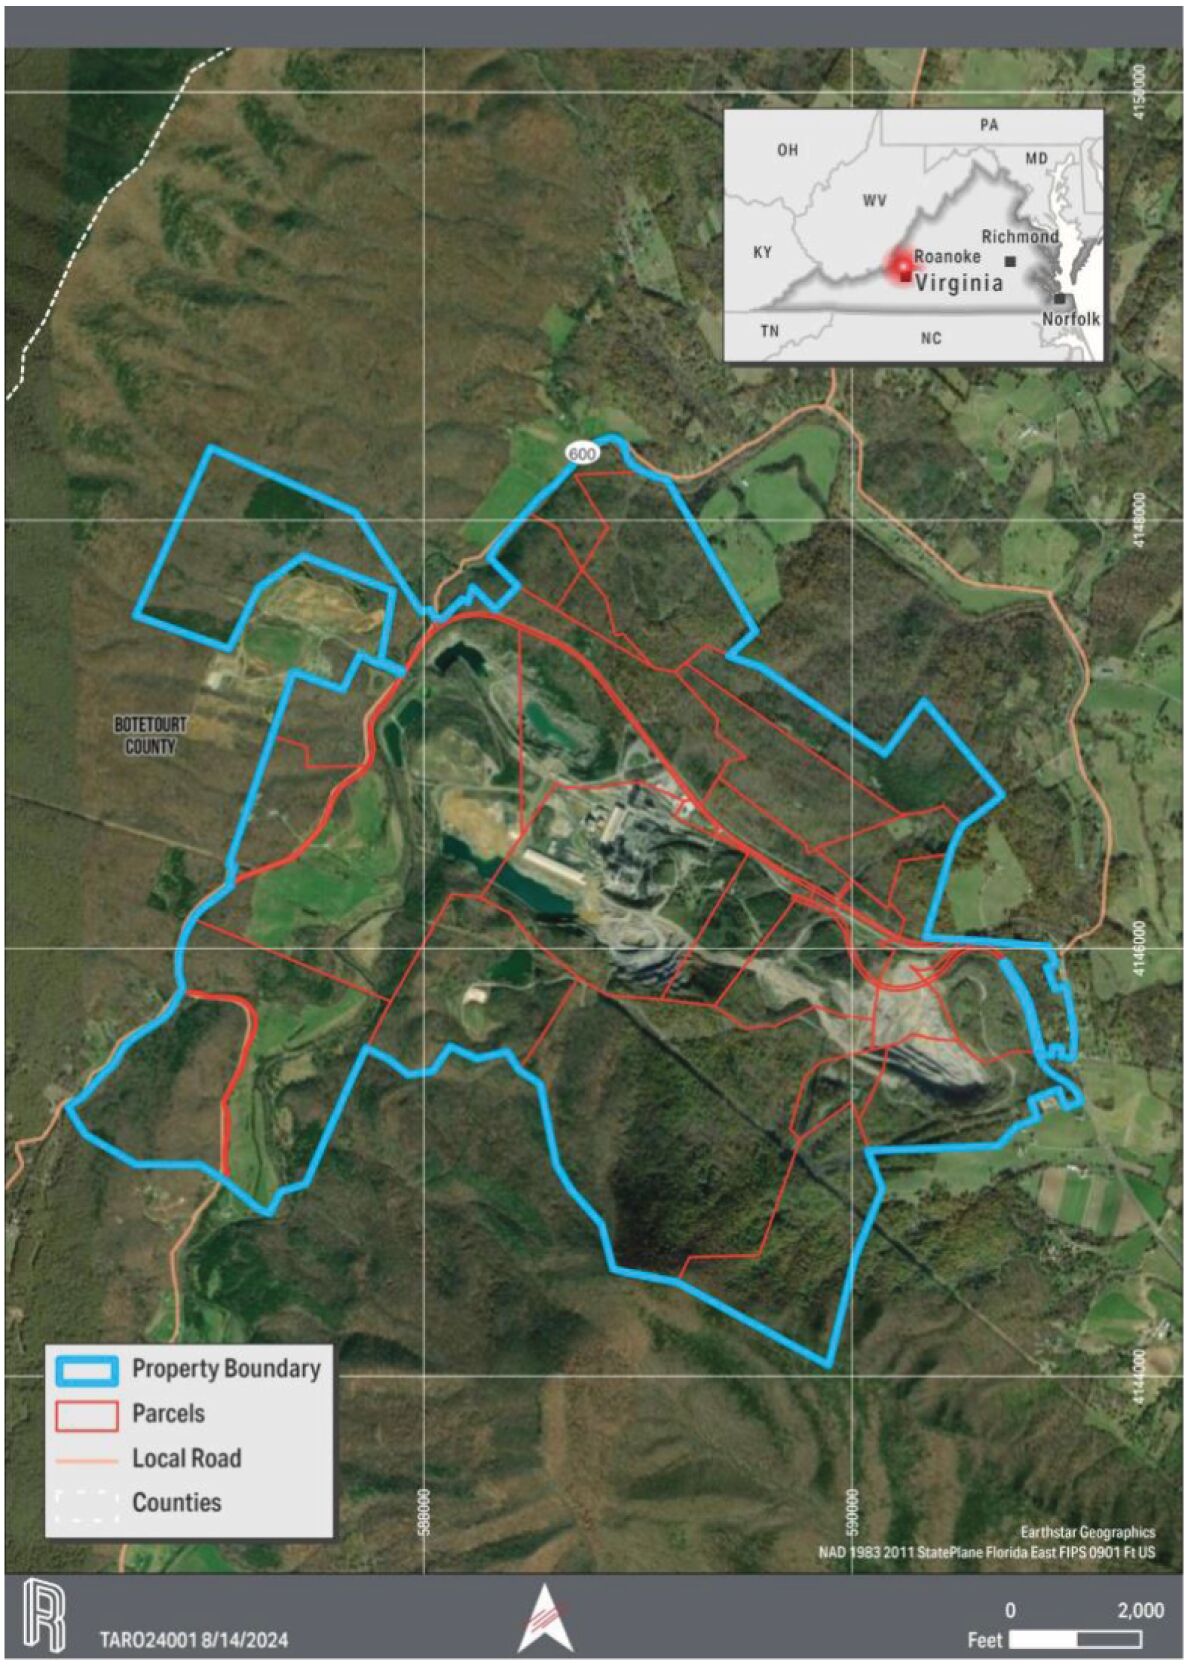
Infrastructure
The site has over 16,000 feet of rail track, which is serviced by Norfolk Southern. The rail infrastructure allows for both inbound and outbound transportation of supplies and cement products.
Roanoke Gas Company (RGC) is the public natural gas utility that services the site. RGCs distribution system is fed by Columbia Gas Transmission (interstate gas producer) at a gate station in Eagle Rock, VA., at a design flowrate of five hundred dekatherms per hour. The site also includes redundant runs of piping and equipment in the case of maintenance or a malfunction.
Electrical power is provided to the site by Appalachian Power Company. Two 138 kV circuits, running in a redundant loop, feed the site. The 138 kV circuits terminate at the Lone Star Mount Union 69 kV substation.
The quarry has a 20,000-gallon diesel fuel tank for its mobile equipment located near the equipment ready line. In addition, close to the maintenance shop, there is one 1,000-gallon diesel tank and one 1,000-gallon gasoline tank.
171
Table of Contents
The potable water system consists of a drilled well, a 25,000-gallon steel storage tank. The 125-foot well has a 6-inch casing grouted to a depth of 56 feet. A submersible pump powered by a 3-hp electric motor discharges water from the well to the storage tank through a 4-inch line.
The kiln and calciner consume alternative fuels which include shredded tires, wood chips and sawdust. The site system includes a receiving hopper, a silo for storage and a network of screw conveyors that transport the material has storage in the silo for shredded tires or wood chips.
History
The site has been in operation as a cement production and aggregate facility since 1951 beginning with Lone Star Cement Corporation. It was obtained by Roanoke Cement Company in the 1960s and Titan America purchased a controlling interest in Roanoke Cement Company in 1992. In 2000, Titan America assumed full ownership of Roanoke Cement Company.
Summary of Resources and Reserves
Roanoke Summary of Mineral Resources as of May 1, 2024
| Mineral Assemblage (% of Minerals) | ||||||||||||||||
| Resource Category |
Material (thousand tons) |
Grades/ qualities (%SiO2) |
Grades/ qualities (%Al2O3) |
Grades/ qualities (%CaO) |
||||||||||||
| Limestone |
||||||||||||||||
| Measured |
84,000 | 8.9 | 1.8 | 47.7 | ||||||||||||
| Indicated |
| | | | ||||||||||||
| Measured + Indicated |
84,000 | 8.9 | 1.8 | 47.7 | ||||||||||||
| Inferred |
| | | | ||||||||||||
|
|
|
|
|
|
|
|
|
|||||||||
| Total |
84,000 | 8.9 | 1.8 | 47.7 | ||||||||||||
| Dolostone |
||||||||||||||||
| Measured |
28,100 | 11.0 | 1.6 | 33.0 | ||||||||||||
| Indicated |
190 | 12.9 | 1.4 | 31.2 | ||||||||||||
| Measured + Indicated |
28,290 | 11.0 | 1.6 | 33.0 | ||||||||||||
| Inferred |
96 | 15.6 | 1.3 | 31.0 | ||||||||||||
|
|
|
|
|
|
|
|
|
|||||||||
| Total |
28,386 | 11.0 | 1.6 | 33.0 | ||||||||||||
|
|
|
|
|
|
|
|
|
|||||||||
| (1) | There was no cutoff grade used for the resource estimate. |
| (2) | Mineral Resources are exclusive of mineral Reserves. Price assumptions used for resource estimations are $136.00 per ton of cement. |
Roanoke Summary of Mineral Reserves as of May 1, 2024
| Mineral Assemblage (% of Minerals) | ||||||||||||||||
| Quarry/Reserve Category |
Material (thousand tons) |
Grades/ qualities (%SiO2) |
Grades/ qualities (%Al2O3) |
Grades/ qualities (%CaO) |
||||||||||||
| Catawba Farm Quarry Limestone |
||||||||||||||||
| Proven |
23,000 | 8.91 | 1.92 | 48.0 | ||||||||||||
| Probable |
||||||||||||||||
| Total: |
23,000 | 8.91 | 1.92 | 48.0 | ||||||||||||
|
|
|
|
|
|
|
|
|
|||||||||
| Catawba Farm Quarry Dolostone |
||||||||||||||||
| Proven |
1,600 | 18.30 | 1.16 | 30.8 | ||||||||||||
| Probable |
68 | 18.30 | 1.16 | 30.8 | ||||||||||||
| Total: |
1,668 | 18.30 | 1.16 | 30.8 | ||||||||||||
|
|
|
|
|
|
|
|
|
|||||||||
| Lone Star East Quarry Limestone |
||||||||||||||||
| Proven |
13,000 | 5.70 | 1.30 | 49.4 | ||||||||||||
172
Table of Contents
| Mineral Assemblage (% of Minerals) | ||||||||||||||||
| Quarry/Reserve Category |
Material (thousand tons) |
Grades/ qualities (%SiO2) |
Grades/ qualities (%Al2O3) |
Grades/ qualities (%CaO) |
||||||||||||
| Probable |
4,100 | 7.60 | 1.20 | 47.9 | ||||||||||||
| Total: |
17,100 | 6.16 | 1.28 | 49.0 | ||||||||||||
|
|
|
|
|
|
|
|
|
|||||||||
| Lone Star East Quarry Dolostone |
||||||||||||||||
| Proven |
1,600 | 13.30 | 1.70 | 32.0 | ||||||||||||
| Probable |
||||||||||||||||
| Total: |
1,600 | 13.30 | 1.70 | 32.0 | ||||||||||||
|
|
|
|
|
|
|
|
|
|||||||||
| High Grade Shale Quarry |
||||||||||||||||
| Proven |
12,000 | 19.70 | 4.40 | 38.7 | ||||||||||||
| Probable |
||||||||||||||||
| Total: |
12,000 | 19.70 | 4.40 | 38.7 | ||||||||||||
| (1) | Mineral Resources are exclusive of Reserves. Price assumptions used for Resource and Reserve estimations are $136.00 per ton of cement. Mineral prices used in Reserve estimation are substantially in line with the prices for each of our products published quarterly by third-party industry consultancies. |
| (2) | A recovery factor of 95% is utilized to convert in-situ volumetrics to recoverable resources and reserves. |
As this is the first time that Resources and Reserves have been estimated for Roanoke in accordance with subpart 1300 of Regulation S-K, there is not Resource or Reserve information for prior dates for comparison.
The expected life of mine for Roanoke quarries is 27 years.
The material assumptions and criteria for disclosing mineral Resources and Reserves are described in the Technical Report Summary for this property, prepared by Continental Placer (a Qualified Person, as defined in subpart 1300 of Regulation S-K), dated August 30, 2024, and filed as exhibit 96.2 to our registration statement on Form F-1, in particular Sections 11 and 12.
Price assumptions selected by the qualified person and are based on figures from the USGS for cement prices. Reserves and Resources are defined by a complex optimization process which is explained in detail in the Roanoke TRS. There was no cutoff grade used for the Resource and Reserve estimate as nearly all material from the quarries can be used. The point of reference for the reserves and resources is the limestone surge pile raw material stack, located after the primary crusher and includes mining recovery of 95%.
Roanoke pre-blends raw feed at the primary crusher station to control quality. Operators stockpile materials of different lithologies, chemistries and material handling qualities (clayey or karst limestone) separately at the crusher station for blending. As a result of this practice, nearly all carbonate material from the quarries can be used.
As an ongoing operation with decades of sales history the market and economics is detailed in Section 17 and 19 of Roanoke TRS. The majority of the Resources are converted to Reserves and details of the economic parameters are found in Section 12 of Roanoke TRS. For reserves reporting, limestone mineral reserves are stated on a life of mine basis. Shale and dolostone mineral reserves represent the tons that will be consumed during the life of mine production schedule.
Condition of Property
The site is in Botetourt County, Virginia, approximately 13 miles from Roanoke. The site is the accumulation of 24 tax parcels totaling approximately 2,567 acres. Property ownership is under the control of Titan or its subsidiaries.
There several encumbrances located on the property. These encumbrances include: a high-voltage electricity transmission line owned by American Electric Power (AEP) that crosses the Catawba Farm proposed quarry, a
173
Table of Contents
conservation easement to the Blue Ridge Land Conservancy, Andy Layne Trail, which joins the Appalachian Trail, Virginia Route 779 (Catawba Road) will need to be relocated in the future for the extension of the Catawba Farm Quarry, and two cement kiln dust (CKD) landfills are located on the site. Assessment of title commitments rendered no risks or encumbrances that preclude the proposed activity on the site.
Numerous drilling campaigns have been completed at the site. For additional information, see Exhibit 96.2 Technical Report Summary on the Roanoke operations of this registration statement.
Internal Controls Disclosure
The analysis of our reserves and resources has been developed by Continental Placer, designated as our qualified person in collaboration with our personnel. Our management teams periodically review our reserves and resources by performing sub-surface exploration as part of our mine planning process. The modeling and analysis of our reserves and resources has been developed by the QP, experienced consultants and our personnel and reviewed by several levels of internal management. The development of such reserves and resources estimates, including related assumptions, was a collaborative effort between us and Continental Placer. This section summarizes the internal control considerations for our development of estimations, including assumptions, used in reserve and resource analysis and modeling.
When determining reserves and resources, as well as the differences between reserves and resources, the team developed specific criteria, each of which must be met to qualify as a reserve or resource, respectively. These criteria, such as demonstration of economic viability, legal right to mine and material quality, are specific and attainable. Continental Placer and our management agree on the reasonableness of the criteria for the purposes of estimating reserves and resources. Estimations using these criteria are either performed or reviewed and validated by Continental Placer.
Estimations and assumptions were developed independently for each material property. All estimates require a combination of historical data, key assumptions, parameters, subsurface exploration and material testing. Each site has developed quality control and quality assurance (QC/QA) procedures, which were reviewed by Continental Placer, to ensure the process for developing mineral resource and reserve estimates were sufficiently accurate. QC/QA procedures include independent checks (duplicates) on samples by third party laboratories, duplicate sampling and duplicate drilling, among other procedures. In addition, Continental Placer reviewed the consistency of historical production at each site as part of their analysis of the QC/QA procedures. The historical data was reviewed, evaluated and verified before use in developing resource and reserve models. Where possible, information and data from generally accepted industry sources, such as governmental resource agencies, were used to develop these estimations.
While the reserve (proven and probable) and mineral resource (measured, indicated and inferred) classification categories identify relative confidence of estimates, there is an inherent risk associated with such estimates. The risk stems from factors including geological complexity; the interpretation, interpolation and extrapolation of field, exploration, and laboratory data; changes in operating approach; macroeconomic and market conditions and new data, among other factors. The capital, operating and economic analysis estimates rely on a range of assumptions and forecasts that are subject to change. We base estimates on information known at the time of determination and regularly reevaluate the basis of the estimates and estimates themselves whenever new information indicates a material change in resources and/or reserves at any of our sites.
Legal Proceedings
From time to time we may become involved in legal proceedings or be subject to claims arising in the ordinary course of our business. We are not presently a party to any legal proceedings that, if determined adversely to us, would individually or taken together have a material adverse effect on our business, results of operations, financial condition or cash flows. Regardless of the outcome, litigation can have an adverse impact on us because of defense and settlement costs, diversion of management resources and other factors.
174
Table of Contents
Directors, Director Nominees and Executive Officers
The following table sets forth information concerning TASAs directors and director nominees and our executive officers as of the date of this prospectus. Upon the completion of this offering, TASAs board of directors will increase from four to seven members and the directors listed under Biographical Information Regarding Our Directors Effective Upon Completion of this Offering will replace TASAs current board of directors, with the exception that Michael Colakides and Bill Zarkalis will remain on the board of directors. The business address for TASAs directors is 1000 Bruxelles, Square de Meeûs 37, Belgium and the business address for our executive officers is 5700 Lake Wright Drive, Suite 300, Norfolk, Virginia 23502.
| Name | Age | Position | ||||
| Michael Colakides(2)(3)(6)(7) |
70 | Chairman of the Board of Directors | ||||
| Nikolaos Birakis(5) |
54 | Director | ||||
| Nikos Andreadis(5) |
45 | Director | ||||
| Grigoris Dikaios(5) |
65 | Director | ||||
| Bill Zarkalis(3)(6) |
63 | Chief Executive Officer and Director Nominee | ||||
| Larry Wilt |
60 | Chief Financial Officer | ||||
| John Christy |
66 | Chief Legal Counsel | ||||
| Dan Quirk |
55 | Chief Accounting Officer | ||||
| Robert Paxton |
51 | Chief Human Resources Officer | ||||
| Kevin Baird |
57 | President, Titan Mid-Atlantic | ||||
| Randy Dunlap |
70 | President, Titan Florida | ||||
| Marcel Cobuz(2)(3)(6) |
53 | Director Nominee and Nominee for Chairman of the Board of Directors | ||||
| William John Antholis(2)(4)(6) |
59 | Director Nominee | ||||
| James Bachmann(1)(4)(6) |
56 | Director Nominee | ||||
| Sandra Santos(1)(4)(6) |
53 | Director Nominee | ||||
| Wim Van der Smissen(1)(4)(6) |
64 | Director Nominee | ||||
| (1) | Member of Audit Committee upon the completion of this offering. |
| (2) | Member of Nominating and Compensation Committee upon the completion of this offering. |
| (3) | Member of Finance Committee upon the completion of this offering. |
| (4) | Independent director under applicable NYSE standards. |
| (5) | Individual has given notice of intention to resign from position as member of our board of directors effective upon the completion of this offering. |
| (6) | Individual has been appointed to serve as a member of our board of directors effective upon the completion of this offering. |
| (7) | Mr. Colakides will remain a director but will step down as Chairman upon the completion of this offering. |
Biographical Information Regarding TASAs Directors and Our Executive Officers
Michael Colakides has been a director since 2024 and served as Chairman of the board of directors prior to the completion of this offering. Mr. Colakides has served since 2014 as Chief Financial Officer and executive member of the board of directors of Titan Cement Company S.A. and Titan Cement International SA since 2014 and as Managing Director of Titan Cement International SA since 2019. Mr. Colakides served as Deputy Chief Executive OfficerGroup Risk Executive Officer of EFG Eurobank Ergasias S.A. from 2007 to 2013. Prior to joining EFG Eurobank Ergasias S.A., Mr. Colakides served as Vice-Chair and Managing Director of Piraeus Bank S.A. from 2000 to 2007. Before joining Piraeus Bank S.A., Mr. Colakides served as Group Chief Financial Officer and executive member of the board of directors of Titan Cement Company S.A. from 1994 to 2000. Mr. Colakides started his career in banking and held various senior leadership positions in corporate banking for Citibank Greece from 1979 to 1993. Since November 2021, Mr. Colakides has held the position of non-executive chairman of Alpha Bank Cyprus. Mr. Colakides holds a bachelor of science in economics from the London School of Economics and master of business administration from the London Business School.
175
Table of Contents
Nikolaos Birakis has been a director since 2024. Mr. Birakis has served as Finance Director Greek Region and Group Tax Director for Titan Cement Group since 2019. Mr. Birakis has also served as a Board Member of Titan Cement Company S.A. since 2019. Mr. Birakis joined Titan Group in 2017 and until 2019 he held the position of FinanceBusiness Initiatives Director. Before joining Titan Group, he held the Group Chief Financial Officer position for the Raycap Group for 18 years. Mr. Birakis holds a bachelor of science in economics from the University of Athens and a master of business administration from Bayes Business School.
Nikos Andreadis has been a director since 2024. Mr. Andreadis has served as Director and Board Member for Titan Global Finance PLC, UK since 2017. Mr. Andreadis joined Titan Group in 2014, where he has served as Group Treasurer since 2017 and has been appointed as a board member of Titan Cement Company S.A. since 2019. Prior to joining Titan Cement Company S.A., Mr. Andreadis worked in corporate banking for EFG Eurobank Ergasias S.A. from 2008 to 2014 and in the business development division of the Europe, Middle East, and Africa operations of Acer Inc., a Taiwanese multinational hardware and electronics corporation, from 2005 to 2007. Mr. Andreadis holds a bachelor of science and master of science in electrical and computer engineering from University of Patras, Greece, a master of science in finance from Imperial College Business School and an executive diploma in strategy, management and business administration from Alba Graduate Business School.
Grigoris Dikaios has been a director since 2024. Mr. Dikaios has served as Chief Financial Officer for Titan Cement International SA since 2019 and in various senior leadership roles in finance, including the positions of Group Treasurer and Finance Director Greece Region, from 1996 to 2018. Mr. Dikaios has been a Director and Board Member of Titan Global Finance PLC, UK since 2022. Prior to joining Titan Cement Company S.A., Mr. Dikaios worked for Citibank Greece, in corporate banking from 1987 to 1996. Mr. Dikaios holds a bachelor of science in economics from the National University of Athens and a master of business administration from the University of Cincinnati.
Bill Zarkalis has served as the President and Chief Executive Officer of Titan America LLC since he joined the company in 2014 and has accepted our director appointment effective upon completion of this offering. Prior to Titan America, Mr. Zarkalis served as Titan Cement Company S.A.s Chief Financial Officer from 2010 to 2014 and as Executive Director of Business Development and Strategic Planning from 2008 to 2010. Prior to joining Titan Cement Company S.A. in 2008, Mr. Zarkalis served in a number of global business leadership roles with the Dow Chemical Company. Mr. Zarkalis has served since 2010 as a member of the Executive Committee and board of directors of Titan Cement Company S.A. and Titan Cement International SA. Mr. Zarkalis holds a master of science in chemical engineering from The National Technical University of Athens and a master of science in chemical engineering from Pennsylvania State University.
Larry Wilt has served as the Chief Financial Officer of Titan America LLC since 2000. Prior to Titan America, Mr. Wilt served as Tarmac America, Inc.s Corporate Controller from 1996 to 2000 and as Manager, Internal Audit from 1995 to 1996. Prior to joining Tarmac America, Inc. in 1995, Mr. Wilt worked for Ernst & Young LLP as a Senior Manager. Mr. Wilt holds a bachelor of science degree in commerce from the University of Virginia and is a Certified Public Accountant in Virginia and Georgia.
John Christy has served as the Chief Legal Counsel of Titan America LLC since he joined the company in 2016. Prior to Titan America, Mr. Christy served as Owens Cornings Senior Vice President, General Counsel and Secretary from 2011 to 2015 and in various senior leadership roles in the law department from 1996 to 2011. Prior to joining Owens Corning, Mr. Christy worked in private legal practice at the Chicago firm of Ungaretti & Harris LLP. Mr. Christy holds a bachelor degree in history from Dartmouth College and a juris doctor from the Northwestern University, Pritzker School of Law.
Dan Quirk has served as the Chief Accounting Officer of Titan America LLC since November 2024. Prior to joining Titan America, Mr. Quirk was the Executive Vice President of Finance and Accounting for a global public company vehicle manufacturer based in California. Prior to that, Mr. Quirk served as an Assurance Partner at Ernst & Young LLP in Virginia for over 30 years, selecting early retirement in June 2023. During his seasoned career, Mr. Quirk helped a variety of Fortune 500 companies, as well as emerging growth companies, navigate
176
Table of Contents
through the complexities associated with critical business risk assessments, refinements to process flows and internal controls, and business transformations (inclusive of mergers, acquisitions and IPOs). Mr. Quirk holds a bachelor of science degree in accounting from Washington & Jefferson College in PA, is a Certified Public Accountant in VA and MD and is a member of the American Institute of Certified Public Accountants. Mr. Quirk has also served as an Associates Board Member for the Wolf Trap Foundation in Vienna, VA since 2022.
Robert Paxton will begin serving as the Chief Human Resources Officer of Titan America LLC on January 1, 2025. Prior to joining Titan America, Mr. Paxton served as Senior Vice President, Human Resources and Chief Human Resources Officer, at Masonite International Corporation from 2018 to 2024. Prior to Masonite International Corporation, Mr. Paxton served as Owens Cornings Vice President, Business Integration from 2016 to 2018, Vice President, Human Resources from 2013 to 2016 and Vice President, Talent Management & Corporate Human Resources from 2010 to 2013. Prior to Owens Corning, Mr. Paxton served as Broadwind Energy Inc.s Senior Vice President, Human Resources from 2008 to 2010. Prior to Broadwind Energy Inc., Mr. Paxton held various human resources leadership roles with Whirlpool Corporation from 2002 to 2008, serving as Vice President, Global Human Resources from 2007 to 2008. Mr. Paxton has also served as Assistant Professor of Instruction in Management and was an Executive in Residence at Ohio University from August 2024 to December 2024. Mr. Paxton holds a bachelor of business administration in human resource management from Ohio University and a master of business administration from the University of Houston-Victoria.
Kevin Baird has served as Titan America LLCs President, Mid-Atlantic Business Unit since 2017. Previously, Mr. Baird served as Senior Vice President of Ready-Mix Operations and Florida Concrete Products from 2013 to 2017 as well as the Florida Business Units Vice President, Cement and Aggregate Operations, from 2011 to 2013. Prior to 2011, Mr. Baird held various engineering and operations management positions from 1999 to 2011. Mr. Baird holds a bachelor of science degree in electrical engineering from North Carolina State University.
Randy Dunlap has served as Titan America LLCs President, Florida Business Unit since 2014. Previously, Mr. Dunlap served as President of Separation Technologies and Essex Cement from 2010 to 2014 and in various senior leadership positions within the Separation Technologies business from 2005 to 2010. Prior to 2005, Mr. Dunlap held various senior leadership positions for Holcim (US) Inc. from 1990 to 2005. Mr. Dunlap holds a bachelor of business administration from the University of Iowa.
Biographical Information Regarding TASAs Directors Effective Upon Completion of this Offering
Marcel Cobuz has accepted our director appointment effective upon the completion of this offering and will be the Chairman of the board of directors upon the completion of this offering. Mr. Cobuz has served as an executive director on the board of directors of Titan Cement International SA since January 2023 and as Chairman of the Group Executive Committee of Titan Cement International SA since October 2022. Mr. Cobuz previously served as Chairman Designate and member of Titan Cement International SAs Group Executive Committee from July 2022 to September 2022. From 2018 through 2022, Mr. Cobuz served as a member of the Group Executive Committee of Holcim, a global building materials company based in Switzerland, and served as Holcims Head of Europe Region and Group Innovation. Mr. Cobuz holds an undergraduate degree in law from the University of Bucharest, studied economics in Bucharest and graduated from the Advanced Management Program at Harvard Business School.
William John Antholis has accepted our director appointment effective upon the completion of this offering. Mr. Antholis has served as Chief Executive Officer and a member of the board of directors of the Miller Center since 2015, a nonpartisan affiliate of the University of Virginia that explores how the American presidency addresses public policy challenges and engages scholars, practitioners and the public to solve problems. Mr. Antholis has also served as an independent director on the board of directors of Titan Cement International SA since 2018 and as a member of the board of directors of the Miller Center Foundation, a 501(c)3 non-profit, since 2015. Mr. Antholis also served as a trustee of the American College of Greece from 2015 to 2024. Previously, Mr. Antholis was Managing Director of the Brookings Institution from 2004 through 2014. He has also served in various
177
Table of Contents
national security positions at the U.S. State Department and the White House. Mr. Antholis holds a PhD in politics from Yale University and a bachelor degree in government and foreign affairs from the University of Virginia.
James Jay Bachmann has accepted our director appointment effective upon the completion of this offering. Mr. Bachmann has served as President of the U.S. Interior Products Group of CertainTeed Corporation, a North American manufacturer of building materials and subsidiary of French multi-national manufacturer of building materials Compagnie de Saint-Gobain S.A., since 2022 and as General Manager of CertainTeed US Gypsum from 2020 to 2022. Mr. Bachmann served as Chief Executive Officer and Board Member of Continental Building Products, Inc., a publicly traded gypsum manufacturing company, from 2014 until its acquisition by Compagnie de Saint-Gobain S.A. in 2020. Mr. Bachmann also served as a Board Member of Go Labs, Inc. from July 2024 to October 2024. Mr. Bachmann received a bachelor of science in business administration from Georgetown University.
Michael Colakides has been a director since 2024 and served as Chairman of the board of directors prior to the completion of this offering. Mr. Colakides has served since 2014 as Chief Financial Officer and executive member of the board of directors of Titan Cement Company S.A. and Titan Cement International SA since 2014 and as Managing Director of Titan Cement International SA since 2019. Mr. Colakides served as Deputy Chief Executive OfficerGroup Risk Executive Officer of EFG Eurobank Ergasias S.A. from 2007 to 2013. Prior to joining EFG Eurobank Ergasias S.A., Mr. Colakides served as Vice-Chair and Managing Director of Piraeus Bank S.A. from 2000 to 2007. Before joining EFG Eurobank Ergasias S.A., Mr. Colakides served as Group Chief Financial Officer and executive member of the board of directors of Titan Cement Company S.A. from 1994 to 2000. Mr. Colakides started his career in banking and held various senior leadership positions in corporate banking for Citibank Greece from 1979 to 1993. Since November 2021, Mr. Colakides has held the position of non-executive chairman of Alpha Bank Cyprus. Mr. Colakides holds a bachelor of science in economics from the London School of Economics and master of business administration from the London Business School.
Sandra Santos has accepted our director appointment effective upon the completion of this offering. Ms. Santos has served as a director on the board of directors of Titan Cement International SA since May 2024, and has served on its Strategic Committee since July 2024. Ms. Santos served as Chief Executive Officer of BA Glass B.V., a multinational glass packaging producer, from 2014 to 2024 and as its Chief Financial Officer from 2007 to 2014. Since March 2024, she has served as a director of BA Glass B.V. Ms. Santos has also served as a director of EDP, S.A., a public renewable energy company based in Portugal, and a member of its USA Affairs Committee since 2024. From 2019 to present, Ms. Santos has also served as a member of the board of directors of the Navigator Company, a public paper and pulp company based in Portugal. Ms. Santos was previously a member of the board of directors of Banco Português de Investimento S.A. from 2023 to 2024, where she served on the Audit Committee and chaired the Nominations and Remuneration Committee. Ms. Santos holds a master of business administration from Porto Business School and an undergraduate degree in business studies from Porto University.
Wim Van der Smissen has accepted our director appointment effective upon the completion of this offering. Mr. Van der Smissen has served as a part-time Chief Financial Officer at the CFO Centre, which offers CFO services to a wide-range of small and medium enterprises, since 2020. Prior to the CFO Centre, Mr. Van der Smissen was Vice President Finance & IT Europe at Bemis Europe Holdings, S.A. (later Amcor plc), a global packaging solutions company listed on the Australian Securities Exchange and the New York Stock Exchange, from 2010 to 2020, as well as Chief Financial Officer at Reynaers Aluminium from 2007 to 2010. Between 1983 and 2006, Mr. Van der Smissen worked at Unilever PLC where he held several finance and IT roles at the Belgian and European level, with his ultimate position being Finance Director for Unilever Belgium. Mr. Van der Smissen has served as a member of the board of directors of his own management company Be Change bv, from February 2008 to present. Mr. Van Smissen also served as a member of the board of directors of Mishalle nv, a family business that makes gear shaper cutters, from January 2021 to June 2024, of the Plastics and Cardboard Federation Belgium from 2012 to 2020 and of Bemis Europe Holdings, S.A. from 2010 to 2020. Mr. Van der Smissen was a member of the Advisory Board of Lipa Logistics from 2018 to 2020. Mr. Van der Smissen holds a
178
Table of Contents
master in business administration with a major in information technology from Katholieke Universiteit Leuven and is a Certified Board Director, having completed courses in board effectiveness and director effectiveness at Guberna, the Belgian Directors Institute.
Bill Zarkalis has accepted our director appointment effective upon the completion of our initial public offering. Mr. Zarkalis has served as the President and Chief Executive Officer of Titan America LLC since he joined the company in 2014. Prior to Titan America SA, Mr. Zarkalis served as Titan Cement Company S.A.s Chief Financial Officer from 2010 to 2014 and as Executive Director of Business Development and Strategic Planning from 2008 to 2010. Prior to joining Titan Cement Company SA in 2008, Mr. Zarkalis served in a number of global business leadership roles with the Dow Chemical Company. Mr. Zarkalis has served since 2010 as a member of the Executive Committee and board of directors of Titan Cement Company S.A. and Titan Cement International SA. Mr. Zarkalis holds a bachelor of science in chemical engineering from The National Technical University of Athens and a master of science in chemical engineering from Pennsylvania State University.
Corporate Governance
Composition of TASAs Board of Directors
Under TASAs articles of association, TASAs board of directors will consist of at least three directors. Upon the completion of this offering, TASAs board of directors will be comprised of seven directors. The directors will be elected at the annual general meeting of shareholders and the term of office for each of the directors will expire at the time of our next annual general meeting of shareholders.
Director Independence and Controlled Company Exception
As a foreign private issuer and controlled company, under the listing requirements and rules of the NYSE, TASA will not be required to have a board of directors comprised of a majority of independent directors, except that TASAs audit committee will be required to consist fully of independent directors, subject to certain phase-in schedules. TASA does not expect to rely on this exemption and expects a majority of its board of directors will be independent.
TASAs board of directors will designate which directors qualify as independent directors as determined under the current listing requirements and rules of the NYSE and taking into account any applicable committee independence standards. In making such determination, TASAs board of directors will consider the relationships that each non-executive director has with us and all other facts and circumstances TASAs board of directors deems relevant in determining each directors independence.
As a controlled company, under the listing requirements and rules of the NYSE, TASA is also exempted from the requirement that its director nominations be made, or recommended to the full board of directors, by its independent directors or by a nominations committee that is composed entirely of independent directors and that it adopts a written charter or board resolution addressing the nominations process. TASA intends to utilize these exemptions and expects that its controlling shareholder will nominate directors.
Code of Conduct
TASA will adopt a code of conduct (the Code of Conduct) in connection with this offering applicable to all of TASAs directors, officers and employees, which is a code of ethics as defined in Item 16B of Form 20-F promulgated by the SEC. The Code of Conduct will set out TASAs fundamental values and standards of behavior that are expected from TASAs directors, officers and employees with respect to all aspects of TASAs business. The objective of the Code of Conduct will be to provide guidelines for maintaining TASAs integrity, reputation and honesty with a goal of honoring others trust in us at all times.
Upon the effectiveness of this registration statement of which this prospectus forms a part, the full text of the Code of Conduct will be posted on our website at www.titanamerica.com. Information contained on, or that can
179
Table of Contents
be accessed through, our website does not constitute a part of this prospectus and is not incorporated by reference herein. Under Item 16B of the SECs Form 20-F, if a waiver or amendment of the Code of Conduct applies to TASAs principal executive officer, principal financial officer, principal accounting officer or controller and relates to standards promoting any of the values described in Item 16B(b) of Form 20-F, we will disclose such waiver or amendment on our website in accordance with the requirements of Instruction 4 to such Item 16B.
TASAs board of directors will be responsible for reviewing and evaluating the Code of Conduct periodically. TASAs board of directors will also monitor compliance with our Code of Conduct and will be responsible for considering any waivers therefrom.
Committees of the Board of Directors
Upon completion of this offering, TASA will have an Audit Committee, Nominating and Compensation Committee and a Finance Committee, with each committee having a written charter.
Audit Committee
The audit committee of TASAs board of directors (the Audit Committee) will be comprised of Sandra Santos, Wim Van der Smissen and Jay Bachmann, and will be chaired by Sandra Santos. TASAs board of directors will determine that each of these directors meets the independence requirements, including the heightened independence standards for members of the Audit Committee, of the NYSE and the SEC, or qualifies for a relevant exemption therefrom. TASA intends to avail itself of an exemption available to foreign private issuers to allow one non-independent, non-voting observer to serve on the committee. Michael Colakides will serve as the non-independent, non-voting observer to the Audit Committee under this exemption. TASAs board of directors will determine that the members of the Audit Committee are financially literate within the meaning of the NYSE rules. Sandra Santos will be identified as an Audit Committee financial expert as defined by the SEC rules. For a description of the education and experience of each member of the Audit Committee, see Biographical Information Regarding Our Directors Effective Upon Completion of this Offering.
TASAs board of directors will establish a written charter setting forth the purpose, composition, authority and responsibility of the Audit Committee, consistent with the rules of the NYSE and the SEC. The principal responsibilities and duties of the Audit Committee will include:
| | reviewing the effectiveness and adequacy of our internal controls; |
| | reviewing financial and accounting personnel succession planning; |
| | overseeing the financial reporting process and discussing with management and our independent registered public accounting firm the interim and annual financial statements that TASA files with the SEC; |
| | designing, implementing and overseeing the internal audit function; |
| | reviewing the effectiveness, scope and performance of activities of the independent registered public accounting firm and the internal audit function; |
| | reviewing significant changes in accounting policies; |
| | selecting the independent registered public accounting firm and confirming its independence; |
| | reviewing our policies with respect to risk assessment and risk management; |
| | reviewing with management our earnings releases; |
| | monitoring our compliance with legal and regulatory requirements; and |
| | pre-approving audit and non-audit services provided by the independent registered public accounting firm. |
180
Table of Contents
TASAs Audit Committee will have access to all of our books, records, facilities and personnel and may request any information about us as it may deem appropriate. It will also have the authority in its sole discretion and at our expense, to retain and set the compensation of outside legal, accounting or other advisors as necessary to assist in the performance of its duties and responsibilities.
TASAs Audit Committee will also review its policies and procedures for reviewing and approving related-party transactions, and it will be responsible for reviewing and approving all related-party transactions. For additional information, refer to Certain Relationships and Related Party TransactionsRelated Party Transactions Approval Policy.
Nominating and Compensation Committee
TASAs nominating and compensation committee of the board of directors (the Nominating and Compensation Committee) will be comprised of Michael Colakides, Marcel Cobuz and William Antholis and will be chaired by Marcel Cobuz. So long as the Titan Group beneficially owns more than a majority of the voting power for the election of directors and TASA remains a controlled company, it will not be required to have a Nominating and Compensation Committee comprised entirely of independent directors, and expects to have at least one non-independent director on its Nominating and Compensation Committee following the completion of this offering. For a description of the background and experience of each member of TASAs Nominating and Compensation Committee, see Biographical Information Regarding Our Directors Effective Upon Completion of this Offering. TASAs board of directors will establish a written charter setting forth the purpose, composition, authority and responsibility of the Nominating and Compensation Committee consistent with the rules of the NYSE and the SEC. The Nominating and Compensation Committees purpose will be to assist the board in its oversight of executive compensation, management development and succession, director nominations and compensation and executive compensation disclosure. The principal responsibilities and duties of the Nominating and Compensation Committee will include:
| | reviewing and approving compensation policies and practices for our executive officers; |
| | reviewing and approving corporate goals and objectives relevant to the compensation of our Chief Executive Officer and our other executive officers; |
| | reviewing as necessary our compensation programs, policies and practices with respect to risk assessment; |
| | reviewing performance and establishing the total compensation for our Chief Executive Officer and other senior executives; |
| | administering equity-based compensation plans or long-term incentive plans; |
| | reviewing compensation disclosure for inclusion in SEC filings; |
| | reviewing the terms of employment agreements, severance agreements, change in control agreements and other compensatory arrangements; |
| | reviewing and recommending to the board of directors the adoption of or changes to the compensation of the our directors; |
| | reviewing executive stock ownership guidelines and overseeing clawback, hedging and pledging policies. |
| | reviewing and recommending candidates for director, consistent with criteria identified by the board of directors; |
| | determining director independence; |
| | reviewing candidates recommended by shareholders; |
| | conducting the appropriate and necessary inquiries into the backgrounds and qualifications of potential director candidates; |
| | recommending members and chairs of the committees of the board of directors; |
181
Table of Contents
| | considering and making recommendations regarding the composition and size of the board of directors and determining the relevant criteria for board membership; |
| | reviewing the structure and composition of the committees of the board of directors to make recommendations to the board of directors regarding the appointment of directors to serve as members of each committee and the appointment of chairs of such committees; |
| | reviewing proposals submitted by shareholders for inclusion in our management information circular and recommending to the board of directors appropriate action; and |
| | in consultation with the board of directors overseeing retention, leadership development and succession planning for the Chief Executive Officer and other key executive officers. |
Refer to Executive Compensation for further information on the process by which compensation for our executive officers will be determined.
Finance Committee
TASAs finance committee of the board of directors (the Finance Committee) will be comprised of Bill Zarkalis, Marcel Cobuz and Michael Colakides and will be chaired by Michael Colakides. TASAs board of directors will establish a written charter setting forth the purpose, composition, authority and responsibility of the Finance Committee prior to the completion of this offering. The Finance Committees purpose will be to review our capital structure and capital allocation, financial policies, practices and strategies, and take such action and make such reports and recommendations to our board of directors as it deems advisable. For a description of the background and experience of each member of TASAs Nominating and Compensation Committee, see Biographical Information Regarding TASAs Directors Effective Upon Completion of this Offering.
Limitation on Liability and Indemnification Matters
Under Belgian law, TASAs directors may be liable for damages to TASA in case of improper performance of their duties. TASAs directors may be liable to TASA and to third parties for infringement of TASAs articles of association, the Belgian Code on Companies and Associations or, under certain circumstances, Belgian tort, bankruptcy, social security or tax laws. Under certain circumstances, directors may be criminally liable.
The Belgian Code on Companies and Associations sets a cap on the amount for which directors and persons entrusted with the daily management of a Belgian company can be held liable for damages. This cap ranges from EUR 125,000 to EUR 12,000,000 depending on the turnover and balance sheet of the relevant company. The cap is applicable both towards us and as to third parties. The cap benefits the group of directors and persons entrusted with the daily management who are the subject of the claim for damages as a whole and applies to each fact or set of facts likely to give rise to liability, regardless of the number of claimants or actions. The cap does not apply in case of habitual minor errors (i.e., a minor error which has been committed frequently and not occasionally), serious errors, fraudulent intent or intent to harm, and other specific exceptions.
We intend to obtain liability insurance for TASAs directors and our officers, including insurance against liability under the Securities Act of 1933, as amended. In addition to liability insurance cover, we intend to enter into agreements with our executive officers to provide contractual indemnification. With certain exceptions and subject to limitations on indemnification under Belgian law, these agreements will provide for indemnification for damages and expenses including, among other things, attorneys fees, judgments, fines and settlement amounts incurred by any of these individuals in any action or proceeding arising out of his or her actions in that capacity. Subject to these abovementioned limitations on indemnification under Belgian Law, we also intend to enter into agreements with our directors and the person entrusted with the daily management to provide for indemnification for attorneys fees and other expenses incurred by any of them in any action or proceeding arising out of his or her actions in his or her capacity as director or the person entrusted with the daily management.
182
Table of Contents
These agreements may discourage shareholders from bringing a lawsuit against TASAs directors and our executive officers for breach of their fiduciary duty. These provisions also may have the effect of reducing the likelihood of derivative litigation against directors and executive officers, even though such an action, if successful, might otherwise benefit us and our shareholders. Furthermore, a shareholders investment may be adversely affected to the extent we pay the costs of settlement and damage awards pursuant to these indemnification agreements.
Certain of TASAs non-employee directors may, through their relationships with their employers or partnerships, be insured and/or indemnified against certain liabilities in their capacity as members of our board of directors.
At present, we are not aware of any pending or threatened litigation or proceeding involving any of TASAs directors, our officers, employees or agents in which indemnification would be required or permitted.
183
Table of Contents
This section provides a discussion of the background and objectives of our compensation programs for our board of directors and senior executives.
Nominating and Compensation Committee and Role of Management
TASA will establish a Nominating and Compensation Committee prior to the completion of this offering. For more information, see ManagementNominating and Compensation Committee.
Our senior executives have no direct role in setting their own compensation.
The Nominating and Compensation Committee will regularly review our compensation policy in order to ensure continuous alignment with its principles, market trends and best practices. On an annual basis, the Nominating and Compensation Committee will recommend the levels of the annual remuneration of senior executives on the basis of their performance and responsibilities.
Management will assist the Nominating and Compensation Committee by providing information or by engaging external experts to share market data or expert advice needed or requested by the Nominating and Compensation Committee (such as our performance objectives and other relevant information) and by providing input and advice regarding potential changes to compensation programs and policies, and their impact on us and our senior executives.
Objectives and Design of Our Compensation Policy
TASAs Nominating and Compensation Committee intends to adopt a compensation policy that will be designed to attract, reward and retain qualified, high-caliber executives who drive our business strategy forward, build value for our shareholder through sustainable growth, with responsibility and integrity, and serve the needs of society, with respect for the environment.
The policy will be structured around providing competitive short-term cash compensation through base salaries and bonuses and long-term incentives (LTIs) to promote retention and growth.
Key Elements of Our Compensation Program
We expect that our compensation program will consist of three key elements: base pay, short-term (annual) incentives and LTIs. The Nominating and Compensation Committee will review these compensation elements regularly. The following describes the compensation arrangements that will generally be afforded to our senior executives, which will generally be sourced from the current, applicable plan documents and certain employment agreements that will contain terms and conditions related to compensation and benefits. The aggregate value of amounts paid or granted (as applicable) to our senior executives for the immediately preceding fiscal year is $6,396,243.
a) Base Pay. Based on market practices, we believe it is appropriate that a minimum portion of total direct compensation be provided in a form that is fixed, aiming to pay fairly and reasonably for the best and most appropriate person for the role, taking into account the level of responsibility, as well as the knowledge and experience required to deliver upon expectations, while ensuring that we pay no more than necessary, always supporting our long-term interests and ensuring sustainability. Base pay levels will be set considering pay at other companies of similar size in relevant markets for roles of similar scope and responsibility. Base pay will normally be reviewed, but not necessarily increased, annually. Decisions regarding base pay will be influenced by the individuals performance and experience, our performance, the individuals role and responsibilities and the geographic location of the individual.
184
Table of Contents
b) Short-Term (Annual) Cash Incentives. We believe that an annual incentive opportunity is necessary to attract and reward our senior executives for meeting annually set performance goals throughout our financial year. The aim of this compensation element is to focus on our short-term performance and to recognize the achievement of our annual performance targets at both a collective and an individual level, whilst safeguarding our safety standards. Short-term incentives for our senior executives will be based on a percentage of the employees base salary. The percentage relative to the Annual Base Salary (ABS) will increase with job size and is expected to reach up to 100% of ABS for on-target achievement.
The allocation of weight between collective and individual targets will depend on the job. Collective targets will comprise of financial and safety targets. Individual targets will be linked to the objectives in each executives specific areas of responsibility. In case of overachievement, the collective financial part of the short-term incentive will be capped at 130% of target and the individual part at 150% of target (no overachievement applies for the collective safety part).
The short-term cash incentive will be disbursed in the year subsequent to achieving the established targets as follows: the calculation of the short-term incentive will take place once a year and will be based on the annual business results of the previous year and the annual performance appraisals; the short-term incentive will be settled and delivered after the final business results have been officially announced, with no deferral requirements.
c) LTIs. We believe a long-term incentive program that comprises a substantial portion of each executives total direct compensation opportunity is necessary to attract, retain and reward our senior executives in consistency with market practices. The LTIs will provide an incentive to contribute to improving share performance in the long term, in alignment with the interests of the shareholders and delivering long-term sustainable performance.
Awards will be offered through a two-tiered long term incentive program: (a) Restricted Shares and (b) Performance Shares. Restricted Shares vest over time and Performance Shares vest based on the achievement of Company-determined performance metrics and, in each case, are generally subject to continued employment or service.
Security Ownership of Certain Beneficial Owners and Management
None of our senior executives or TASAs directors or director nominees holds any equity or equity-based incentive interests in the Company, and to the extent that changes, we will provide updates to our disclosure as required.
Under the new two-tiered long term incentive program, our senior executives are expected to retain, on a rolling five-year basis, at least 20% of their total vested awards. Our senior executives have five (5) years to reach this requirement from the later of (i) January 1, 2025 and (ii) their applicable date of hire.
Pension and Similar Retirement Benefits
We do not maintain a pension plan for our senior executives or directors. We sponsor a defined contribution retirement and 401(k) savings plan, which covers substantially all of our employees.
Employees
Our employee base for Titan America LLCs 2023 fiscal year consisted of 2,550 employees, spread across the United States. Our employee population is divided into our Florida business unit with 1,503 employees and our Mid-Atlantic business unit with 1,047 employees. Our headcount decreased from the end of fiscal year 2020 to the end of fiscal year 2021 from 2,315 to 2,303 because of joint venture employees in our Mid-Atlantic business unit leaving our headcount but increased to 2,388 by the end of fiscal year 2022. We have not had a significant number of temporary employees over the last three years. We maintain good relationships with all representative employee unions.
185
Table of Contents
Clawback Policy
TASAs Nominating and Compensation Committee expects to approve a new Policy for the Recovery of Erroneously Awarded Compensation (the Clawback Policy) to comply with the final clawback rules adopted by the SEC under Section 10D and Rule 10D-1 of the Securities Exchange Act of 1934, as amended, and the other associated listing standards.
Once adopted, we will be required to claw back erroneously awarded incentive-based compensation from our current and former senior executives (Covered Officers) if we are required to prepare an accounting restatement.
The recovery of such compensation under the Clawback Policy will apply regardless of whether a Covered Officer engaged in misconduct or otherwise caused or contributed to the requirement of an accounting restatement. We expect the Audit Committee to oversee the administration of the Clawback Policy.
Equity Program (LTI)
We intend to adopt a broad-based equity program to provide awards of equity incentives to our employees (including our senior executives) and our directors.
The individual awards granted are based on each participants position, fixed salary, individual performance and potential for development. We intend for awards to be offered through a two-tiered incentive program: (a) Restricted Shares and (b) Performance Shares.
Restricted Shares: Awards are expected to be granted to participants in the form of restricted shares. The grant of the number of restricted shares will be determined based on the value of the share at the time of grant. We expect the vesting period for the initial grants of restricted shares to be three years, subject to continued employment.
Performance Shares: Awards are expected to be granted to participants in the form of performance shares. Performance shares are common shares that are conditionally granted; we expect that vesting and settlement will be linked to actual performance against pre-set KPIs. The number of performance shares will be determined based on the value of our common shares at the time of grant. The performance period for the initial grants of performance shares is expected to be three years. Payout at threshold performance is expected to be 50% of the granted number of performance shares, target payout is expected to be 100% of the granted number of performance shares, and in case of overachievement (stretch), payout is expected to be capped at 150% with linear calculation of payout between each of these three levels of achievement, subject to continued employment.
For specific TASA senior executives, part of their individual LTI award may be granted in the form of TCI common shares according to the respective plans terms and subject to the approval of TCIs respective bodies.
Board Discretion
The board of directors maintains the right, subject to a recommendation by the Nominating and Compensation Committee, to adjust:
| | the agreed-upon target parameters (including KPIs and target ranges) in situations that are, or are reasonably expected to be, materially adverse to our business, operations, assets or business prospects. These circumstances may encompass, but are not restricted to, instances of a widespread economic crisis, fiscal or regulatory changes and natural disasters that would likely result in a significant change in the defined target parameters. |
| | enhanced targets, including in connection with one or more acquisitions or divestments. |
186
Table of Contents
In such instances, where there is a foreseeable and substantial change in the predefined target parameters, the board of directors holds the authority to recalibrate these parameters in alignment with the objectives of a reviewed management program. This approach is aimed at safeguarding the interests of all stakeholders associated with us.
Board of Directors Compensation
During Titan America LLCs 2024 fiscal year, we did not maintain any director compensation plan or program. We intend to adopt a director compensation policy as follows.
| Compensation | Independent Directors Share-Based Compensation | |
| Each independent director will receive $175,000 gross per annum for the 2025 fiscal year for their service as a member of the board of directors. Independent directors will not be entitled to additional compensation for their membership in the board committees.
The remuneration of the independent directors will consist of:
a board cash retainer, which represents 50% of their total annual board compensation ($87,500); and
an annual share-based compensation, which represents 50% of their total board compensation ($87,500).
There is no performance-based variable pay or pension provided to independent directors.
Non-independent directors will not receive cash or share-based compensation due to their membership on the board of directors. |
To further align the interests of the independent directors of the board of directors with those of shareholders, part of the approved total compensation for the independent directors is expected to be granted in the form of restricted shares.
The value of each restricted share will be equal to the average Company share closing price during the last seven trading days of March of the grant year.
A vesting period is expected to be one year, subject to the independent directors continued service.
Stock Ownership: Independent directors are expected to build and maintain a minimum threshold in company shares a fixed multiple of 1x annual cash retainer, and they have five years to comply. |
|
187
Table of Contents
CERTAIN RELATIONSHIPS AND RELATED PARTY TRANSACTIONS
Relationship with Titan Cement International Following the Offering
We are, and until completion of this offering will remain, an indirect wholly-owned subsidiary of Titan Cement International. Following this offering, Titan Cement International will continue to own 87% of our outstanding common shares, assuming no exercise of the underwriters option to purchase additional common shares, and, as a result, Titan Cement International will continue to have significant control over our business and affairs and matters being presented for approval by our shareholders. See Risk FactorsRisks Related to the Reorganization Transactions and Our Relationship with Titan Cement International. In addition, we expect that Titan Cement International will continue to consolidate our financial results in Titan Cement Internationals consolidated financial statements.
For a discussion of the Reorganization Transactions that Titan Cement International and its affiliates and we will enter into in connection with this offering, see Prospectus SummaryThe Reorganization Transactions.
All U.S. dollar equivalents in this section are calculated at the exchange rate prevailing on the date to which the corresponding foreign currency amount refers.
Shared Services Agreement
Many key services required by us for the operation of our business are provided by the Titan Group. Prior to the completion of this offering, we intend to enter into a shared services agreement with Titan Cement Company S.A., on behalf of itself and its affiliated entities, for an initial term of five years with an option to renew for additional two-year periods. Under the terms of this shared services agreement, Titan Group will provide us with services relating to corporate functions such as information technology, engineering, accounting, certain additional legal, treasury and investor relations support, human resources, tax, employee benefits and incentives and corporate communications, as well as regulatory and anti-fraud compliance.
We expect some of these services to be provided for longer or shorter periods than the initial term upon mutual agreement of both parties. The shared services agreement may be automatically extended for additional consecutive two-year periods. Any termination of the shared services agreement by Titan Cement Company S.A. would constitute a breach of the agreement and could potentially result in damages being awarded to us.
The fees for each of the services provided under the shared services agreement are generally based on costs incurred for the provision of the services plus a mark-up of 5%. Although the parties to the shared services agreement seek to implement terms that are consistent with those that could have been negotiated with an independent third party through arms length negotiations, the terms of such agreement may later prove to be more or less favorable than arrangements that we could obtain from unaffiliated service providers in the future.
Titan Global Finance PLC Revolving Credit Facility
On April 10, 2017, Titan America LLC entered into a 250 million ($279.9 million U.S. dollar equivalent) multicurrency revolving credit facility with TGF, an affiliate of Titan Group. On July 10, 2019, the credit facility was amended to increase the commitment to 340 million ($380.7 million U.S. dollar equivalent), which was then reduced to 100 million ($110.5 million U.S. dollar equivalent) by an amendment dated April 29, 2020 and subsequently increased to 130 million ($145.5 million U.S. dollar equivalent) by an amendment dated July 31, 2024. In January 2022, the termination date of the credit facility agreement was extended by four years to January 30, 2026. This multicurrency revolving credit facility bears interest at a variable rate based on the currency and term of the drawdown, permits drawdowns and repayments and has no financial covenants.
As of September 30, 2024, the amount drawn on the facility was 21.5 million ($24.1 million U.S. dollar equivalent). As of December 31, 2023, the amount drawn on the facility was 36.5 million ($40.3 million U.S. dollar equivalent).
188
Table of Contents
Titan Global Finance PLC Notes and Term Loans
In December 2017, Titan America LLC entered into a 150 million ($167.9 million U.S. dollar equivalent) note payable with TGF, an affiliate of Titan Group, maturing on November 15, 2024. In April 2022, Titan America LLC repaid 30 million ($33.6 million U.S. dollar equivalent) of this note. As of September 30, 2024 and December 31, 2023, 120 million ($134.4 million U.S. dollar equivalent) remained outstanding bearing interest at 3.05%. On November 15, 2024, we repaid this loan.
In March 2018, Titan America LLC entered into a 75.0 million ($84.0 million U.S. dollar equivalent) note payable with TGF maturing on November 15, 2024. On April 29, 2024, this note was amended to: (i) increase the principal amount to 100 million ($110.5 million U.S. dollar equivalent) bearing an interest rate of 4.80% and (ii) extend its maturity to June 11, 2029.
In June 2021, we entered into the following term loans with TGF:
| | A 32.8 million ($36.7 million U.S. dollar equivalent) loan bearing interest at 3.35% and maturing on July 7, 2027, and |
| | A 45 million ($50.4 million U.S. dollar equivalent) loan with TGF bearing interest at 3.15%, which was revised to 3.05% in December 2022, and maturing on November 14, 2024. On April 29, 2024, the loan was amended to: (i) increase the principal to 50 million ($56.0 million U.S. dollar equivalent) bearing an interest rate of 4.80% and (ii) extend its maturity to June 11, 2029. |
On November 15, 2024, we entered into a 150.0 million note payable with TGF, bearing interest at 3.20% and maturing on July 7, 2027. The proceeds of this loan were used to pay down 30.0 million on the multicurrency revolving credit facility with TGF and repay the 120.0 million balance on the term loan with TGF that matured on November 15, 2024. There are no financial covenants with this loan.
Revolving Credit Facilities Guaranteed by TCI
Titan America LLC has the following three credit facilities, which are each guaranteed by TCI:
Titan America LLC has a committed borrowing facility with Wells Fargo Bank, National Association totaling $45 million of which $15 million is also available for the issuance of letters of credit. As of September 30, 2024, Titan America LLC had $8 million in letters of credit outstanding with $37 million of available capacity. As of December 31, 2023, Titan America LLC had $5 million in letters of credit outstanding with $40 million of available capacity.
In addition to the committed credit facility described above, Titan America LLC has an uncommitted borrowing facility with HSBC Bank USA, National Association totaling $40 million of which the full amount is also available for the issuance of letters of credit. As of September 30, 2024, Titan America LLC had $5 million in letters of credit outstanding under this facility, with $35 million of available of capacity. As of December 31, 2023, Titan America LLC had $7 million in letters of credit outstanding under this facility, with $33 million of available capacity.
Titan America LLC has an additional uncommitted credit facility with Citibank, N.A. totaling $60 million, none of which is available for the issuance of letters of credit. As of September 30, 2024 and December 31, 2023, no borrowings were outstanding under this facility and the full $60 million capacity remained available for borrowing.
For more information on these credit facilities, see Managements Discussion and Analysis of Financial Condition and Results of OperationsLiquidity and Capital ResourcesRevolving Credit Facilities with Banks.
189
Table of Contents
Intragroup Cash Management Agreement
On February 1, 2024, we entered into a cash management agreement with TGF. The agreement is effective until either party provides written notice of termination. Pursuant to this agreement, our two existing HSBC UK bank accounts, one denominated in U.S. dollars and one denominated in Euros, are funded when there are negative daily balances. Fundings are subject to maximum borrowing limits of $15 million and 15 million, respectively. Conversely, when there are cash balances in either account, these funds are swept as a deposit into the TGF concentration account. There are no deposit limits.
With respect to borrowings made under the cash management agreement, we bear a daily interest charge based on the benchmark rates of the European Central Bank (ECB) Main Refinancing Rate (for Euro borrowings) and the U.S. Federal Reserve Federal Funds Target Rate (for U.S. dollar borrowings), plus an applicable margin.
With respect to deposits made under the cash management agreement, we receive a daily interest credit based on the benchmark interest rates of the ECB Deposit Facility Rate (for Euro deposits) and the U.S. Federal Reserve Federal Funds Target Rate (for US dollar deposits), minus an applicable margin.
Company funds on deposit with TGF under the cash management agreement are due upon demand from us. Amounts borrowed from TGF under the cash management agreement may be repaid (in whole or in any part) at our discretion. Following written notice of termination, outstanding borrowings from TGF under the cash management agreement are due upon demand from TGF.
Cement and Cementitious Products Supply Agreements
On a yearly basis, Titan America LLC enters into ordinary course of business supply agreements under the master supply agreement with Titan Cement Company S.A., an affiliate of TCI, for the purchase of a predetermined amount of cement and cementitious products for the following year at a price based on the arms length principle in accordance with the U.S. transfer pricing rules and the relevant OECD guidelines. For fiscal years ended December 31, 2023, 2022 and 2021, Titan America LLC purchased cement for a cost of $107.1 million, $84.2 million and $70.3 million, respectively.
Funding Arrangements Agreement
Prior to the completion of this offering, we intend to enter into a funding arrangements agreement by and among TASA, Titan America LLC, Titan Cement International, Titan Atlantic and Titan Global Finance PLC for an initial term of five years. The funding arrangements agreement may be automatically extended for additional consecutive two-year periods. This funding arrangements agreement provides that so long as the terms and conditions are favorable, Titan America LLC will continue using funding sources provided by: i) Titan Global Finance PLC, including but not limited to borrowing arrangements and ii) Titan Cement International as far as guarantees of third-party loans are concerned and subject to a guarantee fee. Titan America LLC will continue participating in the Intragroup Cash Management Agreement, while TASA and Titan Atlantic will also have access to these funding sources pursuant to the agreement.
STET Divestiture
On January 1, 2025, Titan America LLC divested its STET segment in a sale for cash, to be settled no later than January 31, 2025, of approximately $6 million to Titan Cement Netherlands B.V., a wholly-owned subsidiary of Titan Cement International, which is outside the scope of this offering.
190
Table of Contents
STET Licensing Agreements
The ST fly ash sources where the proprietary fly ash beneficiation process has been installed are facilities which are owned and operated by ST and are co-located at power plant sites that are owned by a host electric utility. These fly ash sources are located in Baltimore MD, York Haven PA and Tampa FL. ST pays no per ton fees to the STET segment at its fly ash sources that do not utilize the proprietary fly ash beneficiation process. Prior to this offering, the intellectual property associated with the proprietary technology that currently resides within ST was transferred from ST to ST Equipment & Technology LLC, a legal entity within the STET segment. For more information on the proprietary fly ash beneficiation process and relationship between ST and ST Equipment & Technology LLC, see BusinessDigital Transformation.
Related Party Transactions Approval Policy
Following the completion of this offering, our Audit Committee will have the primary responsibility for reviewing and approving related party transactions which are transactions between us and related persons in which the aggregate amount involved exceeds or is expected to exceed $120,000 and in which a related person has or may have a direct or indirect material interest. Prior to the completion of this offering, we expect to adopt a written policy with respect to the review and approval of related party transactions as well as an audit committee charter delegating to the Audit Committee the authority to review and approve any related party transactions.
191
Table of Contents
PRINCIPAL AND SELLING SHAREHOLDERS
The following table presents certain information as of September 30, 2024 with respect to the beneficial ownership of our common shares, and as adjusted to give effect to the Reorganization Transactions and sale of common shares offered by us in this offering, assuming no exercise and full exercise of the underwriters option to purchase additional common shares, by:
| | each person known by us to beneficially own more than 5% of our common shares; |
| | each of TASAs directors and director nominees; |
| | each of our named executive officers; and |
| | all of our executive officers and directors as a group. |
We have determined beneficial ownership in accordance with the rules of the SEC. Under these rules, a person is deemed to be a beneficial owner of a security if that person has or shares voting power or investment power, which includes the power to dispose of or to direct the disposition of such security. Unless otherwise indicated below, to our knowledge, based on information furnished to us, the persons and entities named in the table have sole voting and investment power with respect to all shares that they beneficially own, subject to applicable community property laws.
The percentage of beneficial ownership prior to this offering is based on 175,362,465 common shares outstanding as of September 30, 2024. The percentage of beneficial ownership after this offering is based on 184,362,465 common shares, which is the number of common shares outstanding as of September 30, 2024 plus the 9,000,000 common shares offered by us in this offering. We currently have one record holder of common shares. No holder of common shares is domiciled in the United States. All holders of our common shares will have the same voting rights upon the completion of this offering.
192
Table of Contents
The address for each officer listed in the table is 5700 Lake Wright Drive, Suite 300, Norfolk, Virginia 23502 and for our directors listed in the table is 1000 Bruxelles, Square de Meeûs 37, Belgium.
| Shares Beneficially Owned After this Offering | ||||||||||||||||||||||||||||||||
| Shares Beneficially Owned Prior to this Offering |
Number of Shares Being Offered in this Offering |
Number of Shares Being Offered Pursuant to Underwriters Option |
Assuming the Underwriters Option is Not Exercised |
Assuming the Underwriters Option is Exercised in Full |
||||||||||||||||||||||||||||
| Name of Beneficial |
Number of Shares |
Percentage | Number of Shares |
Percentage | Number of Shares |
Percentage | ||||||||||||||||||||||||||
| Titan Cement International SA |
175,362,465 | 100 | % | 15,000,000 | 3,600,000 | 160,362,465 | 87 | % | 156,762,465 | 85 | % | |||||||||||||||||||||
| Named executive officers, TASAs directors and director nominees: |
||||||||||||||||||||||||||||||||
| Michael Colakides. |
| | | | | | | | ||||||||||||||||||||||||
| Nikolaos Birakis |
| | | | | | | | ||||||||||||||||||||||||
| Nikos Andreadis |
| | | | | | | | ||||||||||||||||||||||||
| Grigoris Dikaios |
| | | | | | | | ||||||||||||||||||||||||
| Bill Zarkalis |
| | | | | | | | ||||||||||||||||||||||||
| Larry Wilt |
| | | | | | | | ||||||||||||||||||||||||
| John Christy |
| | | | | | | | ||||||||||||||||||||||||
| Dan Quirk |
| | | | | | | | ||||||||||||||||||||||||
| Robert Paxton |
| | | | | | | | ||||||||||||||||||||||||
| Kevin Baird |
| | | | | | | | ||||||||||||||||||||||||
| Randy Dunlap |
| | | | | | | | ||||||||||||||||||||||||
| Marcel Cobuz |
| | | | | | | | ||||||||||||||||||||||||
| William John Antholis |
| | | | | | | | ||||||||||||||||||||||||
| James Bachmann |
| | | | | | | | ||||||||||||||||||||||||
| Sandra Santos |
| | | | | | | | ||||||||||||||||||||||||
| Wim Van der Smissen |
| | | | | | | | ||||||||||||||||||||||||
193
Table of Contents
The following describes our issued share capital, highlights certain differences in corporate law in Belgium and Delaware and summarizes the material provisions of our amended articles of association. It also includes comparisons of certain provisions of our articles of association and the Belgian Code on Companies and Associations applicable to us and the Delaware General Corporation Law (DGCL). Please note that these statements are a summary and are not intended to be exhaustive and do not address all aspects of Belgian law that may be relevant to us and our shareholders or all aspects of Delaware law which may differ from Belgian law. They are subject to, and qualified in its entirety by reference to, the terms and provisions of our articles of association, the Belgian Code on Companies and Associations applicable to us and the DGCL. For further information, please refer to the full versions of our amended articles of association, which is included as exhibits to the registration statement of which this prospectus is a part.
General Description of Share Capital
Share Capital and Shares
Our issued share capital is represented by common shares without nominal value. Our share capital is fully paid-up. Our issued shares are not separated into classes of shares.
The number of shares issued is expressed in units.
The changes to our actual share capital since incorporation of the Company is summarized as follows:
| Date |
Transaction | Increase (reduction) of share capital (in USD) (including issue premium) |
Number of shares issued |
Class of shares issued |
Issue price per Share (in USD, rounded) |
Resulting share capital (in USD) |
Existing Shares |
|||||||||||||||||
| 7/17/2024 |
Incorporation | 200,000 | 2,000 | Common shares |
100.00 | 200,000 | 2,000 | |||||||||||||||||
| 2024 |
Share Split | N/A | 20,000 | Common shares |
10.00 | 200,000 | 20,000 | |||||||||||||||||
|
|
|
|
|
|
|
|
|
|
|
|
|
|||||||||||||
| 2024 |
Contribution in kind |
3,199,999,886.25 | 175,342,465 | Common shares |
18.250 | 1,753,624,650 | 175,362,465 | |||||||||||||||||
|
|
|
|
|
|
|
|
|
|
|
|
|
|||||||||||||
As of December 31, 2024, our share capital amounts to $1,753,624,650, represented by 175,362,465 fully authorized and subscribed and paid-up shares without nominal value.
On the date of this prospectus, our share capital amounts to $ , represented by fully authorized and subscribed and paid-up shares without nominal value.
Other Outstanding Securities
In addition to the shares already outstanding, we expect to adopt a long-term incentive plan in connection with this offering.
Lock-Up Agreements
Under our articles of association, our issued shares are not subject to any lock-up arrangements and are, by virtue of Article 12 of our articles of association, freely transferable.
In the context of the offering, we have agreed, with the underwriters and subject to certain exemptions, not to offer sell, or dispose of any shares of our share capital or securities convertible into or exchangeable or exercisable for any shares of our share capital during the 180-day period following the date of this prospectus. Members of our board of directors and our executive officers and the selling shareholder have agreed to substantially similar lock-up provisions, subject to certain exceptions. See Underwriting.
194
Table of Contents
Articles of Association and Other Share Information
Corporate Profile
Our legal and commercial name is Titan America SA.
We are a limited liability company (société anonyme/naamloze vennootschap) under Belgian law. We are registered with the Register of Legal Entities (registre des personnes morales/rechtspersonenregister) of Brussels (French-speaking division) and are registered with the Crossroads Bank for Enterprises (Banque-Carrefour des Entreprises/Kruispuntbank van Ondernemingen) under number 1011.751.174.
Our registered office is located at Square de Meeûs 37, 1000 Brussels, Belgium and our telephone number is +32 27 26 80 58. Our agent for service of process in the United States is John Christy, 5700 Lake Wright Drive, Suite 300, Norfolk, VA 23502.
We were incorporated in Belgium on July 17, 2024. We accounted for a first shortened financial year that ended on December 31, 2024. Our fiscal year commences on January 1 and ends December 31.
Corporate Object
Our corporate object (objet/voorwerp), as set forth in Article 3 of our articles of association, is as follows (unofficial English translation):
The companys purpose is, in Belgium and abroad, for its own account and/or on behalf of third parties, (a) the acquisition of a direct or indirect interest in shares in any, Belgian or foreign, commercial, industrial, financial, securities and/ or real estate company or enterprise, (b) the control and management or participation in such enterprises and (c) the purchase, the administration, the sale of any securities and real estate, any social right and more generally any portfolio management operations thereby constituted, (d) to carry out, either alone or jointly with others the business or activity in any industry, manufacture, trade, supply, warehousing, transportation, wholesale, retail, export, import as well as the business or undertaking of traders in general, carriers by any means of transportation, insurance agents or representatives, agents on commission or otherwise, (e) to carry out, either alone or jointly with others the business or activity of service provision including the areas of general and specialised consulting and business management as well as the provision of IT services and any other business related services, (f) to carry out, either alone or jointly with others business or activities generally related to immovable property, building materials, the development, purchase, sale, lease or sub-lease of any immovable property as well as the business or activity of construction and maintenance and to trade, sell on hire purchase, lease, let, assign, mortgage, grant licences or dispose, in any manner, of all or any of the above or part thereof, (g) to invest in shares, bonds, debentures, financial instruments in general which may be listed or not in regulated markets, (h) to borrow, raise money or secure obligations (whether of the company or any other person) in such manner or upon such terms in order to facilitate the accomplishment of its corporate purpose and (i) to lend and advance money or give credit to any person, firm or company; to guarantee, give guarantees or indemnities for, undertake or otherwise support or secure, either with or without the company receiving any consideration or advantage and whether by personal covenant or by mortgaging, charging, pledging, assigning or creating of any rights or priorities in favor of any person or in any other manner whatsoever, all or part of the undertaking, property, assets, book debts, rights, choses in action, receivables and revenues present and future.
The company may also have an interest, by way of contribution or merger, in any company or entity, already incorporated or to be incorporated, having an identical corporate purpose, related or connected to its own corporate purpose or which would be likely to favour in any manner the pursuit of its corporate purpose.
The company may provide for the administration, the supervision and the control of all affiliated companies or companies of which it has shares and any other, and to grant any loans or guarantees to them in any form and for any duration. It may be appointed as a director, manager or liquidator of another company.
195
Table of Contents
The company may provide a guarantee both for its own and third parties commitments, including but not limited to giving its assets in mortgage or pledge, including its business assets.
The company may carry out any activity likely to favor the accomplishment of its corporate purpose and to participate in such activities in any manner.
The company may carry out on behalf of third parties any financial transactions, such as acquiring, by way of purchase or otherwise, any securities or real estate, receivables, partnership shares and shares in any financial, industrial and commercial companies, any portfolio or capital management action, any commitment as any kind of guarantee upon acquisition by the company of the authorizations that may be necessary for these operations.
The company may perform any action and operation that are necessary, useful or directly or indirectly related to the accomplishment of its corporate purpose, or that are such as to make directly the accomplishment of this corporate purpose easier or to favor the development of the company.
The corporate purpose may be modified by the shareholders in accordance with the provisions of the Belgian Code on Companies and Associations.
Choice of Forum/Governing Law
Our articles of association will provide that each shareholder, with regard to his/her relationship with the Company, is always considered to reside at the registered office of the Company and will be subject to Belgian laws. This entails that any dispute relating to corporate matters of the Company and the implementation of our articles of association between the Company, our shareholders, our directors, statutory auditors or liquidators will be governed by Belgian law and settled exclusively before Belgian courts as a forum.
Any person or entity purchasing or otherwise acquiring any interest in our share capital shall be deemed to have notice of and to have consented to the choice of forum provisions of our articles of association.
The above exclusive forum provision may limit the ability of a shareholder to bring a claim in a judicial forum of its choosing, which may discourage lawsuits against us and our directors.
This exclusive forum provision is mainly intended to apply to claims arising under Belgian law, but will also apply to claims brought under other applicable laws provided that such other laws do not provide for exclusive jurisdiction for non-Belgian courts. The exclusive forum provision in our articles of association will not relieve us from our duties to comply with U.S. federal securities laws and the rules and regulations thereunder, and shareholders will not be deemed to have waived our compliance with these laws, rules and regulations. Therefore, the provision in our articles of association providing for exclusive jurisdiction of Belgian courts would not apply to claims brought pursuant to the Securities Act or the Exchange Act or any other claim for which U.S. federal courts would have exclusive jurisdiction. To the extent that any such claims may be based upon federal law claims, Section 27 of the Exchange Act creates exclusive federal jurisdiction over all suits brought to enforce any duty or liability created by the Exchange Act or the rules and regulations thereunder. Furthermore, Section 22 of the Securities Act creates concurrent jurisdiction for federal and state courts over all suits brought to enforce any duty or liability created by the Securities Act or the rules and regulations thereunder. Accordingly, both U.S. state and federal courts have jurisdiction to entertain such claims. We note that investors cannot waive compliance with U.S. federal securities laws and the rules and regulations thereunder.
As a company incorporated in Belgium, we believe that the choice of the courts of the jurisdiction of the registered office of our Company as our exclusive forum for resolving all shareholder complaints, unless otherwise determined by applicable law, allows us to more efficiently and affordably respond to such complaints, and provide for consistency in the application of Belgian law to such complaints.
Board of Directors
Directors are expected to arrange their personal and business affairs so as to avoid conflicts of interest with our Company.
196
Table of Contents
Any director with a direct or indirect conflicting financial interest (as contemplated by article 7:96 of the Belgian Code on Companies and Associations) on any matter before the board of directors must bring it to the attention of the fellow directors, and is prohibited from taking part in any deliberation or voting related thereto. The minutes of the relevant board meeting must be communicated to the statutory auditor. The relevant sections of the minutes of the meeting of our board of directors that sets forth the statements of the conflicted director, the nature of the transaction, the financial impact of the matter on us and the justification of the decision of our board of directors must be published in our annual report or in a document filed together with the annual accounts. The statutory auditors report on the annual accounts must furthermore contain a description of the financial impact on us of each of the decisions of our board of directors where a conflict of interest in the sense of the Belgian Code on Companies and Associations has arisen.
In case of non-compliance with the foregoing legal provisions on financial conflicts of interest, we may request the annulment of the decision or transaction that has taken place in breach of these aforementioned provisions if the counterparty to said decision or transaction was aware or should have been aware of such breach. Directors can be held personally and severally liable for any damages incurred by our Company and third parties as a result of resolutions taken or transactions entered into in application of the foregoing legal provisions on financial conflicts of interest, when illegitimate financial gains have been obtained by any director(s) to the detriment of our Company.
The DGCL generally permits transactions involving a Delaware corporation and an interested director of said corporation if (i) the material facts as to the directors relationship or interest and as to the transaction are disclosed and a majority of disinterested directors consent to the transaction, (ii) the material facts are disclosed as to the directors relationship or interest and a majority of shares entitled to vote thereon consent to the transaction or (iii) the transaction is fair to the corporation at the time it is authorized by the board of directors, a committee of the board of directors or the shareholders.
As a foreign private issuer, we have the option to follow certain home country corporate governance practices rather than those of the NYSE, provided that we disclose the requirements we are not following and describe the home country practices we are following. We intend to rely on this foreign private issuer exemption but cannot make any assurances that we will continue to do so in the future. If we were to lose our status as a foreign private issuer, we may avail ourselves of the controlled company exemption which exempts us from certain governance requirements of the NYSE. As a result, our shareholders may not have the same protections afforded to shareholders of companies that are subject to all NYSE corporate governance requirements.
Belgian law does not specifically regulate the ability of directors to borrow money from us, and as a result, any such borrowing will be governed by the general duties of directors of our Company and the foregoing legal provisions on financial conflicts of interest. There are no outstanding loans granted by our Company to any member of the board of directors or to any member of the Companys executive management, nor has the Company provided any guarantees for the benefit of any member of the board of directors or any member of the Companys executive management.
Day-to-day Management
Our board of directors can, in accordance with article 7:121 of the Belgian Code on Companies and Associations, delegate the day-to-day management (gestion journalière) of the Company to one or more persons. Any person charged with day-to-day management is also authorized to represent the Company towards third parties for matters that concern day-to-day management. Day-to-day management is defined in the Belgian Code of Companies and Associations as all acts and decisions which do not exceed the needs of the daily life of the company as well as acts and decisions which, due to the minor interest they represent or due to their urgent nature, do not justify the intervention of the board of directors (unofficial English translation).
Our board of directors can appoint one or multiple persons charged with daily management, and these persons can either be appointed to act individually or as a collective body.
197
Table of Contents
Form and Transferability of Our Shares
Our shares can be held in registered form or indirectly in book-entry form. All of our outstanding shares are fully paid-up and freely transferable, subject to any contractual restrictions, as the case may be. They rank pari passu in all respects with all other existing and outstanding common shares of the Company.
Our share register is divided into two components, in accordance with Article 7:33 of the Belgian Code on Companies and Associations: one component is kept at the registered office of the Company in Belgium, and the other is kept in the United States by Computershare, our U.S. transfer agent and registrar (the U.S. Share Register).
Our shares that are reflected in the U.S. Share Register are identified by CUSIP B9151N 105 and we have applied to have our shares listed on the NYSE.
Pursuant to Article 91 of the Belgian Code on Private International Law, the legal title to securities is governed by the law of the jurisdiction where the register is kept, i.e., Belgium or the United States. The shares that trade on the NYSE will be registered in the U.S. Share Register, either directly in the name of the ultimate shareholder (for nominative holding) or indirectly in the name of Cede & Co, as nominee of DTC (for book-entry form holding). Under the laws of the United States, the shareholders who are beneficial owners that hold their shares in the DTC system are recognized as the owners of those shares, even when the shares are registered in the share register in the name of Cede & Co., as nominee of DTC.
Currency
Our share capital, which is represented by our outstanding common shares, is denominated in U.S. dollars. The shares do not have a nominal value, and each share reflects the same fraction of our share capital.
Changes to Our Share Capital
In principle, changes to our share capital are decided by our shareholders. Our shareholders may at any time at a meeting of shareholders decide to increase or decrease our share capital provided that such proposal is included in the convocation and agenda of the general meeting of the Company. Increases of our share capital can be carried out either through contributions in cash or in kind. Any such resolution of shareholders must satisfy the quorum and majority requirements that apply to an amendment of the articles of association, as described below in Description of the Rights and Benefits Attached to Our SharesRight to Attend and Vote at Our Meetings of ShareholdersQuorum and Majority Requirements. No shareholder is liable to make any further contribution to our share capital other than with respect to shares held by such shareholder that would not be fully paid-up. Whenever our Company proposes to increase our share capital, our board of directors and our statutory auditor will, if so required under the Belgian Code on Companies and Associations, prepare certain special reports that serve to inform our shareholders of the proposed transaction and its consequences.
As set-out in Return of Capital, a decrease of our share capital will need to be carried out in accordance with the provisions of the Belgian Code on Companies and Associations. Whenever a decrease is carried out that does not seek to cover incurred losses or to form a reserve for foreseeable losses or an indistributable reserve to cover for a position of treasury shares, certain creditor protection rules apply under Belgian law that impose inter alia a two-month waiting period between the resolution to decrease the capital and the payment date.
Share Capital Increases by Our Board of Directors
Subject to the quorum and majority requirements described below in Description of the Rights and Benefits Attached to Our SharesRight to Attend and Vote at Our Meetings of ShareholdersQuorum and Majority Requirements, our meeting of shareholders may authorize our board of directors, within certain limits, to increase our share capital without any further approval of our shareholders. A capital increase that is authorized in this manner is referred to as authorized capital.
198
Table of Contents
This authorization can only be granted for a renewable period of a maximum of five years as from the date of the publication of the authorization in the Annexes to the Belgian Official Gazette (Moniteur Belge/Belgisch Staatsblad).
Without prejudice to more restrictive rules set forth by law, our board of directors was authorized, on December 18, 2024, to increase the registered capital of our Company in one or more transactions with a maximum amount that cannot exceed $1,753,624,650 (excluding issuance premiums, if any) for a period of five years from the date of publication in the Annexes of the Belgian Gazette of the authorization granted on December 18, 2024.
Under the authorization, our board of directors will also be authorized to issue, in one or more instances, convertible bonds, bonds with subscription rights, or subscription rights, whether or not linked to another security. Concerning the issuance of such securities, the determined amount up to which the board of directors may make use of the authorization will be calculated on the basis of the capital increases that may result from the conversion of these bonds and/or the exercise of these subscription rights.
Acting in the best interest of the Company, our board of directors is also authorized to (i) increase the capital of the Company or issue convertible bonds or subscription rights with limitation or cancellation of the shareholders preferential subscription rights or (ii) increase the capital of the Company or issue convertible bonds with limitation or cancellation of the shareholders preferential subscription rights including in favor of one or more determined persons, other than members of staff of the Company or of its subsidiaries.
Preferential Subscription Rights
In the event of a capital increase for cash with the issue of new shares, or in the event we issue convertible bonds or subscription rights, the existing shareholders have a preferential right to subscribe, pro rata, to the new shares, convertible bonds or subscription rights. These preferential subscription rights are transferable during the subscription period.
Our shareholders may, at a meeting of shareholders, decide to limit or cancel these preferential subscription rights, subject to special reporting requirements. Such decision by the shareholders needs to satisfy the same quorum and majority requirements as the decision to increase our share capital.
The shareholders may also decide to authorize our board of directors to limit or cancel the preferential subscription right within the framework of the authorized capital, subject to the terms and conditions set forth in the Belgian Code on Companies and Associations. As set out above, this authorization was granted to our board of directors on December 18, 2024, for a period of five years from the date of publication in the Annexes of the Belgian Gazette of the authorization granted on December 18, 2024.
Under the DGCL, shareholders of a Delaware corporation have no pre-emptive rights to subscribe for additional issues of stock or to any security convertible into such stock unless, and to the extent that, such rights are expressly provided for in the corporations certificate of incorporation.
Purchase and Sales of Our Own Shares
We may acquire, pledge and dispose of our own shares pursuant to the conditions provided for by articles 7:215 of the Belgian Code on Companies and Associations. These conditions include a prior special shareholders resolution approved by at least 75% of the votes validly cast at a general shareholders meeting (whereby abstentions are not included in the numerator nor in the denominator) where at least 50% of the share capital and at least 50% of the profit certificates, if any, are present or represented. Furthermore, shares can only be acquired with funds that would otherwise be available for distribution as a dividend to the shareholders and the transaction must pertain to fully paid-up shares or associated certificates. Finally, an offer to purchase shares must be made by way of an offer to all shareholders under the same conditions; Titan America is not permitted to engage in share repurchase transactions on the open market.
199
Table of Contents
Generally, the general shareholders meeting or the articles of association determine the number of shares that can be acquired, the duration of such an authorization which cannot exceed five years as from the publication of the proposed resolution as well as the minimum and maximum price that the board of directors can pay for the shares. Our general shareholders meeting has accorded our board of directors the authority to acquire up to 20% of our issued shares without requiring the prior authorization of our shareholders meeting. This authority has been granted on December 18, 2024, and is valid for five years from the date of the publication in the Annexes of the Belgian Gazette of the minutes of the authorization granted on December 18, 2024.
The prior approval by the shareholders is not required if we purchase the shares to offer them to our personnel, in which case the shares must be transferred within a period of 12 months as from their acquisition. However, such repurchase transactions cannot occur on the open market and must be carried out pursuant to an offer to all shareholders under the same conditions.
The board of directors may also expressly be authorized to dispose of our own shares to one or more specific persons other than our employees or our subsidiaries, in accordance with the provisions of the Belgian Code on Companies and Associations.
The authorizations referred to above (if any) shall extend to the acquisition and disposal of our shares by one or more of its direct subsidiaries, within the meaning of the legal provisions relating to the acquisition of shares in their parent company by subsidiaries.
Under the DGCL, a Delaware corporation may purchase or redeem its own shares, unless the capital of the corporation is impaired or the purchase or redemption would cause an impairment of the capital of the corporation.
Squeeze-Out
Pursuant to article 7:82, §2 of the Belgian Code on Companies and Associations, any (natural or legal) person that, acting alone or in concert, directly or indirectly, owns 95% of the securities issued of the Company to which voting rights are attached can launch a squeeze-out offer (offer de reprise) in order to obtain all securities issued by the Company to which voting rights are attached or which give access to voting rights. Other than the securities for which the holders have expressly and in writing indicated that they do not wish to transfer their securities, non-offered securities will transfer to the person who launched the squeeze-out offer by operation of law, with consignment of the consideration.
Description of the Rights and Benefits Attached to Our Shares
Right to Attend and Vote at Our Meetings of Shareholders
Annual Meeting of Shareholders
Our annual general shareholders meeting is held at the registered office of our Company or at the place determined in the notice convening the general shareholders meeting.
The annual general meeting will be held every year on the Tuesday that precedes the second Thursday of the month of May, at 4 PM (CET). If this day is a public holiday, the meeting will be held on the next business day.
At our annual general shareholders meeting, the board of directors submits to the shareholders the audited annual financial statements and the reports of the board of directors and of the statutory auditor with respect thereto.
The shareholders then decide on the approval of the statutory annual financial statements, the proposed allocation of our Companys profit or loss, the discharge from liability of the directors and the statutory auditor, and, when applicable, the (re-)appointment or dismissal of the statutory auditor and/or of all or certain directors.
200
Table of Contents
Special and Extraordinary Meetings of Shareholders
Our board of directors or the statutory auditor (or the liquidators, if appropriate) may, whenever the interest of our Company so requires, convene a special or extraordinary general shareholders meeting. Pursuant to article 7:126 of the Belgian Code on Companies and Associations, such general shareholders meeting must also be convened every time one or more shareholders holding, alone or together, at least 10% of our Companys share capital so request. Shareholders that do not hold at least 10% of our Companys share capital do not have the right to have the general shareholders meeting convened.
Under the DGCL, special meetings of the shareholders of a Delaware corporation may be called by such person or persons as may be authorized by the certificate of incorporation or by the bylaws of the corporation, or if not so designated, as determined by the board of directors. Shareholders generally do not have the right to call meetings of shareholders, unless that right is granted in the certificate of incorporation or the bylaws.
Notices Convening Meetings of Shareholders and Agenda
The notice convening the general shareholders meeting must state the place, date and hour of the meeting and must include an agenda indicating the items to be discussed. The notice needs to contain a description of the formalities that shareholders must fulfil in order to be admitted to the general shareholders meeting and exercise their voting right, information on the manner in which shareholders can put additional items on the agenda and table draft resolutions, information on the manner in which shareholders can ask questions during the general shareholders meeting, information on the procedure to participate at the general shareholders meeting by means of a proxy or to vote by means of a remote vote, and, as applicable, the registration date for the general shareholders meeting. The notice must also mention where shareholders can obtain a copy of the documentation that will be submitted to the general shareholders meeting, the agenda with the proposed resolutions or, if no resolutions are proposed, a commentary by the board of directors, updates of the agenda if shareholders have put additional items or draft resolutions on the agenda, the forms to vote by proxy or by means of a remote vote and the address of the webpage on which the documentation and information relating to the general shareholders meeting will be made available. This documentation and information, together with the notice and the total number of outstanding voting rights, must also be made available on our Companys website at the same time as the publication of the notice convening the meeting, for a period of five years after the relevant general shareholders meeting.
The notice convening the general shareholders meeting has to be published at least 15 calendar days prior to the general shareholders meeting in the Belgian Official Gazette (Moniteur Belge/Belgisch Staatsblad), in a newspaper that is published nation-wide in Belgium and in media that can be reasonably relied upon for the dissemination of information within the EEA in a manner ensuring fast access to such information on a non-discriminatory basis. A publication in a nationwide newspaper is not needed for annual general shareholders meetings taking place on the date, hour and place indicated in the articles of association of our Company if the agenda is limited to the treatment of the financial statements, the annual report of the board of directors, the remuneration report and the report of the statutory auditor, the discharge from liability of the directors and statutory auditor, and the remuneration of directors. See also Annual Meeting of Shareholders above. In addition to this publication, the notice will be distributed at least 15 calendar days prior to the meeting via the website of our Company (www.titanamerica.com).
At the same time as its publication, the convening notice must also be sent to the holders of registered shares, holders of registered bonds, holders of registered warrants, holders of registered certificates issued with the cooperation of our Company (if any) and, as the case may be, to the directors and statutory auditor of our Company.
Under the DGCL, unless otherwise provided in the certificate of incorporation or bylaws, written notice of any meeting of the shareholders of a Delaware corporation must be given to each shareholder entitled to vote at the meeting not less than ten nor more than sixty days before the date of the meeting and shall specify the place, date, hour and, in the case of a special meeting, the purpose of the meeting.
201
Table of Contents
Admission to Meetings
All holders of shares, warrants, profit-sharing certificates, non-voting shares, subscription rights or other securities issued by our Company, as the case may be, and all holders of certificates issued with the co-operation of our Company (if any) can attend the general shareholders meetings insofar as the law or the articles of association entitles them to do so and, as the case may be, gives them the right to participate in voting.
In order to be able to attend a general shareholders meeting, a holder of securities issued by our Company must be registered as a holder of securities on the record date for the meeting.
The formalities for the registration of securities holders, and the notification of our Company must be further described in the notice convening the general shareholders meeting.
Each shareholder has the right to attend a general shareholders meeting and to vote at the general shareholders meeting in person or through a proxy holder, who need not be a shareholder. The appointment of a proxy holder may take place in paper form or electronically (in which case the form shall be signed by means of an electronic signature in accordance with applicable Belgian law), through a form which shall be made available by our Company.
The notice convening the meeting may allow shareholders to vote remotely in relation to the general shareholders meeting, by sending a paper form or, if specifically allowed in the notice convening the meeting, by sending a form electronically (in which case the form shall be signed by means of an electronic signature in accordance with applicable Belgian law). These forms shall be made available by our Company.
Our Company may also organize a remote vote in relation to the general shareholders meeting through other electronic communication methods, such as, among others, through one or several websites. Our Company shall specify the practical terms of any such remote vote in the convening notice.
Holders of securities who wish to be represented by proxy or vote remotely must, in any case comply with the formalities to attend the meeting. Holders of shares without voting rights, profit-sharing certificates without voting rights, convertible bonds, warrants or certificates issued with the cooperation of our Company may attend the general shareholders meeting, but only with an advisory vote.
Votes
Each shareholder is entitled to one vote per share.
Voting rights can be mainly suspended in relation to shares:
| | which are not fully paid up, notwithstanding the request thereto of the board of directors; and |
| | to which more than one person is entitled, except in the event a single representative is appointed for the exercise of the voting right. |
Pursuant to the Belgian Code on Companies and Associations, generally, the general shareholders meeting has sole authority with respect to:
| | the approval of the annual financial statements of the company; |
| | the distribution of profits (except interim dividends (see Dividends below)); |
| | the appointment and dismissal of directors of the company; |
| | the appointment and dismissal of the statutory auditor of the company; |
| | the granting of discharge from liability to the directors and the statutory auditor of the company; |
| | the determination of the remuneration of the directors and of the statutory auditor for the exercise of their mandate; |
202
Table of Contents
| | the filing of a claim for liability against directors; |
| | the decisions relating to the dissolution, merger and certain other reorganizations of the company; and |
| | the approval of amendments to the articles of association. |
Quorum and Majority Requirements
In general, there is no attendance quorum requirement for a general shareholders meeting and decisions are generally passed with a simple majority of the votes of the shares present or represented. However, capital increases (other than those decided by the board of directors pursuant to the authorized capital), capital reductions, decisions with respect to our Companys dissolution, mergers, demergers and certain other reorganizations of our Company, amendments to the articles of association (other than an amendment of the corporate object), and certain other matters referred to in the Belgian Code on Companies and Associations do not only require the presence or representation of at least 50% of the share capital of our Company but also a majority of at least 75% of the votes cast (whereby abstentions are not included in the numerator nor in the denominator). An amendment of our Companys corporate object requires the approval of at least 80% of the votes cast at a general shareholders meeting (whereby abstentions are not included in the numerator nor in the denominator), which can only validly pass such resolution if at least 50% of the share capital of our Company and at least 50% of the profit certificates, if any, are present or represented. In the event where the required quorum is not present or represented at the first meeting, a second meeting needs to be convened through a new notice. The second general shareholders meeting may validly deliberate and decide regardless of the number of shares present or represented. The special majority requirements, however, remain applicable.
Under the DGCL, the certificate of incorporation or bylaws of a Delaware corporation may specify the number of shares required to constitute a quorum but in no event shall a quorum consist of less than one-third of shares entitled to vote at a meeting. In the absence of such specifications, a majority of shares entitled to vote shall constitute a quorum.
Right to Questions at Meetings
Within the limits of article 7:139 of the Belgian Code on Companies and Associations, holders of securities have a right to ask questions to the directors in connection with the items on the agenda of such general shareholders meeting. Holders of securities can also ask questions to the statutory auditor in connection with the items on the agenda of such general shareholders meeting it reports on. Such questions can be submitted in writing prior to the meeting or can be asked at the meeting. The statutory auditor will immediately communicate any written questions to the board of directors. Written and oral questions will be answered during the meeting concerned in accordance with applicable law. In addition, in order for written questions to be considered, the shareholders who submitted the written questions concerned must comply with the formalities to attend the meeting.
Dividends
All shares participate in the same manner in our profits, if any. Pursuant to the Belgian Code on Companies and Associations, the shareholders can in principle decide on the distribution of profits with a simple majority vote at the occasion of the annual general shareholders meeting, based on the most recent statutory audited financial statements, prepared in accordance with Belgian GAAP and based on a (non-binding) proposal of our Companys board of directors.
Return of Capital
Under the Belgian Code on Companies and Associations, Titan America can return capital to its shareholders. Carrying out such a capital reduction is an exclusive power of the shareholders meeting (resolving pursuant to the special quorum and majority requirements as set out above).
203
Table of Contents
As set out above, the Belgian Code on Companies and Associations mandates that a capital reduction can only be paid-out to shareholders after the expiry of a two months waiting period between the resolution and the payment.
Any available issuance premiums (which, subject to certain conditions, comprise fiscal capital, see Material Belgian Federal Income Tax Considerations) can also be repaid to our shareholders pursuant to a resolution of our shareholders meeting, which can resolve on such repayment under a simple majority vote (without such vote being subject to a quorum requirement).
Our ability to distribute dividends is subject to availability of sufficient distributable profits as defined under Belgian law on the basis of our stand-alone statutory accounts prepared in accordance with Belgian GAAP. In particular, dividends can only be distributed if, following the declaration and issuance of the dividends, the amount of our net assets on the date of the closing of the last financial year as follows from the statutory nonconsolidated financial statements (i.e., summarized, the amount of the assets as shown in the balance sheet, decreased with provisions and liabilities, all in accordance with Belgian accounting rules), and, save in exceptional cases, to be mentioned and justified in the notes to the annual accounts, decreased with the non-amortized costs of incorporation and extension and the non-amortized costs for research and development, does not fall below the amount of the paid-up capital (or, if higher, the issued capital), increased with the amount of non-distributable reserves (which include, as the case may be, the unamortized part of any revaluation surpluses).
In addition, pursuant to Belgian law and our articles of association, we must allocate an amount of 5% of our Belgian GAAP annual net profit to a legal reserve in its stand-alone statutory accounts, until the legal reserve amounts to 10% of our share capital. Our legal reserve currently does not meet this requirement, nor will it meet the requirement at the time of the closing of the offering. Accordingly, 5% of our Belgian GAAP annual net profit during future years will need to be allocated to the legal reserve, further limiting our ability to pay out dividends to our shareholders. Furthermore, additional financial restrictions and other limitations may be contained in future credit agreements.
The right to payment of dividends expires five years after the board of directors declared the dividend payable.
Under the DGCL, a Delaware corporation may pay dividends out of our surplus (the excess of net assets over capital), or in case there is no surplus, out of our net profits for either or both of the fiscal year in which the dividend is declared and the preceding fiscal year (provided that the amount of the capital of the corporation is not less than the aggregate amount of the capital represented by the issued and outstanding stock of all classes having a preference upon the distribution of assets). Dividends may be paid in the form of shares, property or cash.
Appointment of Directors
Pursuant to the Belgian Code on Companies and Associations and the articles of association, the board of directors must consist of at least three directors.
Whenever a board seat becomes vacant, the remaining directors will be entitled to temporarily appoint a new director, whose mandate will need to be confirmed by the shareholder meeting immediately following the such appointment. Absent any resolution to the contrary, an appointed director will finish the term of the director he or she replaces.
Termination of Directors
Pursuant to the Belgian Code on Companies and Associations, our general meeting can revoke the mandate of any member of our board of directors immediately and without cause (ad nutum). Our shareholder meeting is at liberty to award a notice term or severance compensation for the terminated director.
204
Table of Contents
Liquidation Rights
Our Company can only be voluntarily dissolved by a shareholders resolution passed with a majority of at least 75% of the votes cast at an extraordinary meeting of shareholders where at least 50% of the share capital is present or represented. In the event the required quorum is not present or represented at the first meeting, a second meeting needs to be convened through a new notice. The second meeting of shareholders can validly deliberate and decide regardless of the number of shares present or represented.
In the event of the dissolution and liquidation of our Company, the assets remaining after payment of all debts and liquidation expenses will be distributed to the holders of our shares, each receiving a sum on a pro rata basis. Pursuant to article 7:228 of the Belgian Code on Companies and Associations, if, as a result of losses incurred, the ratio of our Companys net assets (determined in accordance with Belgian legal and accounting rules for non-consolidated financial statements) to share capital is less than 50%, the board of directors must convene an extraordinary general shareholders meeting within two months of the date upon which the board of directors discovered or should have discovered this undercapitalization. At this general shareholders meeting the board of directors needs to propose either the dissolution of our Company or the continuation of our Company, in which case the board of directors must propose measures to address our Companys financial situation. The board of directors must justify its proposals in a special report to the shareholders. Shareholders representing at least 75% of the votes validly cast at this meeting have the right to dissolve our Company, provided that at least 50% of our Companys share capital is present or represented at the meeting.
If, as a result of losses incurred, the ratio of our Companys net assets to share capital is less than 25%, the same procedure must be followed, it being understood, however, that in that event shareholders representing 25% of the votes validly cast at the meeting (whereby abstentions are not included in the numerator nor in the denominator) can decide to dissolve our Company.
Pursuant to article 7:229 of the Belgian Code on Companies and Associations, if the amount of our Companys net assets has dropped below EUR 61,500, any interested party is entitled to request the competent court to dissolve our Company. The court can order the dissolution of our Company or grant a grace period within which our Company is to remedy the situation.
If our Company is dissolved for any reason, the liquidation must be carried out by one or more liquidators appointed by the general shareholders meeting. If, based on the statement of assets and liabilities that has been drawn-up in connection with the Companys dissolution, it appears that not all third party creditors of the Company can be fully repaid, the appointment of the aforementioned liquidators will need to be ratified by the enterprise court. During the liquidation, any balance remaining after discharging all debts, liabilities and liquidation costs must first be applied to reimburse, in cash or in kind, the paid-up capital of the shares not yet reimbursed. Any remaining balance shall be equally distributed amongst all the shareholders.
Under the DGCL, unless the board of directors approves the proposal to dissolve, dissolution of a Delaware corporation must be approved by shareholders holding 100% of the total voting power of the corporation. Only if the dissolution is initiated by the board of directors may it be approved by a simple majority of the corporations outstanding shares. The DGCL allows a Delaware corporation to include in its certificate of incorporation a supermajority voting requirement in connection with dissolutions initiated by the board.
Listing
We intend to apply to have our common shares approved for listing on the NYSE under the symbol TTAM.
Transfer Agent, Registrar and Auditor
The transfer agent and registrar for our common shares will be Computershare.
205
Table of Contents
Belgian Legislation
Given that the Company will list on the NYSE and will not, at the date of this prospectus, seek a listing on an EU regulated market, the Company will not be considered a listed company for the purposes of article 1:11 of the Belgian Code on Companies and Associations. As a result, various laws and regulations that would customarily apply to a listed company under Belgian company law (i.e. a company listed on an EU regulated market within the meaning of article 4(1)(21) of Directive 2014/65/EU of the European Parliament and of the Council of 15 May 2014 on markets in financial instruments and amending Directive 2002/92/EC and Directive 2011/61/EU), will not apply to the Company. As a result, the Companys shareholders may not enjoy certain of the rights and protection generally afforded to shareholders of a Belgian listed company.
206
Table of Contents
SHARES ELIGIBLE FOR FUTURE SALE
Prior to this offering, there was no public market for our common shares. Future sales of our common shares in the public market, or the availability for sale of substantial amounts of our common shares in the public market, could adversely affect prevailing market prices and could impair our ability to raise equity capital in the future. Upon completion of this offering, we will have outstanding 184,362,465 common shares. All of the common shares sold in this offering will be freely transferable by persons other than our affiliates without restriction or further registration under the Securities Act. Sales of substantial numbers of our common shares in the public market could adversely affect prevailing market price of our common shares. While we have applied to list our common shares on the NYSE, we cannot assure you that a regular trading market will develop in our common shares.
Rule 144
In general, under Rule 144 of the Securities Act as currently in effect, beginning 90 days after the date of this prospectus, an affiliate who has beneficially owned our shares for a period of at least six months is entitled to sell within any three-month period a number of shares that does not exceed the greater of either 1% of the then outstanding shares or the average weekly trading volume of our shares on the NYSE during the four calendar weeks preceding the filing with the SEC of a notice on Form 144 with respect to such sale. Such sales under Rule 144 of the Securities Act are also subject to prescribed requirements relating to the manner of sale, notice and availability of current public information about us.
Under Rule 144, a person who is not deemed to have been an affiliate of ours at any time during the 90 days preceding a sale, and who has beneficially owned the shares proposed to be sold for at least six months, including the holding period of any prior holder other than an affiliate, is entitled to sell such shares without restriction, provided we have been in compliance with our reporting requirements under the Exchange Act for 90 days preceding such sale. To the extent that our affiliates sell their shares, other than pursuant to Rule 144 or a registration statement, the purchasers holding period for the purpose of effecting a sale under Rule 144 commences on the date of transfer from the affiliate.
Regulation S
Regulation S provides generally that sales made in offshore transactions are not subject to the registration or prospectus-delivery requirements of the Securities Act.
Lock-up Arrangements
For a description of the lock-up arrangements that we, our directors and officers, the selling shareholder and Titan Cement International have entered into with the underwriters in connection with this offering, see Underwriting.
Form S-8 Registration Statements
We intend to file one or more registration statements on Form S-8 under the Securities Act to register our common shares reserved for issuance under our stock plans. The registration statements on Form S-8 will become effective automatically upon filing. Common shares issued upon exercise of a stock option and registered pursuant to the applicable Form S-8 registration statement will, subject to vesting provisions and Rule 144 volume limitations applicable to our affiliates, be available for sale in the open market immediately.
207
Table of Contents
Citigroup Global Markets Inc. and Goldman Sachs & Co. LLC are acting as joint book-running managers of the offering and as representatives of the underwriters named below. Subject to the terms and conditions stated in the underwriting agreement dated the date of this prospectus, each underwriter named below has severally agreed to purchase, and we and the selling shareholder have agreed to sell to that underwriter, the number of shares set forth opposite the underwriters name.
| Underwriter |
Number of Shares |
|||
| Citigroup Global Markets Inc. |
||||
| Goldman Sachs & Co. LLC |
||||
| BofA Securities, Inc. |
||||
| BNP Paribas Securities Corp. |
||||
| Jefferies LLC |
||||
| HSBC Securities (USA) Inc. |
||||
| SG Americas Securities, LLC |
||||
| Stifel, Nicolaus & Company, Incorporated |
||||
|
|
|
|||
| Total |
24,000,000 | |||
|
|
|
|||
The underwriting agreement provides that the obligations of the underwriters to purchase the shares included in this offering are subject to approval of legal matters by counsel and to other conditions. The underwriters are obligated to purchase all the shares (other than those covered by the underwriters option to purchase additional shares described below) if they purchase any of the shares.
Shares sold by the underwriters to the public will initially be offered at the initial public offering price set forth on the cover of this prospectus. Any shares sold by the underwriters to securities dealers may be sold at a discount from the initial public offering price not to exceed $ per share. If all the shares are not sold at the initial offering price, the underwriters may change the offering price and the other selling terms.
If the underwriters sell more shares than the total number set forth in the table above, the selling shareholder has granted to the underwriters an option, exercisable for 30 days from the date of this prospectus, to purchase up to 3,600,000 additional shares at the public offering price less the underwriting discount. The underwriters may exercise the option to purchase additional shares, if any, in connection with this offering.
We, our officers and directors, and the selling shareholder, which is the holder of all of our outstanding shares, have agreed that, for a period of 180 days from the date of this prospectus, we and they will not, without the prior written consent of Citigroup Global Markets Inc. and Goldman Sachs & Co. LLC, dispose of or hedge any shares or any securities convertible into or exchangeable for our common shares. Citigroup Global Markets Inc. and Goldman Sachs & Co. LLC in their sole discretion may release any of the securities subject to these lock-up agreements at any, which, in the case of officers and directors, shall be with notice. Notwithstanding the foregoing, if (i) during the last 17 days of the 180-day restricted period, we issue an earnings release or material news or a material event relating to our Company occurs; or (ii) prior to the expiration of the 180-day restricted period, we announce that we will release earnings results during the 16-day period beginning on the last day of the 180-day restricted period, the restrictions described above shall continue to apply until the expiration of the 18-day period beginning on the issuance of the earnings release or the occurrence of the material news or material event.
Prior to this offering, there has been no public market for our shares. Consequently, the initial public offering price for the shares was determined by negotiations between us, the selling shareholder and the representatives. Among the factors considered in determining the initial public offering price were our results of operations, our current financial condition, our future prospects, our markets, the economic conditions in and future prospects for
208
Table of Contents
the industry in which we compete, our management and currently prevailing general conditions in the equity securities markets, including current market valuations of publicly traded companies considered comparable to our Company. We cannot assure you, however, that the price at which the shares will sell in the public market after this offering will not be lower than the initial public offering price or that an active trading market in our shares will develop and continue after this offering.
We have applied to have our shares listed on the NYSE under the symbol TTAM.
The following table shows the underwriting discounts and commissions that we and the selling shareholder are to pay to the underwriters in connection with this offering. These amounts are shown assuming both no exercise and full exercise of the underwriters option to purchase additional shares.
| Paid by Us | Paid by Selling Shareholder | |||||||||||||||
| No Exercise | Full Exercise | No Exercise | Full Exercise | |||||||||||||
| Per share |
$ | $ | $ | $ | ||||||||||||
| Total |
$ | $ | $ | $ | ||||||||||||
The estimated offering expenses payable by us, exclusive of the underwriting discounts and commissions, are approximately $11,146,081.
In connection with the offering, the underwriters may purchase and sell shares in the open market. Purchases and sales in the open market may include short sales, purchases to cover short positions, which may include purchases pursuant to the underwriters option to purchase additional shares, and stabilizing purchases.
| | Short sales involve secondary market sales by the underwriters of a greater number of shares than they are required to purchase in the offering. |
| | Covered short sales are sales of shares in an amount up to the number of shares represented by the underwriters option to purchase additional shares. |
| | Naked short sales are sales of shares in an amount in excess of the number of shares represented by the underwriters option to purchase additional shares. |
| | Covering transactions involve purchases of shares either pursuant to the underwriters option to purchase additional shares or in the open market in order to cover short positions. |
| | To close a naked short position, the underwriters must purchase shares in the open market. A naked short position is more likely to be created if the underwriters are concerned that there may be downward pressure on the price of the shares in the open market after pricing that could adversely affect investors who purchase in the offering. |
| | To close a covered short position, the underwriters must purchase shares in the open market or must exercise the option to purchase additional shares. In determining the source of shares to close the covered short position, the underwriters will consider, among other things, the price of shares available for purchase in the open market as compared to the price at which they may purchase shares through the underwriters option to purchase additional shares. |
| | Stabilizing transactions involve bids to purchase shares so long as the stabilizing bids do not exceed a specified maximum. |
Purchases to cover short positions and stabilizing purchases, as well as other purchases by the underwriters for their own accounts, may have the effect of preventing or retarding a decline in the market price of the shares. They may also cause the price of the shares to be higher than the price that would otherwise exist in the open market in the absence of these transactions. The underwriters may conduct these transactions on the NYSE, in the over-the-counter market or otherwise. If the underwriters commence any of these transactions, they may discontinue them at any time.
209
Table of Contents
Other Relationships
The underwriters are full service financial institutions engaged in various activities, which may include securities trading, commercial and investment banking, financial advisory, investment management, principal investment, hedging, financing and brokerage activities. The underwriters and their respective affiliates have in the past performed commercial banking, investment banking and advisory services for us from time to time for which they have received customary fees and reimbursement of expenses and may, from time to time, engage in transactions with and perform services for us in the ordinary course of their business for which they may receive customary fees and reimbursement of expenses. In the ordinary course of their various business activities, the underwriters and their respective affiliates may make or hold a broad array of investments and actively trade debt and equity securities (or related derivative securities) and financial instruments (which may include bank loans and/or credit default swaps) for their own account and for the accounts of their customers and may at any time hold long and short positions in such securities and instruments. Such investments and securities activities may involve securities and/or instruments of ours or our affiliates. In addition, affiliates of some of the underwriters are lenders, and in some cases agents or managers for the lenders, under our credit facility. Certain of the underwriters or their affiliates that have a lending relationship with us routinely hedge their credit exposure to us consistent with their customary risk management policies. A typical such hedging strategy would include these underwriters or their affiliates hedging such exposure by entering into transactions which consist of either the purchase of credit default swaps or the creation of short positions in our securities. The underwriters and their affiliates may also make investment recommendations and/or publish or express independent research views in respect of such securities or financial instruments and may hold, or recommend to clients that they acquire, long and/or short positions in such securities and instruments.
We and the selling shareholder have agreed to indemnify the underwriters against certain liabilities, including liabilities under the Securities Act, or to contribute to payments the underwriters may be required to make because of any of those liabilities.
Notice to Prospective Investors in Canada
The common shares may be sold only to purchasers purchasing, or deemed to be purchasing, as principal that are accredited investors, as defined in National Instrument 45-106 Prospectus Exemptions or subsection 73.3(1) of the Securities Act (Ontario), and are permitted clients, as defined in National Instrument 31-103 Registration Requirements, Exemptions and Ongoing Registrant Obligations. Any resale of the common shares must be made in accordance with an exemption from, or in a transaction not subject to, the prospectus requirements of applicable securities laws.
Securities legislation in certain provinces or territories of Canada may provide a purchaser with remedies for rescission or damages if this prospectus (including any amendment thereto) contains a misrepresentation, provided that the remedies for rescission or damages are exercised by the purchaser within the time limit prescribed by the securities legislation of the purchasers province or territory. The purchaser should refer to any applicable provisions of the securities legislation of the purchasers province or territory for particulars of these rights or consult with a legal advisor.
Pursuant to section 3A.3 of National Instrument 33-105 Underwriting Conflicts (NI 33-105), the underwriters are not required to comply with the disclosure requirements of NI 33-105 regarding underwriter conflicts of interest in connection with this offering.
Notice to Prospective Investors in the European Economic Area
In relation to each Member State of the European Economic Area (each, a Relevant State), no common shares have been offered or will be offered pursuant to this offering to the public in that Relevant State prior to the publication of a prospectus in relation to the common shares which has been approved by the competent authority in that Relevant State or, where appropriate, approved in another Relevant State and notified to the competent
210
Table of Contents
authority in that Relevant State, all in accordance with the Prospectus Regulation, except that offers of common shares may be made to the public in that Relevant State at any time under the following exemptions under the Prospectus Regulation:
| | to any legal entity which is a qualified investor as defined under Article 2 of the Prospectus Regulation; |
| | to fewer than 150 natural or legal persons (other than qualified investors as defined under Article 2 of the Prospectus Regulation), subject to obtaining the prior consent of the representatives for any such offer; or |
| | in any other circumstances falling within Article 1(4) of the Prospectus Regulation, |
provided that no such offer of common shares shall require us or any underwriter to publish a prospectus pursuant to Article 3 of the Prospectus Regulation or supplement a prospectus pursuant to Article 23 of the Prospectus Regulation and each person who initially acquires any common shares or to whom any offer is made will be deemed to have represented, acknowledged and agreed to and with each of the underwriters and us that it is a qualified investor within the meaning of Article 2(e) of the Prospectus Regulation.
In the case of any common shares being offered to a financial intermediary as that term is used in the Prospectus Regulation, each such financial intermediary will be deemed to have represented, acknowledged and agreed that the common shares acquired by it in the offer have not been acquired on a non-discretionary basis on behalf of, nor have they been acquired with a view to their offer or resale to, persons in circumstances which may give rise to an offer of any common shares to the public other than their offer or resale in a Relevant State to qualified investors as so defined or in circumstances in which the prior consent of the underwriters has been obtained to each such proposed offer or resale.
For the purposes of this provision, the expression an offer to the public in relation to the common shares in any Relevant State means the communication in any form and by any means of sufficient information on the terms of the offer and any common shares to be offered so as to enable an investor to decide to purchase or subscribe for any common shares, and the expression Prospectus Regulation means Regulation (EU) 2017/1129, as amended.
Notice to Prospective Investors in the United Kingdom
In relation to the United Kingdom, no common shares have been offered or will be offered pursuant to the offering to the public in the United Kingdom prior to the publication in accordance with the U.K. Prospectus Regulation of a prospectus in relation to the common shares that has been approved by the Financial Conduct Authority, except that the common shares may be offered to the public in the United Kingdom at any time under the following exemptions under the U.K. Prospectus Regulation:
| | to any legal entity which is a qualified investor as defined under Article 2 of the U.K. Prospectus Regulation; |
| | to fewer than 150 natural or legal persons (other than qualified investors as defined under Article 2 of the U.K. Prospectus Regulation), subject to obtaining the prior consent of the representatives for any such offer; or |
| | in any other circumstances falling within Section 86 of the Financial Services and Markets Act 2000 (FSMA); |
provided that no such offer of the common shares shall require us or any underwriter to publish a prospectus pursuant to Section 85 of the FSMA or supplement a prospectus pursuant to Article 23 of the U.K. Prospectus Regulation. For the purposes of this provision, the expression an offer to the public in relation to the common shares in the United Kingdom means the communication in any form and by any means of sufficient information on the terms of the offer and any common shares to be offered so as to enable an investor to decide to purchase or subscribe for any common shares and the expression U.K. Prospectus Regulation means Regulation (EU) 2017/1129 as it forms part of domestic law by virtue of the European Union (Withdrawal) Act 2018.
211
Table of Contents
In addition, in the United Kingdom, this document is being distributed only to, and is directed only at, and any offer subsequently made may only be directed at persons who are qualified investors (as defined in the U.K. Prospectus Regulation) (i) who have professional experience in matters relating to investments falling within Article 19(5) of the FSMA (Financial Promotion) Order 2005, as amended, or the Order, and/or (ii) who are high net worth companies (or persons to whom it may otherwise be lawfully communicated) falling within Article 49(2)(a) to (d) of the Order (all such persons together being referred to as relevant persons) or otherwise in circumstances which have not resulted and will not result in an offer to the public of the common shares in the United Kingdom within the meaning of the FSMA. In the United Kingdom, any investment or investment activity to which this document relates is only available to, and will be engaged in with, relevant persons. Any person in the United Kingdom who is not a relevant person must not act on or rely upon this document or any of its contents.
Notice to Prospective Investors in France
Neither this prospectus nor any other offering material relating to the common shares described in this prospectus has been submitted to the clearance procedures of the Autorité des Marchés Financiers or of the competent authority of another member state of the European Economic Area and notified to the Autorité des Marchés Financiers. The common shares have not been offered or sold and will not be offered or sold, directly or indirectly, to the public in France.
Such offers, sales and distributions will be made in France, pursuant to the exemption under Article 1(4)(a) of the Prospectus Regulation, only to qualified investors (investisseurs qualifiés), as defined in Article 2(e) of the Prospectus Regulation and Article L.411-2 1° of the French Monetary and Financial Code and in accordance with Articles L.411-1 and L.411-2 of the French Monetary and Financial Code and applicable French laws and regulations.
Notice to Prospective Investors in Brazil
The offer and sale of the common shares have not been and will not be registered with the Brazilian Securities Commission (Comissão de Valores Mobiliários, or CVM) and, therefore, will not be carried out by any means that would constitute a public offering in Brazil under CVM Resolution No. 160, dated 13 July 2022, as amended (CVM Resolution 160) or unauthorized distribution under Brazilian laws and regulations. the common shares may only be offered to Brazilian Professional Investors (as defined by applicable CVM regulation), who may only acquire the common shares through a non-Brazilian account, with settlement outside Brazil in non-Brazilian currency. the trading of these common shares on regulated securities markets in Brazil is prohibited.
Notice to Prospective Investors in Hong Kong
The common shares may not be offered or sold in Hong Kong by means of any document other than (i) in circumstances which do not constitute an offer to the public within the meaning of the Companies (Winding Up and Miscellaneous Provisions) Ordinance (Cap. 32 of the Laws of Hong Kong) (the Companies (Winding Up and Miscellaneous Provisions) Ordinance) or which do not constitute an invitation to the public within the meaning of the Securities and Futures Ordinance (Cap. 571 of the Laws of Hong Kong) (the Securities and Futures Ordinance), (ii) to professional investors as defined in the Securities and Futures Ordinance and any rules made thereunder or (iii) in other circumstances which do not result in the document being a prospectus as defined in the Companies (Winding Up and Miscellaneous Provisions) Ordinance, and no advertisement, invitation or document relating to the common shares may be issued or may be in the possession of any person for the purpose of issue (in each case whether in Hong Kong or elsewhere), which is directed at, or the contents of which are likely to be accessed or read by, the public in Hong Kong (except if permitted to do so under the securities laws of Hong Kong) other than with respect to common shares which are or are intended to be disposed of only to persons outside Hong Kong or only to professional investors in Hong Kong as defined in the Securities and Futures Ordinance and any rules made thereunder.
212
Table of Contents
Notice to Prospective Investors in Japan
The common shares have not been and will not be registered under the Financial Instruments and Exchange Act of Japan (Act No. 25 of 1948, as amended) (the FIEA). The common shares may not be offered or sold, directly or indirectly, in Japan or to or for the benefit of any resident of Japan (including any person resident in Japan or any corporation or other entity organized under the laws of Japan) or to others for reoffering or resale, directly or indirectly, in Japan or to or for the benefit of any resident of Japan, except pursuant to an exemption from the registration requirements of the FIEA and otherwise in compliance with any relevant laws and regulations of Japan.
Notice to Prospective Investors in Singapore
This prospectus has not been and will not be registered as a prospectus under the Securities and Futures Act 2001 (the SFA) by the Monetary Authority of Singapore. Accordingly, this prospectus and any other document or material in connection with the offer or sale, or invitation for subscription or purchase, of the common shares may not be circulated or distributed, nor may the common shares be offered or sold, or be made the subject of an invitation for subscription or purchase, whether directly or indirectly, to persons in Singapore other than (i) to an institutional investor (as defined in Section 4A of the SFA) under Section 274 of the SFA, (ii) to a relevant person (as defined in Section 275(2) of the SFA) pursuant to Section 275(1) of the SFA, or any person pursuant to Section 275(1A) of the SFA, and in accordance with the conditions specified in Section 275 of the SFA or (iii) otherwise pursuant to, and in accordance with the conditions of, any other applicable provision of the SFA, in each case subject to conditions set forth in the SFA.
Where the common shares are subscribed or acquired pursuant to an offer made in reliance on Section 275 of the SFA by a relevant person which is (a) a corporation (which is not an accredited investor (as defined in Section 4A of the SFA)) the sole business of which is to hold investments and the entire share capital of which is owned by one or more individuals, each of whom is an accredited investor or (b) a trust (where the trustee is not an accredited investor) the sole purpose of which is to hold investments and each beneficiary of the trust is an individual who is an accredited investor, securities or securities-based derivatives contacts (each as defined in the SFA) of that corporation shall not be transferable for six months after that corporation has acquired the common shares under Section 275 of the SFA except: (i) to an institutional investor or to a relevant person defined in Section 275(2) of the SFA, or to any person arising from an offer referred to in Section 275(1A) or Section 276(4)(i)(B) of the SFA; (ii) where no consideration is or will be given for the transfer; (iii) where the transfer is by operation of law; (iv) as specified in Section 276(7) of the SFA; or (v) as specified in Regulation 37A of the Securities and Futures (Offers of Investments) (Securities and Securities-based Derivatives Contracts) Regulations 2018.
Solely for the purposes of our obligations pursuant to Section 309B of the SFA, we have determined, and hereby notify all relevant persons (as defined in the CMP Regulations 2018), that the common shares are prescribed capital markets products (as defined in the CMP Regulations 2018) and Excluded Investment Products (as defined in MAS Notice SFA 04-N12: Notice on the Sale of Investment Products and MAS Notice FAA-N16: Notice on Recommendations on Investment Products).
213
Table of Contents
MATERIAL U.S. FEDERAL INCOME TAX CONSIDERATIONS
Material U.S. Federal Income Tax Considerations
The following is a summary of material U.S. federal income tax considerations that are likely to be relevant to the purchase, ownership and disposition of our common shares by a U.S. Holder (as defined below).
This summary is based on provisions of the Internal Revenue Code of 1986, as amended (the Code), and regulations, rulings and judicial interpretations thereof, in force as of the date hereof, and income tax treaty between the United States and Belgium (the Treaty). Those authorities may be changed at any time, perhaps retroactively, so as to result in U.S. federal income tax consequences different from those summarized below.
This summary is not a comprehensive discussion of all of the tax considerations that may be relevant to a particular investors decision to purchase, hold or dispose of common shares. In particular, this summary is directed only to U.S. Holders that hold common shares as capital assets and does not address particular tax consequences that may be applicable to U.S. Holders who may be subject to special tax rules, such as banks, brokers or dealers in securities or currencies, traders in securities electing to mark to market, financial institutions, life insurance companies, tax-exempt entities, regulated investment companies, entities or arrangements that are treated as partnerships for U.S. federal income tax purposes (or partners therein), holders that own or are treated as owning 10% or more of our stock by vote or value, persons holding common shares as part of a hedging or conversion transaction or a straddle, or persons whose functional currency is not the U.S. dollar. Moreover, this summary does not address state, local or foreign taxes, the U.S. federal estate and gift taxes, or the Medicare contribution tax applicable to net investment income of certain non-corporate U.S. Holders, or alternative minimum tax consequences of acquiring, holding or disposing of common shares.
For purposes of this summary, a U.S. Holder is a beneficial owner of common shares that is a citizen or resident of the United States or a domestic U.S. corporation or that otherwise is subject to U.S. federal income taxation on a net income basis in respect of such common shares.
You should consult your own tax advisors about the consequences of the acquisition, ownership and disposition of the common shares, including the relevance to your particular situation of the considerations discussed below and any consequences arising under foreign, state, local or other tax laws.
Taxation of Dividends
Subject to the discussion below under Passive Foreign Investment Company Status, the gross amount of any distribution of cash or property with respect to our common shares (including any amount withheld in respect of Belgian taxes) that is paid out of our current or accumulated earnings and profits (as determined for U.S. federal income tax purposes) will generally be includible in your taxable income as ordinary dividend income on the day on which you receive the dividend and will not be eligible for the dividends-received deduction allowed to corporations under the Code.
We do not expect to maintain calculations of our earnings and profits in accordance with U.S. federal income tax principles. U.S. Holders therefore should expect that distributions generally will be treated as dividends for U.S. federal income tax purposes.
Subject to certain exceptions for short-term positions, dividends received by an individual with respect to the common shares will be subject to taxation at a preferential rate if the dividends are qualified dividends. Dividends paid on the common shares will be treated as qualified dividends if:
| | the common shares are readily tradable on an established securities market in the United States or we are eligible for the benefits of a comprehensive tax treaty with the United States that the U.S. Treasury determines is satisfactory for purposes of this provision and that includes an exchange of information program; and |
214
Table of Contents
| | we were not, in the year prior to the year in which the dividend was paid, and are not, in the year in which the dividend is paid, a PFIC. |
The common shares will be listed on the NYSE, and will qualify as readily tradable on an established securities market in the United States so long as they are so listed. In addition, the U.S. Treasury has determined that the double tax treaty concluded between Belgium and the U.S. concerning the avoidance of double taxation (the Treaty) meets the requirements for reduced rates of taxation, and we believe we are eligible for the benefits of the Treaty. Based on our financial statements and our expectations about the nature and amount of our income, assets and activities and the market value of our equity, we do not believe that we were a PFIC for our most recent taxable year, and we do not expect to become a PFIC for our current taxable year or in the foreseeable future. Holders should consult their own tax advisors regarding the availability of the reduced dividend tax rate in light of their own particular circumstances.
Subject to generally applicable limitations and conditions, Belgian dividend withholding tax paid at the appropriate rate applicable to the U.S. Holder may be eligible for a credit against such U.S. Holders U.S. federal income tax liability. The U.S. Internal Revenue Service (IRS) promulgated regulations in December 2021 that provide additional limitations and conditions, and recently issued temporary guidance that modify such regulations. If the Belgian dividend tax is not a creditable tax for a U.S. Holder or the U.S. Holder does not elect to claim a foreign tax credit for any foreign income taxes paid or accrued in the same taxable year, the U.S. Holder may be able to deduct the Belgian tax in computing such U.S. Holders taxable income for U.S. federal income tax purposes. Dividend distributions will constitute income from sources without the United States and, for U.S. Holders that elect to claim foreign tax credits, generally will constitute passive category income for foreign tax credit purposes.
The availability and calculation of foreign tax credits and deductions for foreign taxes depend on a U.S. Holders particular circumstances and involve the application of complex rules to those circumstances. The temporary guidance discussed above also indicates that the U.S. Treasury and the IRS are considering proposing amendments to the December 2021 regulations and that the temporary guidance can be relied upon until additional guidance is issued that withdraws or modifies the temporary guidance. U.S. Holders should consult their own tax advisors regarding the application of these rules to their particular situations.
U.S. Holders that receive distributions of additional shares or rights to subscribe for shares as part of a pro rata distribution to all our shareholders generally will not be subject to U.S. federal income tax in respect of the distributions, unless the U.S. Holder has the right to receive cash or property instead, in which case the U.S. Holder will be treated as if it received cash equal to the fair market value of the distribution.
Taxation of Dispositions of Common Shares
Subject to the discussion below under Passive Foreign Investment Company Status, upon a sale, exchange or other taxable disposition of the common shares, U.S. Holders will realize gain or loss for U.S. federal income tax purposes in an amount equal to the difference between the amount realized on the disposition and the U.S. Holders adjusted tax basis in the common shares, as determined in U.S. dollars as discussed below. Such gain or loss will be capital gain or loss, and will generally be treated as from sources within the United States and long-term capital gain or loss if the common shares have been held for more than one year. Long-term capital gain realized by a U.S. Holder that is an individual generally is subject to taxation at a preferential rate. The deductibility of capital losses is subject to limitations.
Passive Foreign Investment Company Status
Special U.S. tax rules apply to companies that are considered to be PFICs. We will be classified as a PFIC in a particular taxable year if, taking into account our proportionate share of the income and assets of our subsidiaries under applicable look-through rules, either
| | at least 75% of our gross income for the taxable year is passive income; or |
215
Table of Contents
| | at least 50% of the value (generally determined based on a quarterly average) of our assets is attributable to assets that produce, or are held for the production of, passive income. |
Based on our financial statements and our expectations about the nature and amount of our income, assets and activities and the market value of our equity, we do not believe that we were a PFIC for our most recent taxable year, and we do not expect to become a PFIC for our current taxable year or in the foreseeable future. However, the PFIC tests must be applied each year, and it is possible that we may become a PFIC in a future year. In the event that, contrary to our expectation, we are classified as a PFIC in any year, you generally would be subject to a special tax at ordinary income tax rates on excess distributions, including certain distributions by us and gain that you recognize on the sale of your common shares. The amount of income tax on any excess distributions will be increased by an interest charge to compensate for tax deferral, calculated as if the excess distributions were earned ratably over the period you hold your common shares.
If you are a U.S. Holder that owns an equity interest in a PFIC, you generally must annually file IRS Form 8621, and may be required to file other IRS forms. A failure to file one or more of these forms as required may toll the running of the statute of limitations in respect of each of your taxable years for which such form is required to be filed. As a result, the taxable years with respect to which you fail to file the form may remain open to assessment by the IRS indefinitely, until the form is filed.
You should consult your own tax advisor regarding the U.S. federal income tax considerations discussed above.
Foreign Financial Asset Reporting.
Individual U.S. Holders that own specified foreign financial assets with an aggregate value in excess of U.S.$50,000 on the last day of the taxable year, or U.S.$75,000 at any time during the taxable year, are generally required to file an information statement along with their tax returns, currently on Form 8938, with respect to such assets. Specified foreign financial assets include any financial accounts held at a non-U.S. financial institution, as well as securities issued by a non-U.S. issuer that are not held in accounts maintained by financial institutions. Higher reporting thresholds apply to certain individuals living abroad and to certain married individuals. Regulations extend this reporting requirement to certain entities that are treated as formed or availed of to hold direct or indirect interests in specified foreign financial assets based on objective criteria. U.S. Holders who fail to report the required information could be subject to substantial penalties. In addition, the statute of limitations for assessment of tax would be suspended, in whole or part. Prospective investors are encouraged to consult with their own tax advisors regarding the possible application of these rules, including the application of the rules to their particular circumstances.
Backup Withholding and Information Reporting
Dividends paid to, and proceeds from a sale or other disposition by, a U.S. Holder in respect of the common shares generally may be subject to the information reporting requirements of the Code and may be subject to backup withholding unless the U.S. Holder provides an accurate taxpayer identification number and makes any other required certification or otherwise establishes an exemption. Backup withholding is not an additional tax. The amount of any backup withholding from a payment to a U.S. Holder will be allowed as a refund or credit against the U.S. Holders U.S. federal income tax liability, provided the required information is furnished to the U.S. Internal Revenue Service in a timely manner.
A holder that is not a U.S. Holder may be required to comply with certification and identification procedures in order to establish its exemption from information reporting and backup withholding.
216
Table of Contents
MATERIAL BELGIAN FEDERAL INCOME TAX CONSIDERATIONS
The following is a summary of the principal Belgian tax consequences for U.S. investors relating to the acquisition, the ownership and disposal of the common shares. This summary is based on the applicable laws, treaties and regulatory interpretations as in effect in Belgium on the date of this document, all of which are subject to change, including changes that could have a retroactive effect, so as to result in Belgian tax consequences for U.S. investors different from those summarized below.
The summary only discusses Belgian tax aspects which are relevant to U.S. tax resident holders of the common shares. References in this section to non-residents refer to U.S. tax resident holders of the common shares (i.e., non-residents of Belgium). This summary does not purport to address all tax consequences associated with the acquisition, ownership and disposal of the common shares, and does not take into account the specific circumstances of any particular investor or the tax laws of any country other than Belgium. Moreover, it does not address specific rules, such as Belgian federal or regional estate and gift tax, nor the tax treatment of investors who are subject to special rules, such as financial institutions, insurance companies, collective investment undertakings, dealers in securities or currencies or persons who hold the shares as a position in a straddle, share-repurchase transactions, conversion transactions, a synthetic security or other integrated financial transaction. This summary does not address the local taxes that may be due in connection with an investment in the common shares.
Investors should consult their own advisers regarding the tax consequences of an investment in the common shares in light of their particular situation, including the effect of any state, local, regional or other national laws, treaties and regulatory interpretations thereof.
| 1. | Dividends |
Dividend withholding tax
For Belgian income tax purposes, the gross amount of all benefits paid on or attributed to the common shares is generally treated as a dividend distribution. By way of exception, the repayment of capital carried out in accordance with the Belgian Code on Companies and Associations is not treated as a dividend distribution to the extent that such repayment is imputed to fiscal capital. Generally, fiscal capital includes paid-up statutory capital. Share premiums and other amounts subscribed to by paid-up contributions in cash or in kind (other than in industry (nijverheid/industrie)) at the time of the issuance of profit participating certificates or shares, are normally assimilated to fiscal paid-up capital if they are (and continue to be) reflected on one or more separate equity accounts on the liabilities side of the balance sheet. Note that, since 1 January 2018, any decision of capital reduction in accordance with the Belgian Code on Companies and Associations, the amount of the capital reduction will be deemed to be derived proportionally (a) from the fiscal capital and the amounts equivalent to the fiscal capital (such as share premiums assimilated to fiscal capital), on the one hand and (b) on the other hand, from the total of (i) certain taxed reserves incorporated in the capital, (ii) certain taxed reserves not incorporated into the capital and (iii) certain untaxed reserves incorporated into the capital (it being understood that the imputation of the capital reduction on these different categories of reserves will be made in that order of priority). The part of the capital reduction that is deemed to be derived from the abovementioned taxed and untaxed reserves will be treated as a dividend distribution from a tax perspective. The part of the capital reduction that is deemed to derive from the abovementioned untaxed reserves may additionally give rise to a corporate income tax charge at the level of the Company.
Belgian withholding tax of 30% is normally levied at source on dividends, subject to such relief as may be available under applicable domestic or tax treaty provisions.
In the case of a redemption of the common shares, the redemption distribution (after deduction of the part of the fiscal capital represented by the redeemed common shares) will be treated as a dividend subject to a Belgian withholding tax of 30%, subject to such relief as may be available under applicable domestic or tax treaty provisions. No withholding tax will be triggered if this redemption is carried out on a stock exchange and meets certain conditions.
217
Table of Contents
In case of a liquidation of the issuer, any amounts distributed in excess of the fiscal capital related to those shares will be treated as a dividend subject to the 30% withholding tax, subject to such relief as may be available under applicable domestic provisions or tax treaty provisions.
For non-resident individuals, corporations or other legal entities the withholding tax levied at source will in principle be the only tax on dividends in Belgium, unless the non-resident holds the common shares in connection with a business conducted in Belgium through a fixed base in Belgium or a permanent establishment in Belgium (in which case other rules apply).
Belgian dividend withholding tax relief for non-residents
Dividends distributed to non-resident individuals who do not use the common shares in the exercise of a professional activity, may be eligible for the tax exemption with respect to ordinary dividends for an amount of up to EUR 833 (amount applicable for income year 2024) per year. For the avoidance of doubt, all qualifying dividends paid or attributed to such non-resident individuals (and hence not only dividends paid or attributed on the common shares) are taken into account to assess whether such maximum amount is reached. Consequently, if Belgian withholding tax has been levied on dividends paid or attributed to the common shares, such non-resident individual may request in its Belgian non-resident individual income tax return that any Belgian withholding tax levied on up to such an amount be credited and, as the case may be, reimbursed via the assessment notice (i.e., tax bill). However, if no Belgian non-resident individual income tax return has to be filed by the non-resident individual, any Belgian withholding tax levied on up to such an amount could in principle be reclaimed by filing a request thereto addressed to the relevant tax official within the relevant timing deadlines (and subject to some formalities).
Belgian tax law provides for certain exemptions from withholding tax on Belgian source dividends distributed to non-resident investors. For example, under Belgian tax law, withholding tax is not due on dividends paid to a foreign pension fund which satisfies the following conditions: (i) it is a non-resident saver within the meaning of Article 227, 3° of the Belgian Income Tax Code which implies that it has separate legal personality and has its tax residence outside of Belgium; (ii) its corporate purpose consists solely in managing and investing funds collected in order to pay legal or complementary pensions; (iii) its activity is limited to the investment of funds collected in the exercise of its corporate purpose, without any profit making aim; (iv) it is exempt from income tax in its country of residence; and (v) it is not contractually obliged to redistribute the dividends to any ultimate beneficiary of such dividends for whom it would manage the common shares, nor obliged to pay a manufactured dividend with respect to the common shares under a securities borrowing transaction (unless the ultimate beneficiary also qualifies as such pension fund or as a qualifying parent company). The exemption will only apply if the foreign pension fund provides a certificate confirming that it is the full legal owner or usufruct holder of the common shares and that the above conditions are satisfied.
Dividends distributed to non-resident companies established in a EU Member State other than Belgium or in a country with which Belgium has concluded a double tax treaty that includes a qualifying exchange of information clause and qualifying as a parent company will, subject to conditions, be exempt from Belgian withholding tax provided that the common shares held by the non-resident company, upon payment or attribution of the dividends, amount to at least 10% of the issuers share capital and such minimum participation is held or will be held during an uninterrupted period of at least one year (for the purpose of determining the minimum holding in the share capital of the subsidiary in the name of the transferor, pledgor or lender, no account shall be taken of shares which, at the time the income is allocated or made payable, are the subject of a security agreement or a loan relating to those shares). A company qualifies as a parent company provided that (i) it has a legal form listed in the annex to the EU Parent-Subsidiary Directive of November 30, 2011 (2011/96/EU) (the EU Parent-Subsidiary Directive) as amended from time to time, or, a similar legal form in a country with which Belgium has concluded a double tax treaty; (ii) it is considered to be a tax resident according to the tax laws of the country where it is established and the double tax treaties concluded between such country and third countries; and (iii) it is subject to corporate income tax or a similar tax without benefiting from a tax regime that derogates from the ordinary tax regime. In order to benefit from this exemption, the investor must provide the
218
Table of Contents
issuer or its paying agent with a certificate confirming its qualifying status and the fact that it meets the three abovementioned conditions. If the investor holds a minimum participation for less than one year, at the time the dividends are paid on or attributed to the common shares, the issuer or the Belgian paying agent will provisionally withhold the withholding tax but will not transfer it to the Belgian Treasury provided that the investor certifies its qualifying status, the date from which the investor has held such minimum participation, its commitment to hold the minimum participation for an uninterrupted period of at least one year and its commitment to immediately notify the issuer of a reduction of its shareholding below such threshold prior to the end of the one-year holding period. Upon satisfying the one-year shareholding requirement, the provisionally withheld dividend withholding tax will be passed on to the investor.
Please note that the above withholding tax exemptions will not be applicable to dividends which are connected to an arrangement or a series of arrangements for which the tax Belgian tax administration, taking into account all relevant facts and circumstances, has proven, absent evidence to the contrary, that this arrangement or this series of arrangements is not genuine and has been put in place for the main purpose or one of the main purposes of obtaining the dividend received deduction, the above dividend withholding tax exemption or one of the advantages of the EU Parent-Subsidiary Directive in another EU Member State. An arrangement or a series of arrangements is regarded as not genuine to the extent that they are not put into place for valid commercial reasons which reflect economic reality. In addition, for dividends paid to a non-resident company whose corporate purpose consists solely or primarily in managing and investing funds collected in order to pay legal or complementary pensions, there is a (rebuttable) presumption that the arrangement or series of arrangements is not genuine if that company has not held the shares on which the dividends are distributed in full ownership for an uninterrupted period of 60 days. Dividends distributed by a Belgian company to non-resident companies on a share participation of less than 10% will under certain conditions be subject to an exemption from withholding tax, provided that the non-resident companies (i) are established in a EEA Member State other than Belgium or in a country with which Belgium has concluded a double tax treaty, where that treaty, or any other treaty concluded between Belgium and that jurisdiction, includes a qualifying exchange of information clause; (ii) have a legal form as the ones listed in Annex I, Part A to the EU Parent-Subsidiary Directive as amended from time to time or, have a legal form comparable to those listed in said Annex and which is governed by the law of another Member State or by the law of a country with which Belgium has concluded a double tax treaty; (iii) hold a share participation in the Belgian dividend distributing company, upon payment or attribution of the dividends, of less than 10% of the share capital but with an acquisition value of at least EUR 2.5 million; (iv) hold or will hold the common shares which give rise to the dividends in full legal ownership during an uninterrupted period of at least one year; and (v) are subject to the corporate income tax regime or a tax regime similar to the corporate income tax without benefiting from a tax regime which deviates from the ordinary regime. The exemption from withholding tax is only applied to the extent that the Belgian withholding tax, which would be applicable absent the exemption, could not be credited nor reimbursed at the level of the qualifying, dividend receiving, company. The non-resident company must provide a certificate confirming, in addition to its full name, legal form, address and fiscal identification number (if applicable), its qualifying status and the fact that it meets the required conditions mentioned under (i) to (v) above, and indicating to which extent the withholding tax, which would be applicable absent the exemption, is in principle creditable or reimbursable on the basis of the law as applicable on 31 December of the year preceding the year during which the dividend is paid or attributed.
In addition to the above, Belgium and the U.S. concluded the Treaty. The Treaty reduces the applicability of Belgian withholding tax to 15%, 5% or 0% for U.S. taxpayers, provided that the U.S. taxpayer meets the limitation of benefits conditions imposed by the Treaty. The Belgian withholding tax is generally reduced to 15% under the Treaty. The 5% withholding tax applies in case where the U.S. shareholder (beneficial owner) is a company which owns directly at least 10% of the voting stock of the issuer. A 0% Belgian withholding tax applies when the shareholder is a company (beneficial owner) that, for a period of 12 months ending on the date on which the dividend is declared, has directly owned shares representing at least 10% of capital of the company paying the dividends or is, subject to certain conditions, a U.S. pension fund. The reduction may be obtained either directly at source or through a refund of taxes withheld in excess of the applicable tax treaty rate.
219
Table of Contents
Prospective investors should consult their own tax advisors as to whether they qualify for a reduction of, or exemption from, Belgian withholding tax upon payment or attribution of dividends and as to the procedural requirements for obtaining such a reduction or exemption or making claims for a refund.
| 2. | Capital Gains and Losses on common shares |
Pursuant to the Treaty, capital gains and/or losses realized by a U.S. investor that does not hold the common shares in connection with a business conducted in Belgium through a Belgian establishment from the sale, exchange or other disposition of the common shares do not fall within the scope of application of Belgian domestic tax law.
Capital gains realised on the common shares by a non-resident individual who is not entitled to claim the benefits of the Treaty and has not acquired the common shares in connection with a business conducted in Belgium through a fixed base in Belgium are in principle not subject to taxation provided that the transactions fall within the scope of the normal management of ones private estate. However, such capital gains might under certain circumstances be subject to tax in Belgium if the capital gains are obtained or received in Belgium and arise from transactions which are to be considered speculative or beyond the normal management of ones private estate or in case of disposal of a substantial participation in a Belgian company (i.e., of more than 25%). Capital losses are generally not tax deductible. Such non-resident individuals might therefore be obliged to file a tax return and should consult their own tax adviser.
Non-resident companies that have not acquired the common shares in connection with a business conducted in Belgium through a Belgian establishment are generally not subject to taxation in Belgium on capital gains on those common shares. Capital losses are generally not deductible. Non-resident companies that hold the common shares in connection with a business conducted in Belgium through a Belgian establishment will be subject to different rules.
Capital gains realised by non-residents upon the redemption of the common shares or upon the liquidation of the issuer will generally be taxable as a dividend (see above).
| 3. | Tax on stock exchange transactions |
The sale and acquisition of the common shares on the secondary market is subject to a tax on stock exchange transactions if (i) executed in Belgium through a professional intermediary, or (ii) deemed to be executed in Belgium, which is the case if the order is directly or indirectly made to a professional intermediary established outside of Belgium, either by private individuals with habitual residence in Belgium, or legal entities for the account of their seat or establishment in Belgium. Transactions on the primary market are not subject to this tax.
The tax is due at a rate of 0.35% and is applied separately on each sale and each acquisition, currently up to a maximum of EUR 1,600 per taxable transaction. A separate tax is due by each party to the transaction (i.e. both seller and purchaser), and both taxes are collected by the professional intermediary. However, if the intermediary is established outside of Belgium, the tax will in principle be due by the ordering private individual or legal entity, unless that individual or entity can demonstrate that the tax has already been paid. Professional intermediaries established outside of Belgium can, subject to certain conditions and formalities, appoint a Belgian representative for tax purposes, which will be jointly and severally liable for the tax on stock exchange transactions in respect of the transactions executed through the professional intermediary.
Exemptions apply for non-residents and certain categories of institutional investors acting for their own account provided that certain formalities are respected. Thus, in general, non-residents who purchase or otherwise acquire or transfer, for consideration, common shares in Belgium for their own account through a professional intermediary may be exempt if they deliver a sworn affidavit to the intermediary in Belgium confirming their non-resident status.
220
Table of Contents
Please note that a general anti-abuse provision is available to the Belgian tax authorities with regard to the tax on stock exchange transactions.
As stated below, the European Commission has published a proposal for a Directive for a common financial transactions tax (the FTT). The proposal currently stipulates that once the FTT enters into force, the participating Member States shall not maintain or introduce taxes on financial transactions other than the FTT (or VAT as provided in the Council Directive 2006/112/EC of November 28, 2006 on the common system of value added tax). For Belgium, the tax on stock exchange transactions should thus be abolished once the FTT enters into force. The proposal is still subject to negotiation between the participating Member States and therefore may be changed at any time.
| 4. | Annual tax on securities accounts |
An annual tax on securities accounts (the Annual Tax on Securities Accounts) is levied on securities accounts of which the average value during the reference period (i.e., a period of twelve consecutive months beginning on 1 October and ending, in principle, on 30 September of the next year), exceeds EUR 1,000,000. The Annual Tax on Securities Accounts is applicable to securities accounts that are held by resident individuals, companies and legal entities or a Belgian permanent establishment of a foreign company, irrespective as to whether these accounts are held with a financial intermediary in Belgium or abroad. The Annual Tax on Securities Accounts also applies to securities accounts held by non-residents individuals, companies and legal entities with a financial intermediary in Belgium. However, the Annual Tax on Securities Accounts is not levied on securities accounts held by specific types of regulated entities in the context of their own professional activity and for their own account.
The applicable tax rate is equal to the lowest amount of either 0.15% of the average value of the financial instruments held on the account or 10% of the difference between the average value of the financial instruments held on the account and EUR 1,000,000. The tax base is the sum of the values of the taxable financial instruments at the different reference points in time, i.e., 31 December, 31 March, 30 June and 30 September, divided by the number of those points in time.
The Annual Tax on Securities Accounts needs to be withheld, declared and paid by the Belgian intermediary. Intermediaries not established or set up in Belgium have the possibility, when managing a securities account subject to the tax, to appoint a representative in Belgium approved by or on behalf of the Minister of Finance. In all other cases, the holder of the account is responsible for declaring and paying the tax.
Please note that a general anti-abuse provision is available to the Belgian tax authorities with regard to the Annual Tax on Securities Accounts.
Investors should consult their own tax advisers in relation to this Annual Tax on Securities Accounts.
| 5. | The proposed FTT |
On February 14, 2013, the EU Commission adopted the draft Directive for a common FTT in Belgium, Germany, Estonia, Greece, Spain, France, Italy, Austria, Portugal, Slovenia and Slovakia (the participating Member States). The draft Directive currently stipulates that once the FTT enters into force, the participating Member States shall not maintain or introduce taxes on financial transactions other than the FTT (or VAT as provided in the Council Directive 2006/112/EC of 28 November 2006 on the common system of value added tax). For Belgium, the tax on stock exchange transactions should thus be abolished once the FTT enters into force. The draft Directive is still subject to negotiation between the participating Member States and therefore may be changed at any time. Estonia has already indicated that it does not wish to participate.
| 6. | Common Reporting Standard (CRS) |
The exchange of information is governed by the CRS. As of May 16, 2024, 123 jurisdictions had signed the multilateral competent authority agreement (MCAA), which is a multilateral framework agreement to
221
Table of Contents
automatically exchange financial and personal information, with the subsequent bilateral exchanges coming into effect between those signatories that file the subsequent notifications.
Under CRS, financial institutions resident in a CRS country are required to report, according to a due diligence standard, financial information with respect to reportable accounts, which includes interest, dividends, account balance or value, income from certain insurance products, sales proceeds from financial assets and other income generated with respect to assets held in the account or payments made with respect to the account. Reportable accounts include accounts held by individuals and entities (which includes trusts and foundations) with fiscal residence in another CRS country. The standard includes a requirement to look through passive entities to report on the relevant controlling persons.
On December 9, 2014, EU Member States adopted Directive 2014/107/EU on administrative cooperation in direct taxation (DAC2), which provides for mandatory automatic exchange of financial information as foreseen in CRS. DAC2 amends the previous Directive on administrative cooperation in direct taxation, Directive 2011/16/EU.
Belgium has implemented the DAC2 and the CRS by the law of December 16, 2015 regarding the exchange of financial account information between Belgian financial institutions and the Federal Public Service Finances in the framework of automatic information exchange on an international level and for tax purposes (the Law of December 16, 2015).
As a result of the Law of December 16, 2015, the mandatory automatic exchange of information applies in Belgium (i) since income year 2016 (first information exchange in 2017) towards the EU Member States, (ii) since income year 2014 (first information exchange in 2016) towards the U.S. and (iii), with respect to any other non-EU States that have signed the MCAA, as of the respective date to be further determined by Royal Decree. In a Royal Decree of June 14, 2017, as amended, it has been provided that the automatic exchange of information has to be provided (i) as from 2017 (for financial year 2016) for a first list of eighteen foreign jurisdictions, (ii) as from 2018 (for financial year 2017) for a second list of 44 jurisdictions, (iii) as from 2019 (for financial year 2018) for a third list of another jurisdiction, (iv) as from 2020 (for financial year 2019) a fourth list of six jurisdictions and (v) as from 2023 (for financial year 2022) a fifth list of two jurisdictions and (vi) as from 2024 (for financial year 2023) a sixth list of four jurisdictions.
Investors who are in any doubt as to their position should consult their professional advisers.
222
Table of Contents
EXPENSES RELATED TO THE OFFERING
The following table sets forth the costs and expenses, other than underwriting discounts and commissions, paid and payable by us and/or the selling shareholder in connection with the offer and sale of common shares in this offering. All amounts listed below are estimates except the SEC registration fee, NYSE listing fee and FINRA filing fee.
| Itemized Expense |
Amount | |||
| SEC registration fee |
$ | 76,061 | ||
| NYSE listing fee |
55,000 | |||
| FINRA filing fee |
75,020 | |||
| Printing and engraving expenses |
800,000 | |||
| Transfer agent and registrar fees |
140,000 | |||
| Legal fees and expenses |
5,000,000 | |||
| Accounting fees and expenses |
3,500,000 | |||
| Miscellaneous |
1,500,000 | |||
|
|
|
|||
| Total |
$ | 11,146,081 | (1) | |
|
|
|
|||
| (1) | All of these estimated expenses are expected to be paid by Titan America. |
223
Table of Contents
Certain matters of U.S. federal law will be passed upon for us by Cleary Gottlieb Steen & Hamilton LLP and for the underwriters by Latham & Watkins LLP. The validity of our common shares and certain other matters of Belgian law will be passed upon for us by A&O Shearman LLP and for the underwriters by NautaDutilh BV.
224
Table of Contents
The consolidated financial statements as of December 31, 2023 and December 31, 2022 and for each of the three years in the period ended December 31, 2023 included in this Prospectus have been so included in reliance on the report of PricewaterhouseCoopers LLP, an independent registered public accounting firm, given on the authority of said firm as experts in auditing and accounting.
The technical information appearing in this prospectus concerning Pennsuco was derived from the Technical Report Summary for Pennsuco Quarry, Miami-Dade County, Florida, dated August 30, 2024, prepared by Continental Placer Inc., independent geological and environmental consultants.
The technical information appearing in this prospectus concerning Roanoke was derived from the Technical Report Summary for Roanoke Quarry, Botetourt County, Virginia, dated August 30, 2024, prepared by Continental Placer Inc., independent geological and environmental consultants.
225
Table of Contents
WHERE YOU CAN FIND MORE INFORMATION
We have filed with the SEC a registration statement on Form F-1 under the Securities Act with respect to the sale of common shares under this prospectus. This prospectus, which constitutes a part of the registration statement, does not contain all of the information set forth in the registration statement, some of which is contained in exhibits to the registration statement as permitted by the rules and regulations of the SEC. For further information with respect to us and our common shares, we refer you to the registration statement, including the exhibits filed as a part of the registration statement. Statements contained in this prospectus concerning the contents of any contract or any other document are not necessarily complete descriptions of all terms of such documents. If a contract or document has been filed as an exhibit to the registration statement, please see the copy of the contract or document that has been filed. Each statement in this prospectus relating to a contract or document filed as an exhibit is qualified in all respects by the filed exhibit. The SEC maintains an Internet website that contains reports and other information about issuers, like us, that file electronically with the SEC. The address of that website is www.sec.gov.
We currently do not file periodic reports with the SEC. As a result of this offering, we will become subject to the information and reporting requirements of the Exchange Act that are applicable to foreign private issuers, and, in accordance with this law, will file periodic reports and other information with the SEC. These periodic reports and other information will be available for inspection and copying at the SECs public reference facilities and the website of the SEC referred to above. We also maintain a website at www.titanamerica.com. Upon completion of this offering, you may access these materials free of charge as soon as reasonably practicable after they are electronically filed with or furnished to the SEC. Information contained on our website is not a part of this prospectus and the inclusion of our website address in this prospectus is an inactive textual reference only. As a foreign private issuer, we are exempt under the Exchange Act from, among other things, the rules prescribing the furnishing and content of proxy statements, and our executive officers, directors and shareholders are exempt from the reporting and short-swing profit recovery provisions contained in Section 16 of the Exchange Act. In addition, we will not be required under the Exchange Act to file periodic reports and financial statements with the SEC as frequently or as promptly as U.S. companies whose securities are registered under the Exchange Act.
As a foreign private issuer, we are also exempt from the requirements of Regulation FD (Fair Disclosure) which, generally, are meant to ensure that select groups of investors are not privy to specific information about an issuer before other investors. We are, however, still subject to the anti-fraud and anti-manipulation rules of the SEC, such as Rule 10b-5. Since many of the disclosure obligations required of us as a foreign private issuer are different than those required of domestic U.S. reporting companies, our shareholders, potential shareholders and the investing public in general should not expect to receive information about us in the same amount, or at the same time, as information is received from, or provided by, other domestic U.S. reporting companies.
226
Table of Contents
Titan America SA and Subsidiaries
As of December 31, 2023 and 2022 and for the years ended December 31, 2023, 2022 and 2021
| Contents | ||||
| F-2 | ||||
| F-4 | ||||
| F-5 | ||||
| F-6 | ||||
| F-8 | ||||
| F-9 | ||||
| F-11 | ||||
As of September 30, 2024 and December 31, 2023 and for the nine months ended September 30, 2024 and 2023
Table of Contents
Report of Independent Registered Public Accounting Firm
To the Board of Directors and Stockholder of Titan America SA
Opinion on the Financial Statements
We have audited the accompanying consolidated statements of financial position of Titan America SA and its subsidiaries (the Company) as of December 31, 2023 and 2022, and the related consolidated statements of income, other comprehensive income, changes in stockholders equity and cash flows, for each of the three years in the period ended December 31, 2023, including the related notes (collectively referred to as the consolidated financial statements). In our opinion, the consolidated financial statements present fairly, in all material respects, the financial position of the Company as of December 31, 2023 and 2022, and the results of its operations and its cash flows for each of the three years in the period ended December 31, 2023 in conformity with International Financial Reporting Standards as issued by the International Accounting Standards Board.
Basis for Opinion
These consolidated financial statements are the responsibility of the Companys management. Our responsibility is to express an opinion on the Companys consolidated financial statements based on our audits. We are a public accounting firm registered with the Public Company Accounting Oversight Board (United States) (PCAOB) and are required to be independent with respect to the Company in accordance with the U.S. federal securities laws and the applicable rules and regulations of the Securities and Exchange Commission and the PCAOB.
We conducted our audits of these consolidated financial statements in accordance with the standards of the PCAOB. Those standards require that we plan and perform the audit to obtain reasonable assurance about whether the consolidated financial statements are free of material misstatement, whether due to error or fraud.
Our audits included performing procedures to assess the risks of material misstatement of the consolidated financial statements, whether due to error or fraud, and performing procedures that respond to those risks. Such procedures included examining, on a test basis, evidence regarding the amounts and disclosures in the consolidated financial statements. Our audits also included evaluating the accounting principles used and significant estimates made by management, as well as evaluating the overall presentation of the consolidated financial statements. We believe that our audits provide a reasonable basis for our opinion.
Critical Audit Matters
The critical audit matters communicated below are matters arising from the current period audit of the consolidated financial statements that were communicated or required to be communicated to the audit committee and that (i) relate to accounts or disclosures that are material to the consolidated financial statements and (ii) involved our especially challenging, subjective, or complex judgments. The communication of critical audit matters does not alter in any way our opinion on the consolidated financial statements, taken as a whole, and we are not, by communicating the critical audit matters below, providing separate opinions on the critical audit matters or on the accounts or disclosures to which they relate.
Valuation of Provisions for Restoration Obligations, Environmental and Equipment Removal
As described in Notes 1, 2 and 21 to the consolidated financial statements, the Companys restoration obligations, environmental and equipment removal provisions totaled $33.9 million as of December 31, 2023. The Company is required to restore the land used for quarries and processing sites at the end of their productive lives to a condition acceptable for the relevant authorities and consistent with the Companys environmental policies. Provisions for restoration obligations, environmental and equipment removal are recognized when the
F-2
Table of Contents
Company has a present legal or constructive obligation as a result of past events, it is probable that an outflow of resources will be required to settle the obligation and the amount can be reliably estimated. Management estimates its ultimate liability using detailed engineering calculations that consider the amount and timing of the future cash flows. The present value of these future cash flows is determined by applying discount rates consistent with the time horizons of the expected future cash flows. The significant assumptions used by management include the current cost estimates for restoration obligations, environmental and equipment activities, inflation rates and discount rates.
The principal considerations for our determination that performing procedures relating to the valuation of provisions for restoration obligations, environmental and equipment removal is a critical audit matter are (i) the significant judgment by management in developing the fair value estimate of the provisions for restoration obligations, environmental and equipment removal; (ii) a high degree of auditor judgment, subjectivity, and effort in performing procedures and evaluating managements significant assumptions related to current cost estimates, inflation rates and the discount rates; and (iii) the audit effort involved the use of professionals with specialized skill and knowledge.
Addressing the matter involved performing procedures and evaluating audit evidence in connection with forming our overall opinion on the consolidated financial statements. These procedures included, among others (i) testing managements process for developing the fair value estimate of the provisions for restoration obligations, environmental and equipment removal; (ii) testing the completeness and accuracy of the data used in the current cost estimates, inflation rates and discount rates; and (iii) the involvement of professionals with specialized skill and knowledge to assist in evaluating (a) the appropriateness of the discounted cash flow model used by management; (b) correspondence with regulatory agencies; and (c) the reasonableness of the current cost estimates, inflation rates and discount rates assumptions.
Revenue Recognition from Certain Revenue Components
As described in Note 3 to the consolidated financial statements, substantially all of the Companys revenue is derived from sales of cement, fly ash, aggregates, ready-mix concrete and concrete blocks and related products (collectively, the certain revenue components). Control over the goods subject to each sales contract transfers at a point in time. The transaction price for each sales contract is determined by reference to the quantity requested and price established in the order. Some of the contracts offer discounts for prompt payment. In these cases, revenue is recorded in the amount the business expects to be entitled to. The Companys total revenue from the certain revenue components was $1,588.9 million for the year ended December 31, 2023.
The principal consideration for our determination that performing procedures relating to revenue recognition from the certain revenue components is a critical audit matter is a high degree of auditor effort in performing procedures related to the Companys revenue recognition for the certain revenue components.
Addressing the matter involved performing procedures and evaluating audit evidence in connection with forming our overall opinion on the consolidated financial statements. These procedures included, among others (i) evaluating, on a test basis, the accuracy and occurrence of transactions recognized as revenue by obtaining and inspecting source documents, such as invoices, customer purchase orders, shipping documents and cash receipts from customers; and (ii) confirming a sample of outstanding customer invoice balances as of December 31, 2023 and, for confirmations not returned, obtaining and inspecting source documents, such as cash receipts from customers.
/s/ PricewaterhouseCoopers LLP
Washington, District of Columbia
December 20, 2024
We have served as the Companys or its predecessors auditor since 2015.
F-3
Table of Contents
Titan America SA and Subsidiaries
Consolidated Statements of Income
| (all amounts in thousands of US$ except for earnings per share) | Years Ended December 31, | |||||||||||||
| Notes | 2023 | 2022 | 2021 | |||||||||||
| Revenue |
3 | $ | 1,591,601 | $ | 1,364,146 | $ | 1,152,417 | |||||||
| Cost of goods sold |
4 | (1,228,112 | ) | (1,142,880 | ) | (956,261 | ) | |||||||
|
|
|
|
|
|
|
|||||||||
| Gross profit |
363,489 | 221,266 | 196,156 | |||||||||||
|
|
|
|
|
|
|
|||||||||
| Selling expense |
5 | (31,009 | ) | (29,938 | ) | (24,724 | ) | |||||||
| General and administrative expense |
6 | (99,909 | ) | (87,513 | ) | (76,292 | ) | |||||||
| Net impairment losses on financial assets |
(1,224 | ) | (3,711 | ) | (937 | ) | ||||||||
| Fair value loss on sale of accounts receivable, net |
7 | (6,113 | ) | (3,041 | ) | (1,101 | ) | |||||||
| Other operating income/(loss), net |
402 | (21 | ) | 1,073 | ||||||||||
|
|
|
|
|
|
|
|||||||||
| Operating income |
225,636 | 97,042 | 94,175 | |||||||||||
|
|
|
|
|
|
|
|||||||||
| Finance cost, net |
8 | (22,244 | ) | (19,078 | ) | (21,856 | ) | |||||||
| Income/(loss) from associate |
| 272 | (682 | ) | ||||||||||
| Foreign exchange (loss)/gain, net |
9 | (11,981 | ) | 19,990 | 28,835 | |||||||||
| Derivative financial instrument gain/(loss), net |
9 | 10,967 | (18,534 | ) | (25,915 | ) | ||||||||
|
|
|
|
|
|
|
|||||||||
| Income before income taxes |
202,378 | 79,692 | 74,557 | |||||||||||
|
|
|
|
|
|
|
|||||||||
| Income tax expense |
19 | (47,134 | ) | (16,971 | ) | (15,336 | ) | |||||||
|
|
|
|
|
|
|
|||||||||
| Net income |
$ | 155,244 | $ | 62,721 | $ | 59,221 | ||||||||
|
|
|
|
|
|
|
|||||||||
| Earnings per share of common stock (Note 26): |
||||||||||||||
| Basic earnings per share |
$ | 0.89 | $ | 0.36 | $ | 0.34 | ||||||||
| Diluted earnings per share |
$ | 0.89 | $ | 0.36 | $ | 0.34 | ||||||||
| Weighted average number of common stock - basic and diluted |
175,362,465 | 175,362,465 | 175,362,465 | |||||||||||
The accompanying notes are an integral part of these audited financial statements.
F-4
Table of Contents
Titan America SA and Subsidiaries
Consolidated Statements of Other Comprehensive Income
| (all amounts in thousands of US$) | Years Ended December 31, |
|||||||||||||||
| Notes | 2023 | 2022 | 2021 | |||||||||||||
| Net income |
$ | 155,244 | $ | 62,721 | $ | 59,221 | ||||||||||
| Other comprehensive income: |
||||||||||||||||
| Other comprehensive income to be reclassified to profit or loss in subsequent periods |
||||||||||||||||
| Gains/(losses) on cash flow hedges |
9,25 | (4,387 | ) | 4,267 | 826 | |||||||||||
| Reclassification to income statement |
7,327 | (5,969 | ) | (1,996 | ) | |||||||||||
| Income tax relating to these items |
(750 | ) | 434 | 298 | ||||||||||||
|
|
|
|
|
|
|
|||||||||||
| Net gain/(loss) on cash flow hedge |
2,190 | (1,268 | ) | (872 | ) | |||||||||||
|
|
|
|
|
|
|
|||||||||||
| Net other comprehensive income/(expense) to be reclassified to profit or loss in subsequent periods |
2,190 | (1,268 | ) | (872 | ) | |||||||||||
| Items not to be reclassified to profit or loss in subsequent periods |
||||||||||||||||
| Re-measurement gains on defined benefit plans |
20 | 806 | 538 | 1,291 | ||||||||||||
| Income tax relating to these items |
(205 | ) | (137 | ) | (328 | ) | ||||||||||
|
|
|
|
|
|
|
|||||||||||
| Net gain on defined benefit plans |
601 | 401 | 963 | |||||||||||||
| Cumulative translation adjustments |
293 | (7 | ) | 722 | ||||||||||||
|
|
|
|
|
|
|
|||||||||||
| Net other comprehensive income not to be reclassified to profit or loss in subsequent periods |
894 | 394 | 1,685 | |||||||||||||
| Other comprehensive income/(loss), net of tax |
3,084 | (874 | ) | 813 | ||||||||||||
|
|
|
|
|
|
|
|||||||||||
| Total comprehensive income, net of tax |
$ | 158,328 | $ | 61,847 | $ | 60,034 | ||||||||||
|
|
|
|
|
|
|
|||||||||||
The accompanying notes are an integral part of these audited financial statements.
F-5
Table of Contents
Titan America SA and Subsidiaries
Consolidated Statements of Financial Position
| (all amounts in thousands of US$) | December 31 | |||||||||||
| Notes | 2023 | 2022 | ||||||||||
| Current assets: |
||||||||||||
| Cash and cash equivalents |
1.11 | $ | 22,036 | $ | 29,841 | |||||||
| Derivative financial instruments |
9 | 5,315 | 3,841 | |||||||||
| Derivative credit support payments |
9 | 11,470 | 9,538 | |||||||||
| Trade receivables, net |
15 | 55,873 | 56,445 | |||||||||
| Other receivables, net |
17 | 65,121 | 60,363 | |||||||||
| Inventories |
14 | 189,989 | 180,804 | |||||||||
| Prepaid expenses and other current assets |
16 | 16,194 | 15,196 | |||||||||
| Income taxes receivable |
6,901 | 867 | ||||||||||
|
|
|
|
|
|||||||||
| Total current assets |
372,899 | 356,895 | ||||||||||
| Noncurrent assets: |
||||||||||||
| Derivative financial instruments |
9 | 2,071 | 3,711 | |||||||||
| Derivative credit support payments |
9 | | 12,909 | |||||||||
| Property, plant, equipment and mineral deposits, net |
10 | 801,031 | 748,266 | |||||||||
| Right-of-use assets |
11 | 61,441 | 61,673 | |||||||||
| Other assets |
6,586 | 6,200 | ||||||||||
| Intangible assets, net |
12 | 33,213 | 36,016 | |||||||||
| Goodwill |
13 | 221,562 | 221,562 | |||||||||
|
|
|
|
|
|||||||||
| Total noncurrent assets |
1,125,904 | 1,090,337 | ||||||||||
|
|
|
|
|
|||||||||
| Total assets |
$ | 1,498,803 | $ | 1,447,232 | ||||||||
|
|
|
|
|
|||||||||
The accompanying notes are an integral part of these audited financial statements.
F-6
Table of Contents
Titan America SA and Subsidiaries
Consolidated Statements of Financial Position (continued)
| (all amounts in thousands of US$) | December 31 | |||||||||||
| Notes | 2023 | 2022 | ||||||||||
| Current liabilities: |
||||||||||||
| Accounts payable |
$ | 151,229 | $ | 175,368 | ||||||||
| Derivative financial instruments |
9 | 10,512 | 8,218 | |||||||||
| Related party payables |
23 | 11,467 | 9,359 | |||||||||
| Accrued expenses |
22 | 20,757 | 28,226 | |||||||||
| Derivative credit support receipts |
9 | 5,061 | 3,010 | |||||||||
| Provisions |
21 | 10,452 | 8,989 | |||||||||
| Contract liabilities |
1,090 | 928 | ||||||||||
| Income taxes payable |
1,999 | 3,489 | ||||||||||
| Short-term borrowings, including accrued interest |
18 | 267,670 | 74,339 | |||||||||
| Lease liabilities |
11 | 11,737 | 13,532 | |||||||||
|
|
|
|
|
|||||||||
| Total current liabilities |
491,974 | 325,458 | ||||||||||
|
|
|
|
|
|||||||||
| Noncurrent liabilities: |
||||||||||||
| Long-term borrowings |
18 | 76,262 | 320,167 | |||||||||
| Retirement benefit obligations |
20 | 4,310 | 4,352 | |||||||||
| Derivative financial instruments |
9 | | 12,909 | |||||||||
| Derivative credit support receipts |
9 | 2,081 | 3,680 | |||||||||
| Provisions |
21 | 55,302 | 38,737 | |||||||||
| Contract liabilities |
868 | 1,417 | ||||||||||
| Other noncurrent liabilities |
114 | 788 | ||||||||||
| Lease liabilities |
11 | 53,744 | 54,055 | |||||||||
| Deferred income tax liability |
19 | 94,377 | 92,942 | |||||||||
|
|
|
|
|
|||||||||
| Total noncurrent liabilities |
287,058 | 529,047 | ||||||||||
|
|
|
|
|
|||||||||
| Total liabilities |
779,032 | 854,505 | ||||||||||
|
|
|
|
|
|||||||||
| Stockholders equity: |
||||||||||||
| Common stock |
28 | 25,219 | 25,219 | |||||||||
| Share premium |
168,791 | 165,982 | ||||||||||
| Capital reserves |
4,039 | 2,822 | ||||||||||
| Retained earnings |
518,621 | 398,687 | ||||||||||
| Accumulated other comprehensive income/(loss) |
3,101 | 17 | ||||||||||
|
|
|
|
|
|||||||||
| Total stockholders equity |
719,771 | 592,727 | ||||||||||
|
|
|
|
|
|||||||||
| Total liabilities and stockholders equity |
$ | 1,498,803 | $ | 1,447,232 | ||||||||
|
|
|
|
|
|||||||||
The accompanying notes are an integral part of these audited financial statements.
F-7
Table of Contents
Titan America SA and Subsidiaries
Consolidated Statements of Changes in Stockholders Equity
| (all amounts in thousands of US$) | Notes | Common Stock |
Share Premium |
Capital Reserves |
Retained Earnings |
Accumulated Other Comprehensive Income/(Loss) |
Total Stockholders Equity |
|||||||||||||||||||||
| January 1, 2021 |
$ | 24,807 | $ | 244,654 | 2,822 | $ | 277,656 | $ | 78 | $ | 550,017 | |||||||||||||||||
| Net income |
| | | 59,221 | | 59,221 | ||||||||||||||||||||||
| Actuarial gain on defined benefit plans, net of tax |
20 | | | | | 963 | 963 | |||||||||||||||||||||
| Capitalization of Reserves |
23 | 82,784 | (82,784 | ) | | | | | ||||||||||||||||||||
| Return of capital |
23 | (82,372 | ) | | | | | (82,372 | ) | |||||||||||||||||||
| Capital Increase Expenses |
| (911 | ) | | | | (911 | ) | ||||||||||||||||||||
| Reclass of capital increase expenses to retained earnings |
| 911 | | (911 | ) | | | |||||||||||||||||||||
| Cash flow hedge, net of tax |
| | | | (872 | ) | (872 | ) | ||||||||||||||||||||
| Stock-based compensation expense |
23 | | 2,039 | | | | 2,039 | |||||||||||||||||||||
| Change in stock compensation excess tax benefit |
| 6 | | | | 6 | ||||||||||||||||||||||
| Cumulative translation adjustments |
| | | | 722 | 722 | ||||||||||||||||||||||
|
|
|
|
|
|
|
|
|
|
|
|
|
|||||||||||||||||
| December 31, 2021 |
$ | 25,219 | $ | 163,915 | $ | 2,822 | $ | 335,966 | $ | 891 | $ | 528,813 | ||||||||||||||||
| January 1, 2022 |
$ | 25,219 | $ | 163,915 | $ | 2,822 | $ | 335,966 | $ | 891 | $ | 528,813 | ||||||||||||||||
| Net income |
| | | 62,721 | | 62,721 | ||||||||||||||||||||||
| Actuarial gain on defined benefit plans, net of tax |
20 | | | | | 401 | 401 | |||||||||||||||||||||
| Cash flow hedge, net of tax |
| | | | (1,268 | ) | (1,268 | ) | ||||||||||||||||||||
| Stock-based compensation expense |
23 | | 2,104 | | | | 2,104 | |||||||||||||||||||||
| Change in stock compensation excess tax benefit |
| (37 | ) | | | | (37 | ) | ||||||||||||||||||||
| Cumulative translation adjustments |
| | | | (7 | ) | (7 | ) | ||||||||||||||||||||
|
|
|
|
|
|
|
|
|
|
|
|
|
|||||||||||||||||
| December 31, 2022 |
$ | 25,219 | $ | 165,982 | $ | 2,822 | $ | 398,687 | $ | 17 | $ | 592,727 | ||||||||||||||||
| January 1, 2023 |
$ | 25,219 | $ | 165,982 | $ | 2,822 | $ | 398,687 | $ | 17 | $ | 592,727 | ||||||||||||||||
| Net income |
| | | 155,244 | | 155,244 | ||||||||||||||||||||||
| Reserve |
| | 1,217 | (1,217 | ) | | | |||||||||||||||||||||
| Dividend |
23 | | | | (33,786 | ) | | (33,786 | ) | |||||||||||||||||||
| Actuarial gain on defined benefit plans, net of tax |
20 | | | | | 601 | 601 | |||||||||||||||||||||
| Cash flow hedge, net of tax |
| | | | 2,190 | 2,190 | ||||||||||||||||||||||
| Stock-based compensation expense |
23 | | 3,147 | | | | 3,147 | |||||||||||||||||||||
| Related party recharge for stock-based compensation |
23 | | (1,333 | ) | | (429 | ) | | (1,762 | ) | ||||||||||||||||||
| Change in stock compensation excess tax benefit |
| 995 | | 122 | | 1,117 | ||||||||||||||||||||||
| Cumulative translation adjustments |
| | | | 293 | 293 | ||||||||||||||||||||||
|
|
|
|
|
|
|
|
|
|
|
|
|
|||||||||||||||||
| December 31, 2023 |
$ | 25,219 | $ | 168,791 | $ | 4,039 | $ | 518,621 | $ | 3,101 | $ | 719,771 | ||||||||||||||||
|
|
|
|
|
|
|
|
|
|
|
|
|
|||||||||||||||||
The accompanying notes are an integral part of these audited financial statements.
F-8
Table of Contents
Titan America SA and Subsidiaries
Consolidated Statements of Cash Flows
| (all amounts in thousands of US$) | Years Ended December 31, | |||||||||||||||
| Notes | 2023 | 2022 | 2021 | |||||||||||||
| Cash flows from operating activities |
||||||||||||||||
| Income before income taxes |
$ | 202,378 | $ | 79,692 | $ | 74,557 | ||||||||||
| Adjustments for: |
||||||||||||||||
| Depreciation, depletion and amortization |
10,11,12 | 91,079 | 87,728 | 81,731 | ||||||||||||
| Finance cost |
8 | 23,194 | 19,514 | 22,327 | ||||||||||||
| Finance income |
(950 | ) | (436 | ) | (471 | ) | ||||||||||
| Foreign exchange loss/(gain), net |
9 | 11,981 | (19,990 | ) | (28,835 | ) | ||||||||||
| Derivative financial instrument (gain)/loss, net |
9 | (10,967 | ) | 18,534 | 25,915 | |||||||||||
| Changes in net operating assets and liabilities |
(42,326 | ) | (5,639 | ) | (32,983 | ) | ||||||||||
| Other |
5,853 | 4,285 | 2,453 | |||||||||||||
|
|
|
|
|
|
|
|||||||||||
| Cash generated from operations before income taxes |
280,242 | 183,688 | 144,694 | |||||||||||||
| Income taxes (paid)/received |
(53,117 | ) | (5,314 | ) | 2,009 | |||||||||||
|
|
|
|
|
|
|
|||||||||||
| Net cash provided by operating activities |
227,125 | 178,374 | 146,703 | |||||||||||||
|
|
|
|
|
|
|
|||||||||||
| Cash flows from investing activities |
||||||||||||||||
| Investments in property, plant and equipment |
10 | (117,144 | ) | (125,374 | ) | (62,269 | ) | |||||||||
| Investments in intangible assets |
12 | (1,600 | ) | (2,896 | ) | (9,185 | ) | |||||||||
| Interest received |
950 | 436 | 471 | |||||||||||||
| Distributions from associate |
| 272 | | |||||||||||||
| Proceeds from the sale of assets, net of disposition costs |
141 | 261 | 685 | |||||||||||||
|
|
|
|
|
|
|
|||||||||||
| Net cash used in investing activities |
(117,653 | ) | (127,301 | ) | (70,298 | ) | ||||||||||
|
|
|
|
|
|
|
|||||||||||
The accompanying notes are an integral part of these audited financial statements.
F-9
Table of Contents
Titan America SA and Subsidiaries
Consolidated Statements of Cash Flows (continued)
| (all amounts in thousands of US$) | Years Ended December 31, | |||||||||||||||
| Notes | 2023 | 2022 | 2021 | |||||||||||||
| Cash flows from financing activities |
||||||||||||||||
| Repayment of affiliated party borrowings |
18 | (37,838 | ) | (96,707 | ) | (92,021 | ) | |||||||||
| Borrowings from affiliated party |
18 | 45,537 | 95,240 | 133 | ||||||||||||
| Offering costs associated with borrowings |
18 | | (781 | ) | (862 | ) | ||||||||||
| Borrowings from third party line of credit |
35,000 | 115,000 | 37,000 | |||||||||||||
| Repayment of third party line of credit |
(105,000 | ) | (75,000 | ) | (7,000 | ) | ||||||||||
| Lease payments |
18 | (12,151 | ) | (11,390 | ) | (14,510 | ) | |||||||||
| Return of capital |
| | (82,372 | ) | ||||||||||||
| Dividends paid |
23 | (33,786 | ) | | | |||||||||||
| Capital increase expenses |
| | (911 | ) | ||||||||||||
| Related party recharge for stock-based compensation |
23 | (429 | ) | | | |||||||||||
| Settlement of derivative financial instrument receipts/(payments) |
18 | 3,272 | (19,827 | ) | 6,528 | |||||||||||
| Derivative credit support receipts/(payments) |
18 | 11,399 | 490 | (30,017 | ) | |||||||||||
| Net (payments)/receipts under cash management line of credit |
| (7,761 | ) | 7,761 | ||||||||||||
| Interest paid |
(23,783 | ) | (20,925 | ) | (20,867 | ) | ||||||||||
|
|
|
|
|
|
|
|||||||||||
| Net cash used in financing activities |
(117,779 | ) | (21,661 | ) | (197,138 | ) | ||||||||||
|
|
|
|
|
|
|
|||||||||||
| Net (decrease)/increase in cash and cash equivalents |
(8,307 | ) | 29,412 | (120,733 | ) | |||||||||||
| Cash and cash equivalents at: |
||||||||||||||||
| Beginning of period |
29,841 | 202 | 121,462 | |||||||||||||
| Effects of exchange rate changes |
502 | 227 | (527 | ) | ||||||||||||
|
|
|
|
|
|
|
|||||||||||
| End of period |
$ | 22,036 | $ | 29,841 | $ | 202 | ||||||||||
|
|
|
|
|
|
|
|||||||||||
| Changes in net operating assets and liabilities |
||||||||||||||||
| Inventories |
$ | (9,185 | ) | $ | (40,644 | ) | (17,848 | ) | ||||||||
| Trade receivables, net |
(604 | ) | (7,582 | ) | (13,879 | ) | ||||||||||
| Other receivables, net |
(3,637 | ) | (5,398 | ) | (20,154 | ) | ||||||||||
| Prepaid expenses and other current assets |
(998 | ) | (3,144 | ) | (530 | ) | ||||||||||
| Other assets |
101 | 651 | 809 | |||||||||||||
| Accounts payable |
(29,532 | ) | 57,273 | 16,155 | ||||||||||||
| Accrued expenses |
(4,372 | ) | (6,675 | ) | 2,138 | |||||||||||
| Provisions |
3,822 | (2,167 | ) | (537 | ) | |||||||||||
| Other liabilities |
(672 | ) | (471 | ) | 385 | |||||||||||
| Retirement benefit obligations |
210 | 120 | (167 | ) | ||||||||||||
| Operating related party activity |
2,541 | 2,398 | 645 | |||||||||||||
|
|
|
|
|
|
|
|||||||||||
| Changes in net operating assets and liabilities |
$ | (42,326 | ) | $ | (5,639 | ) | $ | (32,983 | ) | |||||||
|
|
|
|
|
|
|
|||||||||||
The principal non-cash investing and financing transactions are accrued purchases of property, plant, and equipment and leasing of right-of-use assets, refer to Note 10 and 11. For additional details about changes in liabilities arising from financing activities, refer to Note 18.
The accompanying notes are an integral part of these audited financial statements.
F-10
Table of Contents
Titan America SA and Subsidiaries
Notes to Consolidated Financial Statements
December 31, 2023, 2022 and 2021
(All amounts in thousands)
| 1. | General information and summary of material accounting policies |
Titan America SA (Titan America) is a Belgium-based holding company, incorporated on July 17, 2024 for the purpose of facilitating an initial public offering and other related transactions in order to carry on the business of Titan Atlantic Cement Industrial and Commercial S.A. (Titan Atlantic). Titan Americas primary role is that of a holding company, and it will not engage in significant operational activities. Its sole material asset is its investment in Titan Atlantic. Titan America, along with its wholly owned subsidiaries including Titan Atlantic, are referred to as the Company.
The Company, through its wholly owned subsidiaries, primarily operates in the manufacture, distribution, and sale of cement, fly ash, aggregates, ready-mix concrete, and concrete block to resellers and construction contractors in the Eastern region of the United States. Titan Americas principal offices are located in Belgium.
Reorganization Transaction
On December 18, 2024, Titan Cement International SA (TCI), contributed Titan Atlantic to Titan America in exchange for 175,342,465 common shares representing 100% of the equity in Titan America (the Reorganization Transaction). The Reorganization Transaction signified a continuation of Titan Atlantics operations within a new legal framework, rather than the initiation of new business activities. The Reorganization Transaction represents an internal reorganization of entities under common control and is not within the scope of IFRS 3, Business Combinations. As a result, the consolidated financial statements for periods prior to the Reorganization Transaction reflect the operations of our predecessor, Titan Atlantic.
The consolidated financial statements for the years ended December 31, 2023, 2022 and 2021 were authorized for issuance by the Board of Directors of the Company on December 20, 2024.
Summary of material accounting policies
The principal accounting policies adopted in the preparation of these financial statements are set forth below:
| 1.1. | Basis of preparation |
These consolidated financial statements have been prepared in accordance with International Financial Reporting Standards, as issued by the International Accounting Standards Board (IFRS Accounting Standards). The definition of IFRS Accounting Standards also encompasses all valid International Accounting Standards (IAS), as well as all interpretations of the International Financial Reporting Interpretations Committee (IFRIC), including those formally issued by the Standing Interpretations Committee.
These financial statements have been prepared under the historical cost convention, except for certain financial assets and liabilities (including derivative financial instruments) and defined benefit pension plan assets, which are measured at fair value.
The preparation of financial statements in conformity with IFRS Accounting Standards requires the use of certain critical accounting estimates. It also requires management to exercise its judgment in the process of applying the accounting policies. The areas involving a higher degree of judgment or complexity, or areas where assumptions and estimates are significant to the financial statements are described in Note 2.
F-11
Table of Contents
Titan America SA and Subsidiaries
Notes to Consolidated Financial Statements
December 31, 2023, 2022 and 2021
(All amounts in thousands)
The financial statements have been prepared using the same accounting policies as the prior year, except for the adoption of the new or revised standards, amendments and/or interpretations that became mandatory for periods beginning on or after January 1, 2023.
The accompanying consolidated financial statements present the results of operations, financial position, and cash flows of the Company, which includes the historical consolidated financial information of our predecessor, Titan Atlantic, prior to the Reorganization. The earnings per share of the Company have been presented to retrospectively reflect the capital structure of the Company in connection with the Reorganization Transaction.
| 1.1.1. | New and amended standards and interpretations |
Certain new accounting standards and interpretations have been published that are not mandatory for December 31, 2023 reporting periods and have not been early adopted by the Company. The Company is currently assessing whether these standards will have a material impact on the Company in the current or future periods and on foreseeable future transactions.
| | Classification of Liabilities as Current or Non-current Amendments to IAS 1 (January 1, 2024) |
| | Lease Liability in a Sale and Leaseback Amendments to IFRS 16 |
| | Presentation and Disclosure in Financial Statements IFRS 18 |
| | Financial Instruments Amendments to IFRS 9 |
| | Financial Instruments: Disclosures Amendments to IFRS 7 |
| | Disclosures of Revenues and Expenses for Reportable Segments IFRIC Interpretations Committee Agenda Decision IFRS 8 |
The Company has applied the following standards and amendments for the first time in the annual reporting period commencing on January 1, 2023:
| | Disclosure of accounting policies Amendments to IAS 1 and IFRS Practice statement 2 (January 1, 2023) |
| | Definition of accounting estimates Amendments to IAS 8 (January 1, 2023) |
| | Deferred Tax related to Assets and Liabilities arising from a single Transaction Amendments to IAS 12 (January 1, 2023) |
| | International Tax Reform Pillar Two Model Rules amendments to IAS 12 (January 1, 2023) (see Note 19) |
The amendments listed above did not have a material impact on the amounts recognized in prior periods and are not expected to materially affect the current or future periods.
| 1.2. | Consolidation |
(a) Subsidiaries
The consolidated financial statements comprise the financial statements of the Company and its subsidiaries. All intercompany balances and transactions have been eliminated in consolidation. Subsidiaries are all entities over which the Company has control. The Company controls an entity when the Company is exposed to, or has rights to, variable returns from its involvement with the entity and has the ability to affect those returns through its power over the entity. Subsidiaries are fully consolidated from the date on which control is transferred to the Company. They are deconsolidated from the date that control ceases.
F-12
Table of Contents
Titan America SA and Subsidiaries
Notes to Consolidated Financial Statements
December 31, 2023, 2022 and 2021
(All amounts in thousands)
A listing of Company subsidiaries at December 31, 2023, 2022 and 2021 follows:
| List of Legal Entities | Country of incorporation |
State of incorporation |
Nature of business | 2023 % of investment |
2022 % of investment |
2021 % of investment |
||||||||||||
| Titan Atlantic Cement Industrial and Commercial S.A. |
Greece | N/A | Investment holding company |
100 | 100 | 100 | ||||||||||||
| Titan America LLC |
USA | Delaware | Investment holding company |
100 | 100 | 100 | ||||||||||||
| Essex Cement Company LLC |
USA | Delaware | Trading company | 100 | 100 | 100 | ||||||||||||
| Mechanicsville Concrete LLC |
USA | Virginia |
Ready-mix producer |
100 | 100 | 100 | ||||||||||||
| Pennsuco Cement Company LLC |
USA | Delaware | Investment holding company |
100 | 100 | 100 | ||||||||||||
| Roanoke Cement Company LLC |
USA | Virginia | Cement producer | 100 | 100 | 100 | ||||||||||||
| S&W Ready Mix LLC |
USA | North Carolina |
Ready-mix producer |
100 | 100 | 100 | ||||||||||||
| Separation Technologies LLC |
USA | Delaware | Fly ash beneficiation |
100 | 100 | 100 | ||||||||||||
| ST Equipment & Technology LLC |
USA | Delaware | Sales and engineering services |
100 | 100 | 100 | ||||||||||||
| ST Equipment & Technology Trading Company LLC |
USA | Delaware | Trading company | 100 | 100 | 100 | ||||||||||||
| ST Mid-Atlantic LLC |
USA | North Carolina |
Investment holding company |
N/A | 100 | 100 | ||||||||||||
| Titan Florida LLC |
USA | Delaware | Cement, aggregates, ready-mix and concrete block producer |
100 | 100 | 100 | ||||||||||||
| Titan Mid-Atlantic Aggregates LLC |
USA | Virginia | Aggregates producer |
100 | 100 | 100 | ||||||||||||
| Titan Virginia Ready-Mix |
USA | Delaware |
Ready-mix concrete producer |
100 | 100 | 100 | ||||||||||||
| Trusa Realty LLC |
USA | Florida | Real estate holding company |
100 | 100 | 100 | ||||||||||||
| Markfield America LLC |
USA | Virginia | Insurance brokerage company |
100 | 100 | 100 | ||||||||||||
| Titan Florida Holdings LLC |
USA | Delaware | Investment holding company |
100 | N/A | N/A | ||||||||||||
| Carolinas Cement Company LLC |
USA | Delaware | Investment holding company |
100 | 100 | 100 | ||||||||||||
| Norfapeake Terminal LLC |
USA | Virginia | Real estate holding company |
100 | 100 | 100 | ||||||||||||
F-13
Table of Contents
Titan America SA and Subsidiaries
Notes to Consolidated Financial Statements
December 31, 2023, 2022 and 2021
(All amounts in thousands)
| List of Legal Entities | Country of incorporation |
State of incorporation |
Nature of business | 2023 % of investment |
2022 % of investment |
2021 % of investment |
||||||||||||
| S&W Ready Mix LLC |
USA | South Carolina |
Ready-mix producer |
100 | 100 | 100 | ||||||||||||
| Titan Florida Concrete Products LLC |
USA | Delaware | Investment holding company |
100 | N/A | N/A | ||||||||||||
| Titan Florida Aggregates LLC |
USA | Delaware | Investment holding company |
100 | N/A | N/A | ||||||||||||
| Titan Florida Cement LLC |
USA | Delaware | Investment holding company |
100 | N/A | N/A | ||||||||||||
| Metro Redi-Mix LLC |
USA | Florida | Real estate holding company |
100 | 100 | 100 | ||||||||||||
| Miami Valley Ready-Mix Florida LLC |
USA | Delaware | Real estate holding company |
100 | 100 | 100 | ||||||||||||
| Summit Ready-Mix LLC |
USA | Florida | Real estate holding company |
100 | 100 | 100 | ||||||||||||
| Silver Sand Transportation LLC |
USA | Delaware | Transportation brokerage |
100 | 100 | N/A | ||||||||||||
| Standard Concrete LLC |
USA | Florida | Investment holding company |
100 | 100 | 100 | ||||||||||||
| Massey Sand and Rock Co. |
USA | California | Inactive | 100 | 100 | 100 | ||||||||||||
| Daleville Development LLC |
USA | Virginia | Real estate holding company |
100 | 100 | 100 | ||||||||||||
| Nestor Timber Development LLC |
USA | Virginia | Real estate holding company |
100 | 100 | 100 | ||||||||||||
| SEI LLC |
USA | North Carolina |
Real estate holding company |
100 | 100 | 100 | ||||||||||||
| Evergreen Wildlife Management LLC |
USA | Virginia | Inactive | N/A | 100 | 100 | ||||||||||||
(b) Associates
The Company has assessed the nature of an investment in which it does not exercise control over the investee and determined it to be an associate, as the Company does not control or jointly control the entity, but rather exerts significant influence. Associates are accounted for using the equity method.
| 1.3. | Foreign currency translation |
The consolidated financial statements are presented in thousands of U.S. Dollars, which is also the parent companys functional currency. Foreign currency transactions are translated using the exchange rates (i.e. spot rates) prevailing at the dates of the transactions or valuation where items are remeasured. Foreign exchange gains and losses resulting from the settlement of such transactions and from the translation at year-end exchange rates of monetary assets and liabilities denominated in foreign currencies are recognized as foreign exchange (loss)/gain, net in the Consolidated Statements of Income. Translation differences on non-monetary financial assets and liabilities are included in the Consolidated Statements of Income.
F-14
Table of Contents
Titan America SA and Subsidiaries
Notes to Consolidated Financial Statements
December 31, 2023, 2022 and 2021
(All amounts in thousands)
The financial statements of the Companys subsidiaries that have a functional currency different from the presentation currency are translated into the presentation currency as follows:
| | Assets and liabilities for each balance sheet are translated at the closing rate at the date of the balance sheet. |
| | Income and expenses for each income statement and statement of comprehensive income are translated at average exchange rates. |
| | All exchange differences resulting from the above are recognized in other comprehensive income. |
| 1.4. | Property, plant, equipment and mineral deposits |
Property, plant and equipment is stated at historical cost less accumulated depreciation and impairment losses, except for land (excluding quarries), which is shown at cost less impairment losses.
Cost includes expenditures directly attributable to the acquisition of the items and any environmental rehabilitation costs to the extent that they have been recognized as a provision (refer to Note 1.16). Subsequent costs are included in the assets carrying amount or recognized as a separate asset, as appropriate, only when it is probable that future economic benefits associated with the item will flow to the entity and the cost of the item can be measured reliably. The carrying amount of a replaced part is derecognized. All other repairs and maintenance are charged to the Consolidated Statements of Income as incurred. Subsequent component costs are depreciated over the remaining useful life of the related asset. Subsequent refurbishment costs that extend the assets useful life are depreciated over the newly determined life.
With the exception of quarries and refurbishments, depreciation is calculated using the straight-line method to allocate the cost of the assets to their residual values over their estimated useful lives, as follows:
| Cement | Aggregates | Other | ||||
| Land improvements |
15-30 | 15 | 15 | |||
| Building and improvements |
25 | 25 | 25 | |||
| Machinery and equipment |
15-30 | 10-15 | 5-15 | |||
| Mobile equipment |
7-25 | 7-15 | 7 | |||
| Marine equipment |
20 | 20 | n/a | |||
| Auto and truck |
8 | 8 | 8 | |||
| Furniture and fixtures |
3-5 | 3-5 | 3-5 |
Land on which quarries are located is depreciated on a depletion basis, which is recorded as the material extraction process advances based on the unit-of-production method based on secured reserves, defined as quantified and fully assessed reserves of raw materials in fully controlled land for which we have the mining rights and the necessary administrative permits for mining operations.
Major spare parts and stand-by equipment are classified as property, plant, equipment, and mineral deposits and are included in the machinery and equipment category.
The assets residual values and useful lives are reviewed, and adjusted if appropriate, at each reporting date. Where the carrying amount of an asset is greater than its estimated recoverable amount, it is written down immediately to its recoverable amount (refer to Note 1.7).
F-15
Table of Contents
Titan America SA and Subsidiaries
Notes to Consolidated Financial Statements
December 31, 2023, 2022 and 2021
(All amounts in thousands)
Items of Property, plant and equipment are derecognized upon disposal or when no future economic benefits are expected from their use or disposal. Gains and losses on disposals are determined by comparing proceeds with carrying amount. Impairment losses are measured as the difference between the carrying value and the recoverable amount which is the value-in-use. Both gains and losses on disposals and impairment losses are included in cost of goods sold or general and administrative expense, depending on their nature.
Interest costs on borrowings specifically used to finance the construction of Property, plant and equipment are capitalized during the construction period if the criteria for recognition are met. To the extent that funds are borrowed generally and used for the purpose of obtaining a qualifying asset, the amount of borrowing costs eligible for capitalization is determined by applying a capitalization rate to the expenditures on that asset. The capitalization rate is the weighted average of the borrowing costs applicable to the borrowings of the Company that are outstanding during the period, other than borrowings made specifically for the purpose of obtaining a qualifying asset (refer to Note 1.23).
| 1.5. | Intangible assets |
| (a) | Goodwill |
Goodwill arises on the acquisition of subsidiaries and represents the excess of the aggregate of the consideration transferred and the amount recognized for non-controlling interest over the net identifiable assets acquired and liabilities assumed. If the fair value of the net assets acquired is in excess of the aggregate consideration transferred, the gain is recognized in profit or loss.
Goodwill represents the future economic benefits arising from assets that are not capable of being individually identified and separately recognized in a business combination. Goodwill is not amortized. After initial recognition, it is measured at cost less any impairment losses.
For the purpose of impairment testing, goodwill acquired in a business combination is, from the acquisition date, allocated to each of the Companys cash-generating units (CGUs) that are expected to benefit from the combination, irrespective of whether other assets or liabilities of the acquiree are assigned to those units.
Each unit or group of units to which the goodwill is allocated represents the lowest level within the Company at which goodwill is monitored for internal management purposes. Goodwill is monitored at the CGU level.
Impairment testing is performed annually or more frequently if events or changes in circumstances indicate a potential impairment. The carrying value of goodwill is compared to the recoverable amount, which is the higher of the value-in-use and the fair value less costs to sell. Any impairment is recognized immediately as an expense and is not subsequently reversed.
| (b) | Software |
Costs associated with maintaining software programs are recognized as an expense as incurred. Development costs that are directly attributable to the design and testing of identifiable and unique software products controlled by the Company are recognized as intangible assets where the following criteria are met:
| | it is technically feasible to complete the software so that it will be available for use; |
F-16
Table of Contents
Titan America SA and Subsidiaries
Notes to Consolidated Financial Statements
December 31, 2023, 2022 and 2021
(All amounts in thousands)
| | management intends to complete the software and use it; |
| | there is an ability to use the software; |
| | it can be demonstrated how the software will generate probable future economic benefits; |
| | adequate technical, financial and other resources to complete the development and to use the software are available; and |
| | the expenditure attributable to the software during its development can be reliably measured. |
Directly attributable costs that are capitalized as part of the software include employee costs and an appropriate portion of relevant overheads. Capitalized development costs are recorded as intangible assets and amortized over its economic useful life from the point at which the asset is ready for use.
| (c) | Other intangible assets |
Intangible assets acquired separately are measured at cost upon initial recognition. The cost of intangible assets acquired in a business combination is their fair value at the date of acquisition. Following initial recognition, intangible assets are carried at cost less any accumulated amortization and accumulated impairment losses. Internally generated intangible assets, excluding capitalized development costs, are not capitalized and instead recognized in profit and loss in the period in which the expenditure is incurred.
The useful lives of intangible assets are assessed as either finite or indefinite.
Intangible assets with finite lives are amortized on a straight-line basis over their economic useful life and assessed for impairment whenever there is an indication that the intangible asset may be impaired. The amortization period and amortization method for an intangible asset with a finite useful life are reviewed at the end of each reporting period. Changes in the expected useful life or the expected pattern of realization of the future economic benefits are considered in modifying the amortization period or method, as appropriate, and are treated as changes in accounting estimates. Amortization expense on intangible assets with finite useful lives is recognized in the Consolidated Statements of Income in the expense category that best reflects the assets function.
Intangible assets with indefinite useful lives are not amortized. They are tested for impairment annually either individually or at the CGU level. The assessment of indefinite life is reviewed annually to determine whether it continues to be supportable. If not, a change in useful life from indefinite to finite is made on a prospective basis.
Gains or losses arising from derecognition of an intangible asset are measured as the difference between the net disposal proceeds and the carrying amount of the asset and are recognized in the Consolidated Statements of Income in the expense category that best reflects the assets nature.
The estimated useful lives for the major components of intangible assets are:
| Years | ||||
| Customer Relationships |
5-7 | |||
| Software |
7 | |||
| Tradenames |
Indefinite | |||
F-17
Table of Contents
Titan America SA and Subsidiaries
Notes to Consolidated Financial Statements
December 31, 2023, 2022 and 2021
(All amounts in thousands)
| 1.6. | Deferred stripping costs |
Stripping costs comprise the removal of overburden and other waste products at a quarry or mine. Stripping costs incurred in the development of a quarry or mine before production commences, and as new areas of mining are developed, are included in the carrying amount of the related quarry or mine, under property, plant, equipment and mineral deposits. These costs are subsequently depreciated on a units-of-production basis.
| 1.7. | Impairment of non-financial assets other than Goodwill |
Assets that are subject to amortization are reviewed for impairment whenever events or changes in circumstances indicate that the carrying amount may not be recoverable.
For the purpose of testing for impairment, assets are grouped at the lowest levels for which there are separately identifiable cash flows (CGU). Impairment losses recognized on non-financial assets other than goodwill are reviewed for possible reversal of the impairment at each reporting date. An assets recoverable amount is the higher of the assets or CGUs fair value less costs to sell and its value-in-use. Recoverable amount is determined for each asset individually, except for those that do not generate cash inflows that are largely independent of those from other assets or groups of assets. When the carrying amount of an asset or CGU exceeds its recoverable amount, the asset is impaired and is written down to its recoverable amount.
Intangible assets that have an indefinite useful life are not subject to amortization and are tested annually for impairment. Intangible assets that are subject to amortization are reviewed for impairment whenever events or changes in circumstances indicate that the carrying amount may not be recoverable. An impairment loss is recognized immediately as an expense for the amount by which the assets carrying amount exceeds its recoverable amount.
| 1.8. | Leases |
Leases are recognized as a right-of-use asset and a corresponding lease liability at the date of the commencement of the lease. The right-of-use asset is depreciated over the shorter of the assets useful life and the lease term on a straight-line basis.
The lease liability is initially measured at the present value of the lease payments that are not paid at the commencement date. It is discounted by using the interest rate implicit in the lease or, if that rate cannot be readily determined, the incremental borrowing rate (IBR). The IBR is the secured rate that the lessee would have to pay to borrow the funds necessary to obtain an asset of a similar value in a similar economic environment with similar terms and conditions.
The lease liability is subsequently increased by the interest cost on the lease liability and decreased by lease payments made. It is re-measured when there is a change in future lease payments arising from a change in an index or rate, a change in the estimate of the amount expected to be payable under a residual value guarantee, or as appropriate, changes in the assessment of whether a purchase or extension option is reasonably certain to be exercised or a termination option is reasonably certain not to be exercised.
Lease liabilities include the net present value of the following:
| | lease payments (including in-substance fixed payments); |
| | variable lease payments that are based on an index or a rate; |
F-18
Table of Contents
Titan America SA and Subsidiaries
Notes to Consolidated Financial Statements
December 31, 2023, 2022 and 2021
(All amounts in thousands)
| | amounts expected to be payable by the lessee under residual value guarantees; and |
| | the exercise price of a purchase option if the lessee is reasonably certain to exercise that option. |
The right-of-use asset is initially measured at cost, and subsequently, at cost less accumulated depreciation and impairment losses, adjusted for certain re-measurements of the lease liability.
Right-of-use assets are generally depreciated over the lease-term, except where there is a purchase option that is reasonably certain of being exercised. In that case, the right-of-use asset is depreciated over its estimated useful life in accordance with the estimates disclosed in Note 1.4.
The initial measurement of the right-of-use asset is comprised of:
| | the amount of the initial lease liability; |
| | any lease payments made at or before the commencement date; less any lease incentives received; |
| | any initial direct costs, and |
| | restoration or return costs. |
The Company leases various types of land, buildings, equipment and motor vehicles and has applied judgment to determine the lease term for contracts that include renewal options. The assessment of whether the Company is reasonably certain to exercise such options impacts the lease term, which could materially affect the amount of lease liabilities and right-of-use assets recognized. Lease terms are negotiated on an individual basis and contain different terms and conditions. Some leases have fixed price increases, while others have increases based on changes in price indices.
Machinery & equipment and motor vehicle contracts generally have fixed terms from 3-8 years, with some having fair value or fixed-price purchase options and/or renewal options. Renewal options on these types of contracts are generally for short durations. Land and building contracts generally have fixed terms from 5-10 years. These types of contracts can have multiple renewal options that extend over a material number of additional years.
Payments associated with short-term leases of equipment and vehicles and all leases of low-value assets are recognized on a straight-line basis as an expense in profit or loss. Short-term leases are leases with a lease term of 12 months or less without a purchase option. Low-value assets comprise IT equipment and small items of office furniture.
| 1.9. | Inventories |
Inventories are stated at the lower of cost and net realizable value. Cost is determined using a weighted average cost method. The cost of finished goods and work in process comprises direct materials, direct labor and an appropriate proportion of variable and fixed overhead expenditure, the latter being allocated on the basis of normal operating capacity.
Net realizable value is the estimated selling price in the ordinary course of business, less the costs of completion and direct selling expenses.
Spare parts classified as inventory are items awaiting use in the production process (repairs and maintenance) that are not otherwise as property, plant, equipment and mineral deposits (Note 1.4).
F-19
Table of Contents
Titan America SA and Subsidiaries
Notes to Consolidated Financial Statements
December 31, 2023, 2022 and 2021
(All amounts in thousands)
| 1.10. | Trade receivables |
Trade receivables are amounts due from customers for products sold or services performed in the ordinary course of business. The Company maintains two different portfolios of trade receivables:
| | Portfolio one consists of receivables in a hold to collect model. These receivables are non-interest bearing and are normally settled in accordance with the terms of the contracts. If collection is expected in one year or less, they are classified as current assets at amortized cost. If not, they are presented as non-current assets. They are initially recorded at fair value and subsequently measured at amortized cost using the effective interest method, less any provision for impairment. |
| | Portfolio two consists of receivables in a hold to sell model as further described in Note 2.2(b) and 7. Receivables in this portfolio are measured at fair value through profit or loss. |
| 1.11. | Cash and cash equivalents |
Cash and cash equivalents comprise cash on hand, demand deposits held by banks and other short-term highly liquid investments with original maturities of three months or less.
Cash equivalents also include deposits in transit from credit card companies that have been authorized by the respective credit card company and submitted for processing by the Company. Such amounts are held for the purpose of meeting short-term cash requirements, rather than for investment or other purposes, and are readily convertible to a known amount of cash.
| 1.12. | Borrowings |
Borrowings are initially recorded at fair value net of transaction costs incurred. In subsequent periods, borrowings are carried at amortized cost in accordance with the effective interest method. Any difference between the proceeds (net of transaction costs) and redemption value is recognized in the Consolidated Statements of Income over the period of the borrowings using the effective interest method.
Borrowings are classified as current liabilities unless the Company has an unconditional right to defer settlement for at least 12 months after the balance sheet date.
| 1.13. | Current and deferred income taxes |
Titan America is subject to income taxes in Belgium. Titan Atlantic is subject to income taxes in the United States and in Greece. Additionally, ST Equipment & Technology Trading Company LLC (Trading Co), a subsidiary of Titan America, has elected to be treated as a corporation for income tax purposes. As such, Trading Co will file a separate tax return; however, its activity is included in Titan Americas results.
The tax expense for the period is comprised of current and deferred tax. Tax is recognized in the Consolidated Statements of Income, except to the extent that it relates to items recognized in other comprehensive income or directly in equity. In this case, the tax is also recognized in other comprehensive income or directly in equity, respectively.
Current income tax is calculated based on the tax laws enacted or substantively enacted at the reporting date. Management periodically evaluates positions taken in tax returns where the tax regulations are subject to interpretation and establishes provisions when appropriate based on the amounts expected to be paid to the tax authorities.
F-20
Table of Contents
Titan America SA and Subsidiaries
Notes to Consolidated Financial Statements
December 31, 2023, 2022 and 2021
(All amounts in thousands)
Deferred income tax is recognized using the liability method on temporary differences arising between the tax bases of assets and liabilities and their carrying amounts in the financial statements. However, if the deferred income tax arises from initial recognition of an asset or liability in a transaction other than a business combination that at the time of the transaction affects neither accounting nor taxable profit and loss and does not give rise to equal taxable and deductible temporary differences, it is not accounted for.
Deferred tax assets are recognized for all deductible temporary differences, the carry forward of unused tax credits and any unused tax losses. Deferred tax assets are recognized to the extent that it is probable that taxable profit will be available against which the deductible temporary differences and the carry forward of unused tax credits and unused tax losses can be utilized.
Deferred income tax is determined using tax rates (and laws) that have been enacted or substantively enacted at the reporting date and are expected to apply when the related deferred income tax asset is realized or the related deferred income tax liability is settled.
| 1.14. | Employee benefits |
| (a) | Pension and other retirement obligations |
The Company sponsors both defined benefit and defined contribution pension plans. A defined contribution plan is a pension plan under which the Company pays fixed contributions into a separate entity. The Company has no legal or constructive obligation to make additional contributions if the fund does not hold sufficient assets to pay all employee benefits related to the current and prior years. A defined benefit plan is a pension plan that is not a defined contribution plan.
Typically, defined benefit plans set the amount of pension benefits employees will receive upon retirement, usually dependent on one or more factors such as age, years of service and compensation.
The liability recognized in the Statements of Financial Position related to the defined benefit and other post-retirement benefit plan represents the present value of the defined benefit obligation at the reporting date less the fair value of plan assets.
The defined benefit obligation is calculated annually by independent actuaries using the projected unit credit method. The present value of the defined benefit obligation is determined by discounting the estimated future cash outflows using interest rates of high-quality corporate bonds, which have terms to maturity similar to the terms of the related pension obligation.
Past service costs are recognized in profit or loss on the earlier of:
| | the date of the plan amendment or curtailment, or |
| | the date the Company recognizes restructuring related costs. |
Net interest is calculated by applying the discount rate to the net defined benefit liability or asset. The Company recognizes the following changes in the net defined benefit obligation:
| | service costs, comprising current service cost, past-service cost, gains and losses on curtailments and non-routine settlements under cost of goods sold, and |
| | net interest expense or income under finance cost. |
Remeasurements related to actuarial gains and losses and the return on plan assets (excluding net interest), are recognized immediately in the Statements of Financial Position with a corresponding charge or credit to members equity through Other Comprehensive Income. Remeasurements are not reclassified to profit or loss in subsequent periods.
F-21
Table of Contents
Titan America SA and Subsidiaries
Notes to Consolidated Financial Statements
December 31, 2023, 2022 and 2021
(All amounts in thousands)
For defined contribution plans, the Company pays contributions to privately administered plans on a mandatory, contractual or voluntary basis. Once the contributions have been paid, the Company has no further payment obligations. The regular contributions constitute net periodic costs for the year in which they are due and are included in payroll and related expenses in the Consolidated Statements of Income as incurred.
| (b) | Termination benefits |
Termination benefits are payable when an employee is terminated by the Company prior to the normal retirement date, or when an employee accepts voluntary separation from the Company in exchange for these benefits. The Company recognizes termination benefits at the earlier of: a) the date the Company can no longer withdraw the offer of those benefits; and b) when the Company recognizes costs for a restructuring that is within the scope of IAS 37 that involves the payment of termination benefits. In the case of an offer made to encourage voluntary separation, the termination benefits are measured based on the number of employees expected to accept the offer. Benefits falling due more than one year after the end of a reporting period are discounted to present value.
| (c) | Bonus plan |
A liability for employee benefits in the form of a bonus plan is recognized in accrued expenses when the following conditions are met:
| | there is a formal plan and the amounts to be paid are determined prior to issuance of the financial statements; or |
| | past practice has created a valid expectation by employees that they will receive a bonus payment and the amount can be determined prior to issuance of the financial statements. |
| (d) | Share-based compensation |
Restricted stock incentive plans
TCI operates an equity-settled share-based compensation plan. The Company recognizes the fair value of the employee service received in exchange for the grant of TCI stock options as an expense.
Prior to 2020, share options were granted to certain members of senior management and other employees of the Company at a discount to the market price of the shares on the respective dates of the grants and are exercisable at those prices. The options must be exercised within the year vested or within the first two months of the year following the vesting date. The plan has a contractual option term of three years.
The fair value of the employee services received in exchange for the grant of the options is recognized as an expense during the vesting period, which is the period over which all of the specific vesting conditions are to be satisfied. The total amount to be expensed over the vesting period is determined by reference to the fair value of the options granted specified by the date of grant and:
| | include any market performance conditions (for example, the entitys share price); |
| | exclude the impact of any service and non-market performance vesting conditions (for example, profitability, sales growth targets and remaining an employee of the Company over a specified time period); and |
F-22
Table of Contents
Titan America SA and Subsidiaries
Notes to Consolidated Financial Statements
December 31, 2023, 2022 and 2021
(All amounts in thousands)
| | include the impact of any non-vesting conditions. |
At the end of each reporting period, the Company revises its estimates of the number of options that are expected to vest (which are limited to non-market vesting conditions) and recognizes the impact of the revision to the original estimates, if any, in the Consolidated Statements of Income under general and administrative expense, with a corresponding adjustment to equity.
Long-term incentive plan (LTIP)
In May 2020, TCI adopted a new long-term share-based incentive plan. Participants in the plan are awarded a conditional grant of TCI shadow shares at no consideration in April (or later) of each year. The awards have no dividend or voting rights.
The number of shadow shares granted to each participant is determined by the award amount (expressed in US Dollars or Euros) and the value of the shadow share. The value of the shadow share is equal to the average TCI share closing price on Euronext Brussels during the last seven trading days of March of the grant year.
The vesting period of the awards is as follows:
| | 50% at the completion of a three-year period, and |
| | 50% at the completion of a four-year period. |
The awards vest at the designated dates, provided that the participants are still working for the Company or any other subsidiary or affiliate of TCI.
At vesting, participants receive their vested awards in TCI shares, in cash, or (if timely elected) in contributions to a deferred compensation plan.
The Company receives services from its employees, but TCI has the obligation to settle the awards. As a result, the Company accounts for the plan as an equity-settled transaction by recognizing the fair value of the services it receives from the participants in the Consolidated Statements of Income under general and administrative expense, with a corresponding adjustment to equity during the vesting period.
| 1.15. | Provisions |
Provisions represent liabilities of uncertain timing or amount and are recognized when the Company has a present legal or constructive obligation as a result of past events, it is probable that an outflow of resources will be required to settle the obligation and a reliable estimate of the amount can be made. Where the Company expects a provision to be reimbursed, for example under an insurance contract, the reimbursement is recognized as a separate asset but only when reimbursement is virtually certain. Expenses related to provisions are presented in the Consolidated Statements of Income net of any reimbursement.
Provisions are not recognized for future operating losses. The Company recognizes a provision for onerous contracts when the economic benefits to be derived from a contract are less than the unavoidable costs of meeting the obligations under the contract.
F-23
Table of Contents
Titan America SA and Subsidiaries
Notes to Consolidated Financial Statements
December 31, 2023, 2022 and 2021
(All amounts in thousands)
Where the effect of the time value of money is material, provisions are measured at the present value of the amount expected to be required to settle the obligation using a pre-tax discount rate that reflects current market assessments of the time value of money and the risks specific to the obligation. The increase in the provision due the passage of time is recognized as a finance cost.
1.16. Provisions for restoration obligations, environmental and equipment removal
The Company is required to restore the land used for quarries and processing sites at the end of their productive lives to a condition acceptable for the relevant authorities and consistent with the Companys environmental policies. Provisions for restoration obligations, environmental and equipment removal are recognized when the Company has a present legal or constructive obligation as a result of past events, it is probable that an outflow of resources will be required to settle the obligation and the amount can be reliably estimated.
Estimated costs associated with such rehabilitation activities represent managements best estimate of expenditures required to settle the present obligation at the balance sheet date and are measured at the present value of future cash outflows expected to be incurred. Such cost estimates, initially expressed at current price levels, are adjusted for inflation (between 2.34% and 2.89% at December 31, 2023, between 2.35% and 3.00% at December 31, 2022, and between 1.66% and 2.10% at December 31, 2021) to reflect expected annual cost increases between the date of the estimate and the forecasted payment date. The estimates are then discounted to present value at a rate consistent with the duration of the liability. Where a closure and restoration obligation arises from quarry/mine development activities or relates to the decommissioning of Property, plant and equipment, the provision can be capitalized as part of the cost of the associated asset (intangible or tangible). The capitalized cost is depreciated over the useful life of the asset and any change in the net present value of the expected liability is included in finance cost, unless it arises from changes in valuation assumptions. Each year, the provisions are increased to reflect accretion of the discount, with these charges recorded as a component of finance cost.
Provisions associated with environmental damage represent the estimated future cost of remediation. Estimating the future costs of these obligations is complex and requires the Company to use judgment. The estimation of these costs is based on an evaluation of currently available facts with respect to each individual site and considers factors such as existing technology, currently enacted laws and regulations and prior experience in site remediation.
1.17. Revenue recognition
Revenue is the amount of consideration expected to be received in exchange for transferring promised goods or services to a customer, excluding amounts collected on behalf of third parties (sales taxes, etc.). Variable consideration is included in the transaction price and estimated using either the expected value method, or the most likely amount method.
Revenue is recognized when (or as) a performance obligation is satisfied by transferring the control of a promised good or service to the customer. A customer obtains control of a good or service if it has the ability to direct the use of and obtain substantially all of the remaining benefits from that good or service. Control is transferred over time or at a point in time. Revenue from the sale of goods is recognized when control of the goods is transferred to the customer, usually upon delivery, and there is no unfulfilled obligation that could affect the customers acceptance of the products.
F-24
Table of Contents
Titan America SA and Subsidiaries
Notes to Consolidated Financial Statements
December 31, 2023, 2022 and 2021
(All amounts in thousands)
1.18. Financial assets
The Company initially measures a financial asset at fair value plus, in the case of a financial asset not at fair value through profit or loss, transaction costs. Transaction costs associated with financial assets carried at fair value through profit or loss are expensed. Trade receivables are initially measured at their transaction price.
The Companys financial assets comprise trade and other receivables and derivative credit support payments, carried at amortized cost, and derivative financial instruments classified as at fair value through profit or loss.
1.19. Impairment of financial assets
The Company records an allowance for expected credit losses (ECLs) for all financial assets not held at fair value through profit and loss (FVPL).
ECLs are based on the difference between the contractual cash flows due in accordance with the contract and all the cash flows that the Company expects to receive. The shortfall is then discounted at an approximation to the assets original effective interest rate. For trade and other receivables, the Company has applied the standards simplified approach and has calculated ECLs based on lifetime expected credit losses.
| 1.20. | Derivative financial instruments |
Derivative financial instruments are recognized at fair value upon both initial recognition and subsequently. Derivatives are presented as financial assets when the fair value is positive and as financial liabilities when the fair value is negative. Any gains or losses arising from changes in the fair value of derivatives are recorded directly in the Consolidated Statements of Income, except for the effective portion of cash flow hedges, which is recognized in other comprehensive income (OCI) and subsequently reclassified to profit or loss when the hedged item affects profit or loss.
The Company has entered into a cash flow hedge for a portion of its natural gas price risk exposure. The cash flow hedge accounting model applies when hedging exposure to variability in cash flows attributable to a specific risk associated with a recognized asset or liability, an unrecognized firm commitment (currency risk only) or a highly probable forecasted transaction, that could impact profit or loss. Further details about the hedge are provided in Note 25.
| 1.21. | Derecognition of financial assets and liabilities |
| (a) | Financial assets |
A financial asset (or a part of a financial asset or part of a group of similar financial assets) is derecognized when:
| | the rights to receive cash flows from the asset have expired; |
| | the Company retains the right to receive cash flows from the asset but has assumed an obligation to transfer such cash flows without material delay to a third party under a pass-through arrangement; or |
F-25
Table of Contents
Titan America SA and Subsidiaries
Notes to Consolidated Financial Statements
December 31, 2023, 2022 and 2021
(All amounts in thousands)
| | the Company has transferred its rights to receive cash flows from the asset and either (a) has transferred substantially all the risks and rewards of the assets, or (b) has neither transferred nor retained substantially all the risks and rewards of the asset but has transferred control of the asset. |
Where the Company has transferred its rights to receive cash flows from an asset and has neither transferred nor retained substantially all of the risks and rewards of the asset, nor transferred control of the asset, the asset is recognized to the extent of the Companys continuing involvement in the asset. A corresponding liability is also recognized.
Continuing involvement that takes the form of a guarantee over the transferred asset is measured at the lower of the original carrying amount of the asset and the maximum amount of consideration that the Company could be required to repay.
| (b) | Financial liabilities |
A financial liability is derecognized when the obligation under the liability is discharged, cancelled or expires. Where an existing financial liability is replaced by another from the same lender on substantially different terms, or the terms of an existing liability are substantially modified, such an exchange or modification is treated as a derecognition of the original liability and the recognition of a new liability. The difference in the respective carrying amounts is recognized in the Consolidated Statements of Income.
| 1.22. | Fair value measurement |
The Company uses the following valuation hierarchy for determining and disclosing the fair value of its financial assets and liabilities:
| | Level 1: based on quoted (unadjusted) prices in active markets for identical assets and liabilities. |
| | Level 2: based on valuation techniques whereby all inputs having a material effect on the fair value are observable, either directly or indirectly, and include quoted prices for identical or similar assets and liabilities in markets that are not actively traded. |
| | Level 3: based on valuation techniques whereby all inputs having a material effect on the fair value are not derived from observable market data. |
On December 31, 2023 and 2022, the Company held derivative financial instruments that were recorded at fair value in the Consolidated Statements of Financial Position (Level 2). The Company also had long and short-term borrowings that were recorded at amortized cost. The fair value of these borrowings (Level 3) is disclosed in Note 18.
1.23. Borrowing costs
Borrowing costs directly attributable to the acquisition, construction or production of a qualifying asset (an asset that takes a substantial period of time (greater than one year) to get ready for its intended use or sale) are capitalized as part of the cost of the respective asset. All other borrowing costs are expensed in the Consolidated Statements of Income in the period in which they are incurred. Borrowing costs consist of finance and other costs that an entity incurs in connection with the borrowing of funds. Capitalized interest is presented in investing activities in the Consolidated Statements of Cash Flows.
F-26
Table of Contents
Titan America SA and Subsidiaries
Notes to Consolidated Financial Statements
December 31, 2023, 2022 and 2021
(All amounts in thousands)
1.24. Trade payables
Trade payables are obligations to pay for goods or services that have been acquired in the ordinary course of business from suppliers. Accounts payable are classified as current liabilities if payment is due within one year or less. If not, they are presented as non-current liabilities.
Trade payables are initially recorded at fair value and subsequently measured at amortized cost using the effective interest method.
2. Significant accounting estimates and critical judgments
The preparation of the financial statements requires management to make estimates and judgments that affect the reported amounts and disclosures. Estimates and judgments are continuously evaluated and are based on historical experience and other factors, including expectations about future events believed to be reasonable under the circumstances.
Such estimates and assumptions form the basis in making judgments to determine the carrying value of assets and liabilities not readily available from other sources. The resulting accounting estimates will, by definition, seldom equal the actual results. The estimates and assumptions that have higher degree of judgment or complexity, and of items which are more likely to be materially adjusted within the next financial year are discussed below.
2.1. Significant accounting estimates and changes in estimates:
(a) Depreciation
Property, plant and equipment are depreciated over their estimated useful lives. The actual lives of the assets are assessed annually and may vary depending on a number of factors. In reassessing asset lives, factors such as technological innovation, product lifecycles, life-of-mine and maintenance programs are considered. A one-year increase in the assumed asset lives would increase income before income taxes by $6,040 for the year ended December 31, 2023. A one-year decrease in the assumed asset lives would decrease income before income taxes by $8,542 for the year ended December 31, 2023.
(b) Goodwill
Impairment tests of goodwill use the recoverable amounts of CGU that are determined based on value-in-use calculations in Note 13.
(c) Valuation of financial instruments
The valuation of derivative financial instruments is based on the market position provided by the counterparty financial institutions at the reporting date. Further information on financial instruments is provided in Note 9.
F-27
Table of Contents
Titan America SA and Subsidiaries
Notes to Consolidated Financial Statements
December 31, 2023, 2022 and 2021
(All amounts in thousands)
(d) Provisions for restoration obligations, environmental and equipment removal
Estimating provisions for restoration obligations, environmental and equipment removal involves inherent uncertainty due to unknown conditions, changing governmental regulations and legal standards regarding the liabilities, the length of the clean-up periods and evolving technologies. The restoration, environmental and equipment removal provisions reflect the information available to management at the time of determination of the liability and are adjusted periodically as remediation efforts progress or as additional technical or legal information becomes available.
The calculation of provisions for restoration obligations, environmental and equipment removal is most sensitive to the following assumptions:
| | Current estimated costs; |
| | Inflation rates; and |
| | Discount rates. |
See Note 21 for further information about provisions for restoration obligations, environmental and equipment removal.
| 2.2. | Critical judgments: |
(a) Interest in unconsolidated entities
The Company has an agreement with a Special Purpose Entity (SPE) under which trade accounts receivable, originated by certain of the Companys operating subsidiaries, are aggregated and sold to the SPE (which was established to house and manage the trade accounts receivable) in exchange for cash and interest-bearing notes receivable.
Management determined the most relevant activity of the SPE to be the management of impaired trade accounts receivable within the overall portfolio of trade accounts receivable owned by the SPE, as this activity has the greatest impact on credit losses incurred, and hence, the variability of the SPEs returns. The entities most exposed to variable returns are (i) the Company which holds the most subordinated interest in the SPE, as well as the third most subordinated interest, and (ii) an unrelated party (the Control Party) which holds the second most subordinated interest and retains the right to manage the impaired accounts receivable and substantive rights to replace the Company as servicer of the SPE. As a result, the Company does not consolidate the SPE.
(b) Derecognition of trade accounts receivable transferred to the SPE
As noted in Note 2.2(a) the Company does not consolidate the SPE, but rather sells it qualifying trade accounts receivable originated by certain of the Companys operating subsidiaries in exchange for cash and interest-bearing notes receivable. As a result of the arrangement, the Company transfers its rights to receive the cash flows from the trade accounts receivable sold to the SPE. Credit losses within the SPE are shared among the lenders to the SPE based on the seniority of their loans to the SPE. Based on the current level of bad debts in the entity and an associated analysis of the risks and rewards of receivables transferred to the SPE, the Company has concluded that it is appropriate to derecognize the receivables at the time of sale.
F-28
Table of Contents
Titan America SA and Subsidiaries
Notes to Consolidated Financial Statements
December 31, 2023, 2022 and 2021
(All amounts in thousands)
At December 31, 2023, expected credit losses within the SPE total $858, and, if realized, would be allocated first to the Companys junior subordinated note (which is fully reserved for in the accompanying financial statements) and the Control Partys intermediate subordinated note.
Additional details about the SPE can be found in Note 7.
(c) Determination of lease terms under IFRS 16
Extension options are included in a number of property and equipment leases across the Company. A limited number of leases contain termination options, and these are generally only exercisable by the Company. In determining the lease term, the Company considers all facts and circumstances that create an economic incentive to exercise an extension option. Extension options are only included in the lease term if the lease is reasonably certain to be extended.
In determining the lease term, the Company considers the contractual terms, termination costs and strategic importance of the assets to the operations (in addition to the significance of investments undertaken or planned in connection with leased properties). The reasonably certain assessment is only revised if a material event or a material change in circumstance occurs that is within the control of the Company.
As of December 31, 2023, potential future cash flows of $43,678 (undiscounted) were not included in the lease liability due to it not being reasonably certain that the lease terms would be extended.
3. Revenue
Substantially all of the Companys revenue is derived from sales of cement, fly ash, aggregates, ready-mix concrete and concrete blocks. Sales transactions result from customer requests (an Order) received in response to Company quotes or negotiated purchase orders. An Order specifies products, contractual terms and conditions, estimated quantities, and pre-determined prices over established time periods. Once an Order is in place, the customer requests the delivery of specific products and volumes under the general terms and conditions contained therein.
Products remain the property of the Company until received by the customer, and the Company provides a warranty that the materials comply with the specifications contained in the Order. The contracts can generally be cancelled with or without cause at any time, with each party having responsibility for any rights and obligations accrued up to the time of termination. Each request by a customer under an Order produces a sales contract for the goods specified in such request. The Order does not create enforceable rights or obligations on their own (an additional purchasing decision is required on the part of the customer). The warranties provided are assurance-type warranties and do not create separate performance obligations.
Control over the goods subject to each sales contract transfers at a point in time. For standard products, customer acceptance is generally considered a formality, and control transfers (and revenue is recognized) upon shipment or delivery.
Promised goods may be subject to bill-and-hold arrangements; however, this is very rare. Given the nature of the products (not separately identifiable and ability of the business to direct the inventory to another customer), customers do not obtain control under bill-and-hold arrangements prior to shipment, and since the businesses do not bill customers prior to shipment, these arrangements do not impact revenue recognition.
F-29
Table of Contents
Titan America SA and Subsidiaries
Notes to Consolidated Financial Statements
December 31, 2023, 2022 and 2021
(All amounts in thousands)
3. Revenue (continued)
The transaction price for each sales contract is determined by reference to the quantity requested and price established in the Order. Some of the contracts offer discounts for prompt payment. In these cases, revenue is recorded in the amount the business expects to be entitled to.
Some agreements may involve the payment of sales incentives. When paid in connection with the acquisition of an Order, which does not create a performance obligation at inception, commissions are expensed as incurred. In all cases, the amounts are immaterial and pertain to short-term sales contracts. Additional contract fulfillment costs may include insurance, on-site labor, shipping costs and the removal or replacement of materials under warranty. Given the short-term nature of the sales contracts, the Company does not capitalize such amounts. However, estimated removal or replacement costs of materials under warranty are included in the obligation for accrued warranty costs.
The components of revenue for the years ended December 31, 2023, 2022, and 2021 are as follows:
| 2023 | 2022 | 2021 | ||||||||||
| Cement |
$ | 657,332 | $ | 560,320 | $ | 433,067 | ||||||
| Aggregates |
83,438 | 79,147 | 73,595 | |||||||||
| Ready-mix concrete |
688,236 | 589,553 | 530,878 | |||||||||
| Concrete block and related products |
140,128 | 116,929 | 96,554 | |||||||||
| Fly ash |
19,833 | 15,687 | 14,831 | |||||||||
| Equipment and related services |
1,986 | 2,253 | 2,820 | |||||||||
| Other goods and services |
648 | 257 | 672 | |||||||||
|
|
|
|
|
|
|
|||||||
| Revenue |
$ | 1,591,601 | $ | 1,364,146 | $ | 1,152,417 | ||||||
|
|
|
|
|
|
|
|||||||
4. Cost of goods sold
The components of cost of goods sold for the years ended December 31, 2023, 2022 and 2021 are as follows:
| 2023 | 2022 | 2021 | ||||||||||
| Material and other inventory costs |
$ | 569,794 | $ | 516,377 | $ | 385,481 | ||||||
| Inventory change |
(9,278 | ) | (10,990 | ) | 547 | |||||||
| Payroll and employee related expenses |
257,919 | 227,897 | 211,814 | |||||||||
| Energy and Fuel Costs |
104,619 | 122,012 | 80,627 | |||||||||
| Depreciation, depletion, and amortization |
79,360 | 78,571 | 72,241 | |||||||||
| Freight expense |
55,313 | 59,529 | 54,973 | |||||||||
| Distribution expense |
71,343 | 64,350 | 54,964 | |||||||||
| Repairs and maintenance |
40,133 | 33,450 | 46,909 | |||||||||
| Utilities |
3,436 | 3,000 | 2,512 | |||||||||
| Taxes, other than income taxes |
15,934 | 13,527 | 13,464 | |||||||||
| Short-term lease rentals |
22,325 | 13,587 | 11,587 | |||||||||
| Risk insurance, including loss retention |
12,201 | 13,167 | 9,673 | |||||||||
| Travel, training, and other employee expense |
2,877 | 2,821 | 1,633 | |||||||||
| Other |
2,136 | 5,582 | 9,836 | |||||||||
|
|
|
|
|
|
|
|||||||
| Total cost of goods sold |
$ | 1,228,112 | $ | 1,142,880 | $ | 956,261 | ||||||
|
|
|
|
|
|
|
|||||||
F-30
Table of Contents
Titan America SA and Subsidiaries
Notes to Consolidated Financial Statements
December 31, 2023, 2022 and 2021
(All amounts in thousands)
5. Selling expense
The components of selling expense for the years ended December 31, 2023, 2022 and 2021 are as follows:
| 2023 | 2022 | 2021 | ||||||||||
| Payroll and employee related expenses |
$ | 17,197 | $ | 17,321 | $ | 15,184 | ||||||
| Overhead (dues, professional fees, credit card fees, etc.) |
11,718 | 10,469 | 7,986 | |||||||||
| Travel, entertainment, and other employee expense |
1,696 | 1,417 | 1,169 | |||||||||
| Other selling expenses |
398 | 731 | 385 | |||||||||
|
|
|
|
|
|
|
|||||||
| Total selling expense |
$31,009 | $ | 29,938 | $ | 24,724 | |||||||
|
|
|
|
|
|
|
|||||||
6. General and administrative expense
The components of general and administrative expense for the years ended December 31, 2023, 2022 and 2021, are as follows:
| 2023 | 2022 | 2021 | ||||||||||
| Payroll and employee related expense |
$ | 54,399 | $ | 50,045 | $ | 45,347 | ||||||
| Depreciation and amortization |
8,138 | 6,245 | 6,917 | |||||||||
| Management fees |
11,405 | 9,868 | 6,865 | |||||||||
| Service contracts |
5,030 | 4,311 | 5,202 | |||||||||
| Office costs |
5,565 | 5,029 | 5,116 | |||||||||
| Bank fees |
527 | 650 | 270 | |||||||||
| Professional fees |
9,616 | 6,535 | 2,695 | |||||||||
| Travel, entertainment and auto expense |
2,802 | 2,168 | 1,123 | |||||||||
| Other |
2,427 | 2,662 | 2,757 | |||||||||
|
|
|
|
|
|
|
|||||||
| Total general and administrative expense |
$99,909 | $ | 87,513 | $ | 76,292 | |||||||
|
|
|
|
|
|
|
|||||||
7. Fair value loss on accounts receivable
As discussed in note 2.2(b), in 2014, the Company entered into an accounts receivable (AR) sale agreement with an unrelated third party (the Special Purpose Entity or SPE) whereby trade accounts receivable, originated by certain of the Companys operating subsidiaries (the Originators), are aggregated, sold to the Company, and on-sold by the Company to the SPE in exchange for cash and interest-bearing notes receivable. Under the terms of the agreement, the sale of accounts receivable is made on a continuing, fair value, non-recourse basis (as to collectability) at a discount representing the time value of money and risk of collectability, among other factors. The SPE does, however, have recourse against the Company for any: 1) voluntary adjustments (e.g., quality allowances, etc.) of customer obligations by the Company or the Originators; 2) corrections of product quantity, pricing (including nominal short-pay auto tolerances), or other billing errors made by the Company or the Originators subsequent to the date of invoice; and 3) customer offsets against receivables sold to the SPE (e.g., back charges and volume rebates).
By agreement among the parties, the Company acts as Servicer of the accounts receivable sold to the SPE. As Servicer, the Company provides credit administration, billing, collections, cash application and data reporting services. The SPE pays a servicing fee to the Company. However, as discussed in note 2.2 (a), an unrelated party retains the right to manage the impaired accounts receivable of the SPE and can replace the Company as servicer of such receivables at its sole discretion.
F-31
Table of Contents
Titan America SA and Subsidiaries
Notes to Consolidated Financial Statements
December 31, 2023, 2022 and 2021
(All amounts in thousands)
7. Fair value loss on accounts receivable (continued)
Net of interest earned on the note receivable and servicing and other fees paid to the Company, the Company recognized a fair value loss on sale of receivables of $6,113, $3,041 and $1,101 in 2023, 2022 and 2021, respectively. The Company may incur losses on its notes and miscellaneous receivables due from the SPE if the amount of credit losses on the underlying receivables sold to the SPE exceeds the value of the control partys note due from the SPE by the amount of $1,565 as of December 31, 2023 ($808 as of December 31, 2022). The notes and miscellaneous receivables, net due from the SPE at December 31, 2023 and 2022 are $59,346, and $51,560, respectively (see Note 17), representing the Companys maximum exposure to loss from its interest in the SPE. During 2023, the Company sold $1,181,511 of trade accounts receivable to the SPE ($987,208 in 2022 and $867,692 in 2021).
8. Finance cost
The components of finance cost for the years ended December 31, 2023, 2022 and 2021, are as follows:
| 2023 | 2022 | 2021 | ||||||||||
| Interest expense on borrowings, including leases |
$ | 23,545 | $ | 21,818 | $ | 21,847 | ||||||
| Line of credit commitment fees |
694 | 710 | 922 | |||||||||
| Net interest costs on pension and OPEB benefits |
64 | 39 | 69 | |||||||||
| Accretion expense on provisions |
1,813 | 976 | 324 | |||||||||
| Cost/(benefit) from interest rate swap |
186 | (3,461 | ) | | ||||||||
| Capitalized interest |
(2,826 | ) | (466 | ) | (833 | ) | ||||||
| Finance Income |
(950 | ) | (436 | ) | (471 | ) | ||||||
| Other |
(282 | ) | (102 | ) | (2 | ) | ||||||
|
|
|
|
|
|
|
|||||||
| Total finance cost, net |
$22,244 | $ | 19,078 | $ | 21,856 | |||||||
|
|
|
|
|
|
|
|||||||
9. Foreign exchange and derivative financial instruments
Foreign exchange gains/(losses) are comprised of gains and losses associated with the remeasurement and settlement of foreign currency denominated financial assets and liabilities. For the year ended December 31, 2023, the Company recorded a net foreign exchange loss of $11,981:
| 120,000 Fixed Rate Loan |
75,000 Fixed Rate Loan |
45,000 Fixed Rate Loan |
32,800 Fixed Rate Loan |
Euro Revolving Credit Facility (RCF) |
Other | Total | ||||||||||||||||||||||
| Foreign exchange gains/(losses) arising from: |
||||||||||||||||||||||||||||
| Remeasurement and settlement of Euro denominated loan obligations (principal) |
$ | (4,608 | ) | $ | (2,880 | ) | $ | (1,728 | ) | $ | (1,260 | ) | $ | (1,528 | ) | $ | | $ | (12,004 | ) | ||||||||
| Remeasurement and settlement of Euro denominated loan obligations (finance cost) |
(35 | ) | (22 | ) | (7 | ) | (11 | ) | (8 | ) | | (83 | ) | |||||||||||||||
| Other |
| | | | | 106 | 106 | |||||||||||||||||||||
|
|
|
|
|
|
|
|
|
|
|
|
|
|
|
|||||||||||||||
| Total foreign exchange gains/(losses) in 2023 |
$ | (4,643 | ) | $ | (2,902 | ) | $ | (1,735 | ) | $ | (1,271 | ) | $ | (1,536 | ) | $ | 106 | $ | (11,981 | ) | ||||||||
|
|
|
|
|
|
|
|
|
|
|
|
|
|
|
|||||||||||||||
F-32
Table of Contents
Titan America SA and Subsidiaries
Notes to Consolidated Financial Statements
December 31, 2023, 2022 and 2021
(All amounts in thousands)
9. Foreign exchange and derivative financial instruments (continued)
The Company entered into derivative financial instruments to manage certain of its foreign currency and interest rate exposures. For the year ended December 31, 2023, the Company recorded a net gain on derivative financial instruments of $10,967, resulting in an overall net foreign exchange and financial instrument loss of $1,014. The following table demonstrates the types of derivative financial instruments entered into with respect to the above instruments and the composition of the net gain recognized in 2023:
| 150,000 Cross Currency Interest Rate Swaps |
50,800 Foreign Exchange Forwards |
42,000 Foreign Exchange Forwards |
30,000 Foreign Exchange Forwards |
Euro Revolving Credit Facility (RCF) Forwards |
Other Foreign Exchange Forwards |
Total | ||||||||||||||||||||||
| Derivative financial instrument gains in 2023 |
$ | 7,684 | $ | 787 | $ | 645 | $ | 448 | $ | 1,402 | $ | 1 | $ | 10,967 | ||||||||||||||
|
|
|
|
|
|
|
|
|
|
|
|
|
|
|
|||||||||||||||
For the year ended December 31, 2022, the Company recorded a net foreign exchange gain of $19,990:
| 120,000 Fixed Rate Loan |
75,000 Fixed Rate Loan |
45,000 Fixed Rate Loan |
32,800 Fixed Rate Loan |
Euro Revolving Credit Facility (RCF) |
Other | Total | ||||||||||||||||||||||
| Foreign exchange gains/(losses) arising from: |
||||||||||||||||||||||||||||
| Remeasurement and settlement of Euro denominated loan obligations (principal) |
$ | 9,315 | $ | 4,950 | $ | 2,970 | $ | 2,165 | $ | 92 | $ | | $ | 19,492 | ||||||||||||||
| Remeasurement and settlement of Euro denominated loan obligations (finance cost) |
(80 | ) | 49 | 57 | 27 | 1 | | 54 | ||||||||||||||||||||
| Other |
| | | | | 444 | 444 | |||||||||||||||||||||
|
|
|
|
|
|
|
|
|
|
|
|
|
|
|
|||||||||||||||
| Total foreign exchange gains in 2022 |
$ | 9,235 | $ | 4,999 | $ | 3,027 | $ | 2,192 | $ | 93 | $ | 444 | $ | 19,990 | ||||||||||||||
|
|
|
|
|
|
|
|
|
|
|
|
|
|
|
|||||||||||||||
For the year ended December 31, 2022, the Company recorded a net loss on derivative financial instruments of $18,534, resulting in an overall net foreign exchange and financial instrument gain of $1,456. The following table demonstrates the types of derivative financial instruments entered into with respect to the above instruments and the composition of the net loss recognized in 2022:
| 150,000 Cross Currency Rate Swaps |
50,800 Foreign Exchange Forwards |
42,000 Foreign Exchange Forwards |
30,000 Foreign Exchange Forwards |
Euro Revolving Credit Facility Forwards |
Other Foreign Exchange Forwards |
Total | ||||||||||||||||||||||
| Derivative financial instrument losses in 2022 |
$ | (6,274 | ) | $ | (5,058 | ) | $ | (4,401 | ) | $ | (2,802 | ) | $ | | $ | 1 | $ | (18,534 | ) | |||||||||
|
|
|
|
|
|
|
|
|
|
|
|
|
|
|
|||||||||||||||
F-33
Table of Contents
Titan America SA and Subsidiaries
Notes to Consolidated Financial Statements
December 31, 2023, 2022 and 2021
(All amounts in thousands)
9. Foreign exchange and derivative financial instruments (continued)
For the year ended December 31, 2021, the Company recorded a net foreign exchange gain of $28,835:
| 150,000 Fixed Rate Loan |
75,000 Fixed Rate Loan |
45,000 Fixed Rate Loan |
32,800 Fixed Rate Loan |
Euro Revolving Credit Facility (RCF) |
Other | Total | ||||||||||||||||||||||
| Foreign exchange gains/(losses) arising from: |
||||||||||||||||||||||||||||
| Remeasurement and settlement of Euro denominated loan obligations (principal) |
$ | 14,175 | $ | 7,088 | $ | 3,519 | $ | 2,565 | $ | 133 | $ | 2,500 | $ | 29,980 | ||||||||||||||
| Remeasurement and settlement of Euro denominated loan obligations (finance cost) |
(163 | ) | 50 | 20 | 17 | | | (76 | ) | |||||||||||||||||||
| Other |
| | | | | (1,069 | ) | (1,069 | ) | |||||||||||||||||||
|
|
|
|
|
|
|
|
|
|
|
|
|
|
|
|||||||||||||||
| Total foreign exchange gains in 2021 |
$ | 14,012 | $ | 7,138 | $ | 3,539 | $ | 2,582 | $ | 133 | $ | 1,431 | $ | 28,835 | ||||||||||||||
|
|
|
|
|
|
|
|
|
|
|
|
|
|
|
|||||||||||||||
For the year ended December 31, 2021, the Company recorded a net loss on derivative financial instruments of $25,915, resulting in an overall net foreign exchange and financial instrument gain of $2,920. The following table demonstrates the types of derivative financial instruments entered into with respect to the above instruments and the composition of the net loss recognized in 2021:
| 200,000 Cross Currency / Rate Swaps |
150,000 Cross Currency Swaps |
75,000 Foreign Exchange Forwards |
RCF Foreign Exchange Forwards |
Other Foreign Exchange Forwards |
Total | |||||||||||||||||||
| Derivative financial instrument losses in 2021 |
$ | (4,637 | ) | $ | (10,019 | ) | $ | (3,935 | ) | $ | | $ | (7,324 | ) | $ | (25,915 | ) | |||||||
|
|
|
|
|
|
|
|
|
|
|
|
|
|||||||||||||
Activity within the Companys derivative financial instruments for the years ended December 31, 2023, December 31, 2022 and December 31, 2021 consists of the following:
| Derivative Financial Instruments - Asset/(Liability) | ||||||||||||||||||||||||||||
| Cross Currency Interest Rate Swaps Economic Hedge |
Interest Rate Swaps |
Foreign Exchange Forwards Economic Hedge |
Natural Gas Futures Cash Flow Hedge |
Total Derivatives |
Credit Support Payments/ (Receipts) |
Net Exposure |
||||||||||||||||||||||
| January 1, 2021 |
$ | (1,903 | ) | $ | | $ | 18,693 | $ | (58 | ) | $ | 16,732 | $ | (13,627 | ) | $ | 3,105 | |||||||||||
| Gain/(Loss) on derivative financial instruments |
(10,019 | ) | | (15,896 | ) | | (25,915 | ) | | (25,915 | ) | |||||||||||||||||
| Gain/(Loss) on derivative financial instruments through OCI |
| | | 826 | 826 | | 826 | |||||||||||||||||||||
| Settlement of derivative financial instruments |
| | (6,524 | ) | (1,996 | ) | (8,520 | ) | | (8,520 | ) | |||||||||||||||||
| Credit support payments on derivative financial instruments, net |
| | | | | 30,017 | 30,017 | |||||||||||||||||||||
|
|
|
|
|
|
|
|
|
|
|
|
|
|
|
|||||||||||||||
| December 31, 2021 |
$ | (11,922 | ) | $ | | $ | (3,727 | ) | $ | (1,228 | ) | $ | (16,877 | ) | $ | 16,390 | $ | (487 | ) | |||||||||
|
|
|
|
|
|
|
|
|
|
|
|
|
|
|
|||||||||||||||
F-34
Table of Contents
Titan America SA and Subsidiaries
Notes to Consolidated Financial Statements
December 31, 2023, 2022 and 2021
(All amounts in thousands)
9. Foreign exchange and derivative financial instruments (continued)
| Derivative Financial Instruments - Asset/(Liability) | ||||||||||||||||||||||||||||
| Cross Currency Interest Rate Swaps Economic Hedge |
Interest Rate Swaps |
Foreign Exchange Forwards Economic Hedge |
Natural Gas Futures Cash Flow Hedge |
Total Derivatives |
Credit Support Payments/ (Receipts) |
Net Exposure |
||||||||||||||||||||||
| Gain/(Loss) on derivative financial instruments |
(6,274 | ) | | (12,260 | ) | | (18,534 | ) | | (18,534 | ) | |||||||||||||||||
| Gain/(Loss) on derivative financial instruments through OCI |
| | | 4,267 | 4,267 | | 4,267 | |||||||||||||||||||||
| Gain/(Loss) on derivative financial instruments through finance costs |
| 3,461 | | | 3,461 | | 3,461 | |||||||||||||||||||||
| Settlement of derivative financial instruments |
| 250 | 19,827 | (5,969 | ) | 14,108 | | 14,108 | ||||||||||||||||||||
| Credit support receipts on derivative financial instruments, net |
| | | | | (633 | ) | (633 | ) | |||||||||||||||||||
|
|
|
|
|
|
|
|
|
|
|
|
|
|
|
|||||||||||||||
| December 31, 2022 |
$ | (18,196 | ) | $ | 3,711 | $ | 3,840 | $ | (2,930 | ) | $ | (13,575 | ) | $ | 15,757 | $ | 2,182 | |||||||||||
|
|
|
|
|
|
|
|
|
|
|
|
|
|
|
|||||||||||||||
| Gain/(Loss) on derivative financial instruments |
7,684 | | 3,283 | | 10,967 | | 10,967 | |||||||||||||||||||||
| Gain/(Loss) on derivative financial instruments through OCI |
| | | (4,387 | ) | (4,387 | ) | | (4,387 | ) | ||||||||||||||||||
| Gain/(Loss) on derivative financial instruments through finance costs |
| (186 | ) | | | (186 | ) | | (186 | ) | ||||||||||||||||||
| Settlement of derivative financial instruments |
| (1,453 | ) | (1,819 | ) | 7,327 | 4,055 | | 4,055 | |||||||||||||||||||
| Credit support receipts on derivative financial instruments, net |
| | | | | (11,429 | ) | (11,429 | ) | |||||||||||||||||||
|
|
|
|
|
|
|
|
|
|
|
|
|
|
|
|||||||||||||||
| December 31, 2023 |
$ | (10,512 | ) | $ | 2,072 | $ | 5,304 | $ | 10 | $ | (3,126 | ) | $ | 4,328 | $ | 1,202 | ||||||||||||
|
|
|
|
|
|
|
|
|
|
|
|
|
|
|
|||||||||||||||
As described further in Note 25, the Companys risk management strategy involves the use of cross-currency and interest rate swaps, and forward foreign exchange and commodities contracts.
| | Cross-currency and interest rate swaps are used to fix the U.S. Dollar cashflows (principal and interest) associated with Euro denominated borrowings. Over the life of the instruments, there is breakage in the derivative mark-to-market and foreign exchange gain/loss on borrowings due to the employment of partial term economic hedging strategies, the impact of the yield curve and evolution of the USD/Euro exchange rate on the derivative valuations. |
| | Foreign exchange forwards are used to mitigate the variation of the USD/Euro exchange rate for short-term intervals over the life of Euro denominated borrowings. The Company monitors market expectations for the USD/Euro exchange rate and will periodically buy USD/sell Euro to offset foreign exchange variation on designated Euro denominated transactions for the duration of the forwards. Over |
F-35
Table of Contents
Titan America SA and Subsidiaries
Notes to Consolidated Financial Statements
December 31, 2023, 2022 and 2021
(All amounts in thousands)
9. Foreign exchange and derivative financial instruments (continued)
| the life of the instruments, there is breakage in the derivative mark-to-market and foreign exchange gain/loss on borrowings due to the partial term economic hedging strategies and forward points associated with the derivative valuations. |
| | Natural gas commodities futures are used to fix the variable component of certain highly probable forecasted purchases of natural gas. |
10. Property, plant, equipment and mineral deposits
Activity within property, plant, equipment and mineral deposits, for the year ended December 31, 2023 consists of the following:
| Quarries | Land & Land Improvements |
Buildings | Machinery & equipment |
Motor vehicles |
Furniture & fixtures |
Assets under construction |
Total | |||||||||||||||||||||||||
| Opening balance |
$ | 113,948 | $ | 151,346 | $ | 35,740 | $ | 283,321 | $ | 87,928 | $ | 921 | $ | 75,061 | $ | 748,266 | ||||||||||||||||
| Additions |
7,917 | | | 681 | | | 111,521 | 120,119 | ||||||||||||||||||||||||
| Disposals |
| | (255 | ) | (3,405 | ) | (339 | ) | | | (3,999 | ) | ||||||||||||||||||||
| Reclassification |
47 | 7,070 | 27,775 | 43,342 | 22,557 | 4,180 | (104,309 | ) | 662 | |||||||||||||||||||||||
| Provision adjustments |
4,778 | (32 | ) | 118 | 2,885 | | | | 7,749 | |||||||||||||||||||||||
| Capitalized interest |
| | | | | | 2,826 | 2,826 | ||||||||||||||||||||||||
| Depreciation, depletion, & amortization (DD&A) |
(11,148 | ) | (2,166 | ) | (3,529 | ) | (38,430 | ) | (19,116 | ) | (812 | ) | | (75,201 | ) | |||||||||||||||||
| Impairment reserve |
(1,005 | ) | 1,450 | | (369 | ) | | | 533 | 609 | ||||||||||||||||||||||
|
|
|
|
|
|
|
|
|
|
|
|
|
|
|
|
|
|||||||||||||||||
| Ending balance |
$ | 114,537 | $ | 157,668 | $ | 59,849 | $ | 288,025 | $ | 91,030 | $ | 4,289 | $ | 85,633 | $ | 801,031 | ||||||||||||||||
|
|
|
|
|
|
|
|
|
|
|
|
|
|
|
|
|
|||||||||||||||||
| As of December 31, 2023 |
||||||||||||||||||||||||||||||||
| Cost |
254,832 | 216,944 | 150,219 | 957,365 | 313,197 | 19,248 | 90,670 | $ | 2,002,475 | |||||||||||||||||||||||
| Accumulated DD&A |
(139,290 | ) | (57,276 | ) | (90,370 | ) | (668,971 | ) | (222,167 | ) | (14,959 | ) | (5,037 | ) | (1,198,070 | ) | ||||||||||||||||
| Impairment reserve |
(1,005 | ) | (2,000 | ) | | (369 | ) | | | | (3,374 | ) | ||||||||||||||||||||
|
|
|
|
|
|
|
|
|
|
|
|
|
|
|
|
|
|||||||||||||||||
| Net book value |
$ | 114,537 | $ | 157,668 | $ | 59,849 | $ | 288,025 | $ | 91,030 | $ | 4,289 | $ | 85,633 | $ | 801,031 | ||||||||||||||||
|
|
|
|
|
|
|
|
|
|
|
|
|
|
|
|
|
|||||||||||||||||
The above amounts consist of assets owned by the Company. Refer to Note 11 for information about right-of-use assets. At December 31, 2023, the Company had accruals for capital projects totaling $11,683 and for the year ended December 31, 2023, the Company capitalized $2,826 of interest based on a capitalization rate of 5.51%. Management did not identify any events or changes in circumstances to indicate that the carrying amount may not be recoverable.
F-36
Table of Contents
Titan America SA and Subsidiaries
Notes to Consolidated Financial Statements
December 31, 2023, 2022 and 2021
(All amounts in thousands)
10. Property, plant, equipment and mineral deposits (continued)
Activity within property, plant, equipment and mineral deposits, for the year ended December 31, 2022 consists of the following:
| Quarries | Land & Land Improvements |
Buildings | Machinery & equipment |
Motor vehicles |
Furniture & fixtures |
Assets under construction |
Total | |||||||||||||||||||||||||
| Opening balance |
$ | 116,217 | $ | 153,221 | $ | 36,384 | $ | 243,686 | $ | 58,180 | $ | 2,017 | $ | 81,561 | $ | 691,266 | ||||||||||||||||
| Additions |
7,208 | | | 50 | | | 127,048 | 134,306 | ||||||||||||||||||||||||
| Disposals |
| | | (995 | ) | (451 | ) | | | (1,446 | ) | |||||||||||||||||||||
| Reclassification |
2,148 | 649 | 2,639 | 77,064 | 48,852 | (51 | ) | (133,488 | ) | (2,187 | ) | |||||||||||||||||||||
| Provision adjustments |
408 | 18 | (1 | ) | (771 | ) | | | | (346 | ) | |||||||||||||||||||||
| Capitalized interest |
| | | | | | 466 | 466 | ||||||||||||||||||||||||
| Depreciation, depletion, & amortization (DD&A) |
(12,033 | ) | (2,542 | ) | (3,282 | ) | (35,713 | ) | (18,653 | ) | (1,045 | ) | | (73,268 | ) | |||||||||||||||||
| Impairment reserve |
| | | | | | (525 | ) | (525 | ) | ||||||||||||||||||||||
|
|
|
|
|
|
|
|
|
|
|
|
|
|
|
|
|
|||||||||||||||||
| Ending balance |
$ | 113,948 | $ | 151,346 | $ | 35,740 | $ | 283,321 | $ | 87,928 | $ | 921 | $ | 75,062 | $ | 748,266 | ||||||||||||||||
|
|
|
|
|
|
|
|
|
|
|
|
|
|
|
|
|
|||||||||||||||||
| As of December 31, 2022 |
||||||||||||||||||||||||||||||||
| Cost |
$ | 242,136 | $ | 209,935 | $ | 123,262 | $ | 922,670 | $ | 299,148 | $ | 15,971 | $ | 79,990 | $ | 1,893,112 | ||||||||||||||||
| Accumulated DD&A |
(128,188 | ) | (55,139 | ) | (87,522 | ) | (639,349 | ) | (211,220 | ) | (15,050 | ) | (4,396 | ) | (1,140,864 | ) | ||||||||||||||||
| Impairment reserve |
| (3,450 | ) | | | | | (532 | ) | (3,982 | ) | |||||||||||||||||||||
|
|
|
|
|
|
|
|
|
|
|
|
|
|
|
|
|
|||||||||||||||||
| Net book value |
$ | 113,948 | $ | 151,346 | $ | 35,740 | $ | 283,321 | $ | 87,928 | $ | 921 | $ | 75,062 | $ | 748,266 | ||||||||||||||||
|
|
|
|
|
|
|
|
|
|
|
|
|
|
|
|
|
|||||||||||||||||
The above amounts consist of assets owned by the Company. Refer to Note 11 for information about right-of-use assets. At December 31, 2022, the Company had accruals for capital projects totaling $9,685 and for the year ended December 31, 2022, the Company capitalized $466 of interest based on a capitalization rate of 5.74%. Management did not identify any events or changes in circumstances to indicate that the carrying amount may not be recoverable.
11. Right-of-use assets and lease liabilities
The Consolidated Statements of Financial Position includes the following amounts related to leases:
| December 31 2023 |
December 31 2022 |
|||||||
| Right-of-use assets |
||||||||
| Land & Land Improvements |
$ | 18,219 | $ | 13,184 | ||||
| Buildings |
17,004 | 18,049 | ||||||
| Machinery & equipment |
22,165 | 27,339 | ||||||
| Motor vehicles |
4,053 | 3,101 | ||||||
|
|
|
|
|
|||||
| $ | 61,441 | $ | 61,673 | |||||
|
|
|
|
|
|||||
| Lease liabilities |
||||||||
| Current |
$ | 11,737 | $ | 13,532 | ||||
| Non-Current |
53,744 | 54,055 | ||||||
|
|
|
|
|
|||||
| $ | 65,481 | $ | 67,587 | |||||
|
|
|
|
|
|||||
For the year ended December 31, 2023, additions to right-of-use assets for new leases, lease modifications and lease related obligations totaled $11,678.
F-37
Table of Contents
Titan America SA and Subsidiaries
Notes to Consolidated Financial Statements
December 31, 2023, 2022 and 2021
(All amounts in thousands)
11. Right-of-use assets and lease liabilities (continued)
For the year ended December 31, 2022, additions to right-of-use assets for new leases, lease modifications and lease related obligations totaled $28,403, which includes a lease modification executed on December 27, 2022 for certain real estate located in Hillsborough County, Florida. Management concluded this amended and restated lease agreement qualified as a single modified lease and remeasured the lease liability and right-of-use asset resulting in incremental increase in both balances of $7,607.
In 2023 and 2022, Management did not identify any events or changes in circumstances to indicate that the carrying amount may not be recoverable.
The Consolidated Statements of Income includes the following amounts related to leases:
| 2023 | 2022 | 2021 | ||||||||||
| Depreciation expense on right-of-use assets |
||||||||||||
| Land & Land Improvements |
$ | 1,849 | $ | 1,634 | $ | 1,649 | ||||||
| Buildings |
2,153 | 1,998 | 1,891 | |||||||||
| Machinery & equipment |
6,062 | 6,015 | 5,085 | |||||||||
| Motor vehicles |
1,179 | 985 | 775 | |||||||||
|
|
|
|
|
|
|
|||||||
| $ | 11,243 | $ | 10,632 | $ | 9,400 | |||||||
|
|
|
|
|
|
|
|||||||
| Interest expense on lease liabilities |
$ | 3,047 | $ | 2,038 | $ | 2,092 | ||||||
| Expenses relating to short-term leases, including leases with a term of one month or less |
$ | 22,433 | $ | 14,355 | $ | 12,216 | ||||||
| Expense relating to leases of low-value assets that are not shown above as short-term leases |
$ | 46 | $ | 434 | $ | 224 | ||||||
12. Intangible assets
Activity within intangible assets, for the year ended December 31, 2023 consists of the following:
| Customer relationships |
Tradenames | Software | Other | Total | ||||||||||||||||
| Opening balance |
$ | 179 | $ | 13,980 | $ | 21,509 | $ | 348 | $ | 36,016 | ||||||||||
| Additions |
| | 1,832 | | 1,832 | |||||||||||||||
| Reclassification |
| | | | | |||||||||||||||
| Amortization |
(179 | ) | | (4,358 | ) | (98 | ) | (4,635 | ) | |||||||||||
|
|
|
|
|
|
|
|
|
|
|
|||||||||||
| Ending balance |
$ | | $ | 13,980 | $ | 18,983 | $ | 250 | $ | 33,213 | ||||||||||
|
|
|
|
|
|
|
|
|
|
|
|||||||||||
| As of December 31, 2023 |
||||||||||||||||||||
| Cost |
2,153 | 13,980 | 37,022 | 969 | 54,124 | |||||||||||||||
| Accumulated amortization |
(2,153 | ) | | (18,039 | ) | (719 | ) | (20,911 | ) | |||||||||||
|
|
|
|
|
|
|
|
|
|
|
|||||||||||
| Net book value |
$ | | $ | 13,980 | $ | 18,983 | $ | 250 | $ | 33,213 | ||||||||||
|
|
|
|
|
|
|
|
|
|
|
|||||||||||
As of December 31, 2023, the Company wrote off $9,700 of fully amortized core technology and $58,520 of fully amortized customer relationships since management concluded that these intangibles no longer had value in use.
F-38
Table of Contents
Titan America SA and Subsidiaries
Notes to Consolidated Financial Statements
December 31, 2023, 2022 and 2021
(All amounts in thousands)
12. Intangible assets (continued)
Activity within intangible assets, net, for the year ended December 31, 2022 consists of the following:
| Core technology |
Customer relationships |
Tradenames | Software | Other | Total | |||||||||||||||||||
| Opening balance |
$ | | $ | 485 | $ | 13,980 | $ | 21,784 | $ | 446 | $ | 36,695 | ||||||||||||
| Additions |
| | | 3,149 | | 3,149 | ||||||||||||||||||
| Amortization |
| (306 | ) | | (3,424 | ) | (98 | ) | (3,828 | ) | ||||||||||||||
|
|
|
|
|
|
|
|
|
|
|
|
|
|||||||||||||
| Ending balance |
$ | | $ | 179 | $ | 13,980 | $ | 21,509 | $ | 348 | $ | 36,016 | ||||||||||||
|
|
|
|
|
|
|
|
|
|
|
|
|
|||||||||||||
| As of December 31, 2022 |
||||||||||||||||||||||||
| Cost |
9,700 | 60,673 | 13,980 | 35,190 | 1,370 | 120,913 | ||||||||||||||||||
| Accumulated amortization |
(9,700 | ) | (60,494 | ) | | (13,681 | ) | (1,022 | ) | (84,897 | ) | |||||||||||||
|
|
|
|
|
|
|
|
|
|
|
|
|
|||||||||||||
| Net book value |
$ | | $ | 179 | $ | 13,980 | $ | 21,509 | $ | 348 | $ | 36,016 | ||||||||||||
|
|
|
|
|
|
|
|
|
|
|
|
|
|||||||||||||
Tradenames comprise indefinite-lived intangible assets, which have been allocated to the Mid-Atlantic Business unit for purposes of impairment testing. No impairment was recognized in 2023, 2022, or 2021 (see Note 13 for additional information regarding impairment testing). In 2023, 2022 and 2021, for all other indefinite-lived intangible assets, Management did not identify any events or changes in circumstances to indicate that the carrying amount may not be recoverable.
13. Goodwill
As of December 31, 2023, the Company has not recorded impairment of goodwill or tradenames since the recoverable amounts of the Companys CGUs are estimated to exceed their respective carrying amounts.
Impairment testing of goodwill and tradenames
Goodwill acquired through business combinations and tradenames have been allocated to the following CGUs:
| 2023 | 2022 | |||||||
| Mid-Atlantic Business Unit: |
||||||||
| Goodwill |
$ | 164,768 | $ | 164,768 | ||||
| Tradenames |
13,980 | 13,980 | ||||||
| Florida Business Unit |
56,794 | 56,794 | ||||||
|
|
|
|
|
|||||
| Total goodwill and tradenames |
$ | 235,542 | $ | 235,542 | ||||
|
|
|
|
|
|||||
Key assumptions
The recoverable amount of all CGUs has been determined based on value-in-use calculations net of costs to sell. These calculations use pre-tax cash flow projections based on financial budgets and forecasts approved by Management covering a five-year period. Cash flows beyond the five-year period are extrapolated using the estimated long-term growth rates described below.
The calculation of value-in-use for the Companys CGUs is most sensitive to the following assumptions:
| | Sales volumes; |
F-39
Table of Contents
Titan America SA and Subsidiaries
Notes to Consolidated Financial Statements
December 31, 2023, 2022 and 2021
(All amounts in thousands)
13. Goodwill (continued)
| | Selling prices; |
| | Long-term growth rates; and |
| | Discount rates. |
The following tables list the assumptions used in each years value-in-use calculations:
| 2023 | 2022 | |||||||
| Five-year compound annual growth rate - sales volumes |
||||||||
| Florida Business Unit |
5.9 | % | 3.8 | % | ||||
| Mid-Atlantic Business Unit |
4.1 | % | 2.2 | % | ||||
| Five-year compound annual growth rate - selling prices |
||||||||
| Florida Business Unit |
2.3 | % | 5.4 | % | ||||
| Mid-Atlantic Business Unit |
2.4 | % | 4.1 | % | ||||
| Long-term growth rate |
||||||||
| Florida Business Unit |
2.4 | % | 3.0 | % | ||||
| Mid-Atlantic Business Unit |
2.4 | % | 2.0 | % | ||||
Sales Volumes
Management estimates sales volumes utilizing independent industry forecasts, taking into consideration its position in the market relative to its competitors. Consistent with these independent industry forecasts, Management expects construction spending and sales volumes in its key markets to further improve during the 2024-2028 period. At December 31, 2023, the date of the most recent impairment test, the Company assumed a weighted average sales volume compound annual growth rates ranging from 1.3% to 8.0% among its core operating activities of cement, aggregates, and ready-mix concrete for the 2024-2028 period. Lower growth rates were assumed where supply constraints or other limiting external factors are assumed to exist.
Selling Prices
As part of the December 31, 2023 impairment tests, the Company assumed a weighted average net realized selling price compound annual growth rates generally ranging from 0.7% to 3.0% among its core operating activities of cement, aggregates, and ready-mix concrete for the 2024-2028 period. Lower growth rates were assumed where new production capacity in relevant markets is expected to increase competitive supply, while higher growth rates were assumed where structural supply constraints are present.
Long-term Growth Rates
Long-term growth rates are used to extrapolate cash flows beyond the 5-year projection period and are based on published industry research, taking into account demographic trends such as population growth, household formation and economic output (among other factors) in the states where the Company operates. In addition to demographic trends, long-term growth rates consider cement/concrete intensity in construction which has historically varied from state to state based on building codes, availability of raw materials and other factors. At December 31, 2023, long-term growth rates were estimated by management to be 2.4% and are dependent on the industry projections, inflation and other economic factors.
F-40
Table of Contents
Titan America SA and Subsidiaries
Notes to Consolidated Financial Statements
December 31, 2023, 2022 and 2021
(All amounts in thousands)
13. Goodwill (continued)
Discount Rates
Estimated CGU cash flows are discounted to present value using discount rates reflecting the current market assessment of the risks associated with each CGU. The discount rate calculation is derived from the Companys weighted average cost of capital and considers both debt and equity funding costs. The cost of equity is derived from the expected return on investment by the Companys investors while the cost of debt is based on the interest-bearing borrowings the Company is obligated to service. An average pre-tax discount rate of 9.2% and 8.5% was used in the value-in-use calculations at December 31, 2023 and December 31, 2022, respectively.
Sensitivity of recoverable amounts
As part of the December 31, 2023 impairment tests, the Company analyzed the sensitivities of the recoverable amounts to a reasonably possible change in key assumptions. These analyses did not show a situation in which the carrying value of the CGUs would exceed their recoverable amount.
14. Inventories
The components of inventories at December 31, 2023 and December 31, 2022 are as follows:
| 2023 | 2022 | |||||||
| Finished goods |
$ | 63,809 | $ | 61,125 | ||||
| Spare parts |
61,833 | 53,537 | ||||||
| Work in process |
32,823 | 30,555 | ||||||
| Raw materials |
22,641 | 26,537 | ||||||
| Manufacturing supplies and other |
8,883 | 9,050 | ||||||
|
|
|
|
|
|||||
| Total Inventory |
$ | 189,989 | $ | 180,804 | ||||
|
|
|
|
|
|||||
Accruals for the write-downs of inventories to net realizable value were $816 and $2,427 as of December 31, 2023 and 2022, respectively. Further, the reversals of write-downs of inventories to net realizable value totaled $1,611 during 2023 and $0 for 2022 due to improved productions efficiencies during the periods.
15. Trade receivables
Trade receivables are non-interest bearing and are normally settled within the terms of the invoice. Impairment is measured using provisioning rates based on days past due for groupings of customer segments with similar characteristics. The provisioning rates used in calculating the impairment of trade receivables ranged from 0% to 1.9% as of December 31, 2023 (0.5% to 1.9% as of December 31, 2022). The calculation reflects the probability-weighted outcome, the time value of money and reasonable and supportable information that is available at the reporting date about past events, current conditions and forecasts of future economic conditions (primarily GDP and the unemployment rate), in addition to specific information about individual receivables.
Among other factors, credit decisions consider:
| | how long the company has been in business; |
F-41
Table of Contents
Titan America SA and Subsidiaries
Notes to Consolidated Financial Statements
December 31, 2023, 2022 and 2021
(All amounts in thousands)
15. Trade receivables (continued)
| | past and present payment history; |
| | financial information provided by the credit applicant; |
| | availability of payment bonds; and |
| | availability of liens and other forms of guarantee. |
Credit is only granted to businesses, and upon approval, all customers are assigned a credit limit and risk rating, which are reviewed periodically. Delinquent accounts are followed-up in a timely manner for collection and to maximize cashflow and minimize past due accounts. Accounts deemed uncollectible are subject to write-off in accordance with established limits of approval. The Company periodically updates lifetime expected credit loss rates across the different accounts receivable portfolios and aging buckets and continuously monitors individual customer accounts with elevated credit risk due to specific circumstances.
The components of trade receivables, at December 31, 2023 and December 31, 2022 are as follows:
| 2023 | 2022 | |||||||
| Trade receivables |
$ | 60,719 | $ | 60,375 | ||||
| Expected credit loss allowance |
(4,846 | ) | (3,930 | ) | ||||
|
|
|
|
|
|||||
| Total trade receivables, net |
$ | 55,873 | $ | 56,445 | ||||
|
|
|
|
|
|||||
As of December 31, 2023, the aging analysis of trade receivables is as follows:
| Trade receivables |
Expected credit loss allowance |
Trade receivables, net |
||||||||||
| Current |
$ | 34,400 | $ | (410 | ) | $ | 33,990 | |||||
| 1-30 days past due |
12,273 | (181 | ) | 12,092 | ||||||||
| 30-60 days past due |
6,229 | (239 | ) | 5,990 | ||||||||
| 60-90 days past due |
2,112 | (101 | ) | 2,011 | ||||||||
| 90-120 days past due |
673 | (96 | ) | 577 | ||||||||
| >120 days past due |
5,032 | (3,819 | ) | 1,213 | ||||||||
|
|
|
|
|
|
|
|||||||
| $ | 60,719 | $ | (4,846 | ) | $ | 55,873 | ||||||
|
|
|
|
|
|
|
|||||||
As of December 31, 2022, the aging analysis of trade receivables is as follows:
| Trade receivables |
Expected credit loss allowance |
Trade receivables, net |
||||||||||
| Current |
$ | 42,015 | $ | (655 | ) | $ | 41,360 | |||||
| 1-30 days past due |
1,103 | (55 | ) | 1,048 | ||||||||
| 30-60 days past due |
4,586 | (525 | ) | 4,061 | ||||||||
| 60-90 days past due |
3,287 | (384 | ) | 2,903 | ||||||||
| 90-120 days past due |
1,705 | (302 | ) | 1,403 | ||||||||
| >120 days past due |
7,679 | (2,009 | ) | 5,670 | ||||||||
|
|
|
|
|
|
|
|||||||
| $ | 60,375 | $ | (3,930 | ) | $ | 56,445 | ||||||
|
|
|
|
|
|
|
|||||||
F-42
Table of Contents
Titan America SA and Subsidiaries
Notes to Consolidated Financial Statements
December 31, 2023, 2022 and 2021
(All amounts in thousands)
15. Trade receivables (continued)
Activity within the expected credit loss allowance for the years ended December 31, 2023 and December 31, 2022 consists of the following:
| 2023 | 2022 | |||||||
| Balance at January 1 |
$ | (3,930 | ) | $ | (4,471 | ) | ||
| Bad debt expense for the year |
(1,177 | ) | (1,272 | ) | ||||
| Utilization and other adjustments |
261 | 1,813 | ||||||
|
|
|
|
|
|||||
| Balance at December 31 |
$ | (4,846 | ) | $ | (3,930 | ) | ||
|
|
|
|
|
|||||
16. Prepaid Expenses and Other Current Assets
The components of prepaid expenses and other current assets at December 31, 2023 and December 31, 2022 are as follows:
| 2023 | 2022 | |||||||
| Prepaid insurance |
$ | 6,780 | $ | 5,400 | ||||
| Prepaid overhead expenses (rent, software maintenance dues and subscriptions) |
7,549 | 7,931 | ||||||
| Prepaid royalty |
| 190 | ||||||
| Prepaid licenses and permits |
1,331 | 1,408 | ||||||
| Prepaid highway use tax |
208 | 183 | ||||||
| Other |
326 | 84 | ||||||
|
|
|
|
|
|||||
| Total prepaid expenses and other current assets |
$ | 16,194 | $ | 15,196 | ||||
|
|
|
|
|
|||||
17. Other Receivables
The components of other receivables, at December 31, 2023 and December 31, 2022 are as follows:
| 2023 | 2022 | |||||||
| Receivables due from SPE, net (Note 7) |
$ | 59,346 | $ | 51,560 | ||||
| Receivables, non-trade |
3,473 | 2,540 | ||||||
| Reserve for receivables, non-trade |
(2,602 | ) | (2,519 | ) | ||||
| Rebates and refunds due |
742 | 2,586 | ||||||
| Reimbursements |
746 | 981 | ||||||
| Deposits |
514 | 2,683 | ||||||
| Other |
2,902 | 2,532 | ||||||
|
|
|
|
|
|||||
| Total other receivables, net |
$ | 65,121 | $ | 60,363 | ||||
|
|
|
|
|
|||||
F-43
Table of Contents
Titan America SA and Subsidiaries
Notes to Consolidated Financial Statements
December 31, 2023, 2022 and 2021
(All amounts in thousands)
17. Other Receivables (continued)
As of December 31, 2023, the aging analysis of other receivables, is as follows:
| Other receivables |
Allowances | Other receivables, net |
||||||||||
| Neither past due nor impaired |
$ | 62,219 | $ | | $ | 62,219 | ||||||
| <180 days |
4,203 | (2,486 | ) | 1,717 | ||||||||
| 180-365 days |
1,301 | (116 | ) | 1,185 | ||||||||
|
|
|
|
|
|
|
|||||||
| $ | 67,723 | $ | (2,602 | ) | $ | 65,121 | ||||||
|
|
|
|
|
|
|
|||||||
As of December 31, 2022, the aging analysis of other receivables, is as follows:
| Other receivables |
Allowances | Other receivables, net |
||||||||||
| Neither past due nor impaired |
$ | 57,128 | $ | | $ | 57,128 | ||||||
| <180 days |
4,237 | (2,349 | ) | 1,888 | ||||||||
| 180-365 days |
1,517 | (170 | ) | 1,347 | ||||||||
|
|
|
|
|
|
|
|||||||
| $ | 62,882 | $ | (2,519 | ) | $ | 60,363 | ||||||
|
|
|
|
|
|
|
|||||||
18. Credit facilities and long-term debt
The carrying amount and the fair value of the Companys debt obligations, including leases, at December 31, 2023, is as follows:
| 2023 | ||||||||
| Carrying Amount | Fair Value | |||||||
| Current |
||||||||
| Loans from third parties |
$ | 2 | $ | 2 | ||||
| Loans from related parties |
267,668 | 264,446 | ||||||
| Lease liabilities |
11,737 | 11,395 | ||||||
|
|
|
|
|
|||||
| $ | 279,407 | $ | 275,843 | |||||
| Non-current |
||||||||
| Loans from related parties |
$ | 76,262 | $ | 75,330 | ||||
| Lease liabilities |
53,744 | 41,246 | ||||||
|
|
|
|
|
|||||
| $ | 130,006 | $ | 116,576 | |||||
|
|
|
|
|
|||||
| Total borrowings |
$ | 409,413 | $ | 392,419 | ||||
|
|
|
|
|
|||||
F-44
Table of Contents
Titan America SA and Subsidiaries
Notes to Consolidated Financial Statements
December 31, 2023, 2022 and 2021
(All amounts in thousands)
18. Credit facilities and long-term debt (continued)
The carrying amount and the fair value of the Companys debt obligations, including leases, as of December 31, 2022, is as follows:
| 2022 | ||||||||
| Carrying Amount | Fair Value | |||||||
| Current |
||||||||
| Loans from third parties |
$ | 70,586 | $ | 70,586 | ||||
| Loans from related parties |
3,753 | 2,630 | ||||||
| Lease liabilities |
13,532 | 13,136 | ||||||
|
|
|
|
|
|||||
| $ | 87,871 | $ | 86,352 | |||||
| Non-current |
||||||||
| Loans from related parties |
$ | 320,167 | $ | 309,852 | ||||
| Lease liabilities |
54,055 | 41,783 | ||||||
|
|
|
|
|
|||||
| $ | 374,222 | $ | 351,635 | |||||
|
|
|
|
|
|||||
| Total borrowings |
$ | 462,093 | $ | 437,987 | ||||
|
|
|
|
|
|||||
In April 2017, the Company entered into a 250,000 multicurrency revolving credit facility with TGF, bearing interest at variable rates and maturing on January 30, 2022. In July 2019, the agreement was amended to increase the facility to 340,000. In April 2020, the facility was reduced to 100,000 by an amendment dated April 29, 2020. In January 2022 the agreement maturity date was extended to January 30, 2026. At December 31, 2023 and 2022, there was $40,333 (36,500 equivalent) and $30,000 outstanding borrowings respectively under the facility.
The Company has a committed borrowing facility with a bank of $45,000 with $15,000 available for the issuance of letters of credit. The maturity date of this facility is March 15, 2024. The facility provides for daily drawdowns and repayments at a borrowing rate based on SOFR. In connection with the borrowing facility, the Company has agreed to financial covenants related to operating EBITDA, tangible net worth and maintenance of a committed line of credit as well as non-financial covenants including restrictions on incurring certain liens on or disposing of certain existing assets without notification to the lender. As of December 31, 2023, the Company was in compliance with all the covenants. The facility is guaranteed by TCI. At December 31, 2023 and 2022, there was $0 and $0 outstanding borrowings respectively under the facility.
The Company has a uncommitted borrowing facility with a bank of $40,000 with the full amount available for the issuance of letters of credit. The maturity date of this facility is December 20, 2024. The facility provides for loans at variable interest rates based on SOFR which are reset periodically depending on the term and type of draw made thereunder. In connection with the borrowing facility, Titan America has agreed to certain covenants including restrictions on incurring certain liens on or disposing of certain existing assets without notification to the lender. As of December 31, 2023, the Company was in compliance with all of the covenants. The facility is guaranteed by TCI. At December 31, 2023 and 2022, there was $0 and $25,000 outstanding borrowings respectively under the facility.
F-45
Table of Contents
Titan America SA and Subsidiaries
Notes to Consolidated Financial Statements
December 31, 2023, 2022 and 2021
(All amounts in thousands)
18. Credit facilities and long-term debt (continued)
The Company has a uncommitted borrowing facility with a bank of $60,000. The maturity date of this facility is July 5, 2024. The facility provides for loans at variable interest rates based on SOFR which are reset periodically depending on the term and type of draw made thereunder. In connection with the borrowing facility, The Company has agreed to certain covenants including restrictions on disposing of certain existing assets without notification to the lender. As of December 31, 2023, the Company was in compliance with all of the covenants. The facility is guaranteed by TCI. At December 31, 2023 and 2022, there was $0 and $45,000 outstanding borrowings respectively under the facility.
In December 2017, the Company entered into a 150,000 note payable with TGF bearing interest of 3.07% through July 16, 2021 and 3.15% through the maturity date of November 15, 2024. In December 2022 the interest rate was modified to 3.05% through the maturity date of November 15, 2024. In April 2022 the Company paid back 30,000 of this note leaving a 120,000 balance as of December 31, 2023.
In March 2018, the Company entered into a 75,000 note payable with the TGF bearing interest at 3.15% and maturing on November 15, 2024. In December 2022 the interest rate was modified to 3.05% through the maturity date of November 15, 2024.
In June 2021 the Company entered into two separate loans with TGF. The first loan was a 45,000 note payable bearing interest at 3.15% and maturing on November 14, 2024. In December 2022 the interest rate was modified to 3.05% through the maturity date of November 14, 2024. The second loan was a 32,800 note payable bearing interest at 3.35% and maturing on July 7, 2027.
The maturity profile of the Companys non-current borrowings, including lease liabilities, is presented below:
| 2023 | 2022 | |||||||
| Loans from related parties |
||||||||
| Between 1 and 2 years |
$ | | $ | 255,585 | ||||
| Between 2 and 3 years |
40,333 | | ||||||
| Between 3 and 4 years |
35,929 | 30,000 | ||||||
| Between 4 and 5 years |
| 34,582 | ||||||
| Over 5 years |
| | ||||||
|
|
|
|
|
|||||
| Total loans from related parties |
$ | 76,262 | $ | 320,167 | ||||
| Lease liabilities |
||||||||
| Between 1 and 2 years |
$ | 8,777 | $ | 8,842 | ||||
| Between 2 and 3 years |
8,576 | 8,184 | ||||||
| Between 3 and 4 years |
5,406 | 7,290 | ||||||
| Between 4 and 5 years |
3,986 | 4,786 | ||||||
| Over 5 years |
26,999 | 24,953 | ||||||
|
|
|
|
|
|||||
| Total lease liabilities |
$ | 53,744 | $ | 54,055 | ||||
|
|
|
|
|
|||||
| Total non-current borrowings |
$ | 130,006 | $ | 374,222 | ||||
|
|
|
|
|
|||||
F-46
Table of Contents
Titan America SA and Subsidiaries
Notes to Consolidated Financial Statements
December 31, 2023, 2022 and 2021
(All amounts in thousands)
18. Credit facilities and long-term debt (continued)
The exposure of the Companys borrowings, including lease obligations, to interest rate changes and the periods in which the borrowings mature or re-price is follows:
| 2023 | 2022 | |||||||
| Loans from related parties |
||||||||
| Within 6 months |
$ | | $ | 3,753 | ||||
| Between 6 months and 1 year |
267,668 | | ||||||
| Between 1 and 5 years |
76,262 | 320,167 | ||||||
| Later years |
| | ||||||
|
|
|
|
|
|||||
| Total loans from related parties |
$ | 343,930 | $ | 323,920 | ||||
| Loans from third parties |
$ | 2 | $ | 70,586 | ||||
| Lease liabilities |
||||||||
| Within 6 months |
$ | 5,833 | $ | 6,960 | ||||
| Between 6 months and 1 year |
5,904 | 6,572 | ||||||
| Between 1 and 5 years |
33,480 | 33,759 | ||||||
| Later years |
20,264 | 20,296 | ||||||
|
|
|
|
|
|||||
| Total lease liabilities |
$ | 65,481 | $ | 67,587 | ||||
|
|
|
|
|
|||||
| Total exposure |
$ | 409,413 | $ | 462,093 | ||||
|
|
|
|
|
|||||
The weighted average effective interest rates at December 31, 2023 and 2022 are as follows:
| 2023 | 2022 | 2021 | ||||||||||
| Variable rate loans from related parties |
5.82 | % | 6.86 | % | N/A | |||||||
| Fixed rate loans from related parties |
3.09 | % | 3.09 | % | 3.34 | % | ||||||
| Variable rate loans from third parties |
N/A | 5.82 | % | 0.89 | % | |||||||
Borrowings by currency, including lease obligations, at December 31, 2023 and 2022 are as follows:
| 2023 | 2022 | |||||||
| Lease liabilities and loans from third parties |
||||||||
| US Dollar |
$ | 65,483 | $ | 138,173 | ||||
| Loans from related parties |
||||||||
| Euro |
303,310 | 293,623 | ||||||
| USD |
40,620 | 30,297 | ||||||
|
|
|
|
|
|||||
| Total |
$ | 409,413 | $ | 462,093 | ||||
|
|
|
|
|
|||||
F-47
Table of Contents
Titan America SA and Subsidiaries
Notes to Consolidated Financial Statements
December 31, 2023, 2022 and 2021
(All amounts in thousands)
18. Credit facilities and long-term debt (continued)
The Company has the following undrawn borrowing facilities at December 31, 2023 and 2022, respectively:
| 2023 | 2022 | |||||||
| Floating rate: |
||||||||
| Expiring within one year |
$ | 132,466 | $ | 51,545 | ||||
| Expiring beyond one year |
69,880 | 76,660 | ||||||
|
|
|
|
|
|||||
| Total |
$ | 202,346 | $ | 128,205 | ||||
|
|
|
|
|
|||||
The Company maintains letter of credit facilities with banks, which are guaranteed by TCI. No amounts were drawn against the letters of credit at December 31, 2023 or 2022. At December 31, 2023 and 2022, the banks had issued letters of credit on behalf of the Company totaling $12,534 and $13,455, respectively, as shown below:
| 2023 | 2022 | |||||||
| Facility amount |
$ | 55,000 | $ | 55,000 | ||||
| Less letters of credit issued in support of: |
||||||||
| Casualty, liability, and workers compensation insurance programs |
(12,199 | ) | (13,120 | ) | ||||
| Performance obligations |
(100 | ) | (100 | ) | ||||
| Other payment obligations |
(235 | ) | (235 | ) | ||||
|
|
|
|
|
|||||
| Available facility amount |
$ | 42,466 | $ | 41,545 | ||||
|
|
|
|
|
|||||
In addition to the letter of credit facilities described above, the Company maintains a performance bond facility with an insurance company, which is guaranteed by TCI. No amounts were drawn against the performance bonds at December 31, 2023 and 2022. At December 31, 2023 and 2022, the insurance company had issued performance bonds on behalf of the Company totaling $35,140 and $34,688, respectively, as shown below:
| 2023 | 2022 | |||||||
| Facility amount |
$ | 60,000 | $ | 40,000 | ||||
| Less performance bonds issued in support of: |
||||||||
| Excavation and reclamation obligations |
(4,954 | ) | (4,375 | ) | ||||
| Surety bond |
(3,629 | ) | (3,629 | ) | ||||
| Other payment and performance obligations |
(26,557 | ) | (26,684 | ) | ||||
|
|
|
|
|
|||||
| Available facility amount |
$ | 24,860 | $ | 5,312 | ||||
|
|
|
|
|
|||||
F-48
Table of Contents
Titan America SA and Subsidiaries
Notes to Consolidated Financial Statements
December 31, 2023, 2022 and 2021
(All amounts in thousands)
18. Credit facilities and long-term debt (continued)
Changes arising from financing activities during the year ended December 31, 2023 are as follows:
| 2022 | Cash Flows | Foreign Exchange |
Mark-to- Market |
Interest Expense |
New Leases |
Other | 2023 | |||||||||||||||||||||||||
| Borrowings |
$ | 394,506 | $ | (83,046 | ) | $ | 12,055 | $ | | $ | 20,498 | $ | | $ | (81 | ) | $ | 343,932 | ||||||||||||||
| Lease liabilities |
67,587 | (15,198 | ) | | | 3,047 | 11,678 | (1,633 | ) | 65,481 | ||||||||||||||||||||||
|
|
|
|
|
|
|
|
|
|
|
|
|
|
|
|
|
|||||||||||||||||
| Changes in liabilities |
462,093 | (98,244 | ) | 12,055 | | 23,545 | 11,678 | (1,714 | ) | 409,413 | ||||||||||||||||||||||
| Derivative financial instruments |
13,575 | 3,272 | | (13,907 | ) | 186 | | | 3,126 | |||||||||||||||||||||||
| Financial instrument collateral |
(15,757 | ) | 11,399 | 30 | | | | | (4,328 | ) | ||||||||||||||||||||||
|
|
|
|
|
|
|
|
|
|
|
|
|
|
|
|
|
|||||||||||||||||
| Other financing activities |
(2,182 | ) | 14,671 | 30 | (13,907 | ) | 186 | | | (1,202 | ) | |||||||||||||||||||||
|
|
|
|
|
|
|
|
|
|
|
|
|
|
|
|
|
|||||||||||||||||
| Total liabilities arising from financing activities |
$ | 459,911 | $ | (83,573 | ) | $ | 12,085 | $ | (13,907 | ) | $ | 23,731 | $ | 11,678 | $ | (1,714 | ) | $ | 408,211 | |||||||||||||
|
|
|
|
|
|
|
|
|
|
|
|
|
|
|
|
|
|||||||||||||||||
Changes arising from financing activities during the year ended December 31, 2022 are as follows:
| 2021 | Cash Flows | Foreign Exchange |
Mark-to- Market |
Interest Expense |
New Leases |
Other | 2022 | |||||||||||||||||||||||||
| Borrowings |
$ | 382,696 | $ | 11,104 | $ | (19,670 | ) | $ | | $ | 19,780 | $ | | $ | 596 | $ | 394,506 | |||||||||||||||
| Lease liabilities |
53,941 | (13,428 | ) | | | 2,038 | 26,041 | (1,005 | ) | 67,587 | ||||||||||||||||||||||
|
|
|
|
|
|
|
|
|
|
|
|
|
|
|
|
|
|||||||||||||||||
| Changes in liabilities |
436,637 | (2,324 | ) | (19,670 | ) | | 21,818 | 26,041 | (409 | ) | 462,093 | |||||||||||||||||||||
| Derivative financial instruments |
16,877 | (19,827 | ) | | 20,236 | (3,711 | ) | | | 13,575 | ||||||||||||||||||||||
| Financial instrument collateral |
(16,390 | ) | 490 | | | | | 143 | (15,757 | ) | ||||||||||||||||||||||
|
|
|
|
|
|
|
|
|
|
|
|
|
|
|
|
|
|||||||||||||||||
| Other financing activities |
487 | (19,337 | ) | | 20,236 | (3,711 | ) | | 143 | (2,182 | ) | |||||||||||||||||||||
|
|
|
|
|
|
|
|
|
|
|
|
|
|
|
|
|
|||||||||||||||||
| Total liabilities arising from financing activities |
$ | 437,124 | (21,661 | ) | $ | (19,670 | ) | $ | 20,236 | $ | 18,107 | $ | 26,041 | $ | (266 | ) | $ | 459,911 | ||||||||||||||
|
|
|
|
|
|
|
|
|
|
|
|
|
|
|
|
|
|||||||||||||||||
Changes arising from financing activities during the year ended December 31, 2021 are as follows:
| 2020 | Cash Flows | Foreign Exchange |
Mark-to- Market |
Interest Expense |
New Leases |
Other | 2021 | |||||||||||||||||||||||||
| Borrowings |
$ | 466,001 | $ | (73,764 | ) | $ | (29,782 | ) | $ | | $ | 19,755 | $ | | $ | 486 | $ | 382,696 | ||||||||||||||
| Lease liabilities |
49,263 | (16,602 | ) | | | 2,092 | 19,249 | (61 | ) | 53,941 | ||||||||||||||||||||||
|
|
|
|
|
|
|
|
|
|
|
|
|
|
|
|
|
|||||||||||||||||
| Changes in liabilities |
515,264 | (90,366 | ) | (29,782 | ) | | 21,847 | 19,249 | 425 | 436,637 | ||||||||||||||||||||||
| Derivative financial instruments |
(16,734 | ) | 6,528 | | 27,083 | | | | 16,877 | |||||||||||||||||||||||
| Financial instrument collateral |
13,627 | (30,017 | ) | | | | | | (16,390 | ) | ||||||||||||||||||||||
|
|
|
|
|
|
|
|
|
|
|
|
|
|
|
|
|
|||||||||||||||||
| Other financing activities |
(3,107 | ) | (23,489 | ) | | 27,083 | | | | 487 | ||||||||||||||||||||||
|
|
|
|
|
|
|
|
|
|
|
|
|
|
|
|
|
|||||||||||||||||
| Total liabilities arising from financing activities |
$ | 512,157 | $ | (113,855 | ) | $ | (29,782 | ) | $ | 27,083 | $ | 21,847 | $ | 19,249 | $ | 425 | $ | 437,124 | ||||||||||||||
|
|
|
|
|
|
|
|
|
|
|
|
|
|
|
|
|
|||||||||||||||||
F-49
Table of Contents
Titan America SA and Subsidiaries
Notes to Consolidated Financial Statements
December 31, 2023, 2022 and 2021
(All amounts in thousands)
19. Income taxes
The components of income tax expense for the years ended December 31, 2023, 2022 and 2021 are as follows:
| 2023 | 2022 | 2021 | ||||||||||
| Current income tax: |
||||||||||||
| Current income tax expense |
$ | 45,536 | $ | 8,069 | $ | 2,568 | ||||||
| Adjustments in respect of previous years |
| | | |||||||||
| Deferred income tax: |
||||||||||||
| Deferred tax expense relating to origination and reversal of temporary differences |
1,598 | 10,523 | 12,768 | |||||||||
| Adjustments in respect of previous years |
| (1,621 | ) | | ||||||||
|
|
|
|
|
|
|
|||||||
| Income tax expense |
$ | 47,134 | $ | 16,971 | $ | 15,336 | ||||||
|
|
|
|
|
|
|
|||||||
The income before income tax of the Company is taxed at the applicable rate corresponding to the country in which it operates. The local income tax rates vary, thus resulting in corresponding tax rate differentials. The Company has determined the applicable tax rate to be 22% for the periods presented below. Income tax expense differs from the amounts computed by applying the applicable tax rate to income before income taxes as a result of the following:
| 2023 | 2022 | 2021 | ||||||||||
| Income before income taxes |
$ | 202,378 | $ | 79,692 | $ | 74,557 | ||||||
| Income tax expense at applicable statutory Greek Federal tax rate, 22% |
44,523 | 17,532 | 16,403 | |||||||||
| Differences resulting from: |
||||||||||||
| Foreign tax rate differences |
(502 | ) | (295 | ) | (968 | ) | ||||||
| State income taxes, net of federal tax effect |
8,092 | 2,460 | 2,572 | |||||||||
| Mineral deposit depletion |
(5,128 | ) | (3,422 | ) | (3,557 | ) | ||||||
| Other |
149 | 696 | 886 | |||||||||
|
|
|
|
|
|
|
|||||||
| Income tax expense at the effective tax rate of 23%, 21% and 21% respectively |
$ | 47,134 | $ | 16,971 | $ | 15,336 | ||||||
|
|
|
|
|
|
|
|||||||
The effective tax rate differs from the applicable tax rate primarily due to tax rate differences in jurisdictions outside of the Companys domicile, various permanent differences and local country state income taxes.
F-50
Table of Contents
Titan America SA and Subsidiaries
Notes to Consolidated Financial Statements
December 31, 2023, 2022 and 2021
(All amounts in thousands)
19. Income taxes (continued)
Deferred income taxes consist of the following as December 31, 2023 and December 31, 2022:
| 2023 | 2022 | |||||||
| Deferred tax assets: |
||||||||
| Provisions and accrued expenses |
$ | 21,138 | $ | 16,079 | ||||
| Lease liabilities |
17,352 | 17,602 | ||||||
| Accounts receivable valuation |
2,814 | 2,852 | ||||||
| Inventory valuation and costing |
1,781 | 1,478 | ||||||
| Retirement benefit obligations |
1,142 | 1,153 | ||||||
| Unrealized loss on derivative instruments |
828 | 3,597 | ||||||
| Other |
3,136 | 3,848 | ||||||
|
|
|
|
|
|||||
| Total deferred tax assets |
48,191 | 46,609 | ||||||
| Deferred tax liabilities: |
||||||||
| Property, plant and equipment |
47,677 | 42,213 | ||||||
| Goodwill |
45,920 | 45,918 | ||||||
| Mineral deposits |
19,492 | 19,208 | ||||||
| Right-of-use assets |
16,282 | 16,343 | ||||||
| Intangible assets |
3,262 | 3,261 | ||||||
| Other |
9,935 | 12,608 | ||||||
|
|
|
|
|
|||||
| Deferred tax liabilities |
142,568 | 139,551 | ||||||
|
|
|
|
|
|||||
| Net deferred income tax liability |
$ | 94,377 | $ | 92,942 | ||||
|
|
|
|
|
|||||
As of December 31, 2023 and 2022, the Company had state net operating loss (NOL) carryforwards of $911 and $8,585, respectively, with various expiration dates based on statutory law. As of December 31, 2023 and 2022, the Company had interest expense limitation carryforwards of $0 and $6,469, respectively, with various expiration dates based on statutory law.
As of December 31, 2023, the Company plans to repatriate all undistributed international earnings, unless it is not tax effective to repatriate. It is not practicable to estimate the amount of deferred tax liability arising from investments in subsidiaries.
As of December 31, 2023, and 2022, there was no gross liability for unrecorded tax benefits. The Company is subject to income tax in Greece and the United States. Tax years prior to December 31, 2020 are no longer open to examination by the taxing authorities.
Effective April 2, 2024, the Greek parliament substantively enacted Pillar Two minimum effective tax rate of 15% for multinational enterprises and large-scale domestic groups with consolidated annual revenues exceeding 750m in Greek law. The Pillar Two legislation will be effective for the Companys financial year beginning January 1, 2024, as the Company is a group with a Belgian ultimate parent entity. Since the Pillar Two legislation was not effective at the reporting date, the Company has no related current tax exposure. For financial years beginning January 1, 2024, the Company might be liable to pay a top-up tax for the difference between the global minimum tax rate of 15% and the Companys defined effective tax rate under Pillar Two. The Company believes it qualifies for one of the transitional safe harbors provided in the rules in all territories in which it operates that have enacted Pillar Two legislation. Therefore, the Company does not anticipate a material impact from Pillar Two legislation in the near future. The Company has applied the recent amendment to IAS 12 which provides temporary relief to the recognition of deferred taxes related to top-up income taxes. Accordingly, the legislation did not impact the Companys taxes in 2023.
F-51
Table of Contents
Titan America SA and Subsidiaries
Notes to Consolidated Financial Statements
December 31, 2023, 2022 and 2021
(All amounts in thousands)
20. Retirement Benefit Obligations
Retirement benefit obligations at December 31, 2023 and 2022, consist of the following:
| 2023 | 2022 | |||||||
| Non-qualified deferred compensation plan |
$ | 3,386 | $ | 2,896 | ||||
| Pension benefits |
(207 | ) | 359 | |||||
| Other post-retirement benefits |
1,131 | 1,097 | ||||||
|
|
|
|
|
|||||
| Retirement benefit obligations |
$ | 4,310 | $ | 4,352 | ||||
|
|
|
|
|
|||||
Defined benefit plans
The Company operates a defined benefit pension plan and other post-retirement benefit plans. The method of accounting for the latter, as well as the valuation assumptions and the frequency of valuations, are similar to those used for the defined benefit pension plan.
The defined benefit pension plan and all but one of the other post-retirement benefit plans have been frozen for new participants and credited service. One post-retirement benefit plan exists (for certain active and former employees) whereby eligible retirees receive benefits consisting primarily of assistance with medical insurance costs between the dates of early retirement and Medicare eligibility.
At December 31, 2023, the defined benefit pension plan assets are invested 95% in fixed income investments (2022: 43%), 5% in other various investments (2022: 0%), 0% in equity investments (2022: 57%). The discount rate adopted for the study of the pension plans was 4.84% at December 31, 2023 (5.13% at December 31, 2022).
In 2024 there is no contribution due under the minimum requirement of the Employee Retirement Income Security Act of 1974 (ERISA). As a result, the Company does not expect to contribute to its defined benefit pension plans in 2024. The Companys other post-retirement benefit plans are unfunded obligations and will be funded, consistent with past practice, on a pay-as-you-go basis.
Defined contribution plans
The Company sponsors a defined contribution retirement and 401(k) savings plan, which covers substantially all employees of the Company. The plan provides for voluntary employee pre-tax and after-tax contributions for eligible employees. The Company matches 50% of eligible employees contributions up to 8% of the employees eligible wages, subject to IRS limitations on maximum elective deferrals. Total costs charged against income for this element of the plan was $6,421, $5,860, and $5,294 for the years ended December 31, 2023, 2022, and 2021, respectively. Additionally, the Company recognized income from 401k match forfeitures of $792, $245 and $371 for the years ended December 31, 2023, 2022 and 2021 respectively.
F-52
Table of Contents
Titan America SA and Subsidiaries
Notes to Consolidated Financial Statements
December 31, 2023, 2022 and 2021
(All amounts in thousands)
20. Retirement Benefit Obligations (continued)
Information about the Companys defined benefit pension and other post-retirement benefit plans is presented below:
| Pension Benefits | Other Post-retirement Benefits |
|||||||||||||||||||||||
| 2023 | 2022 | 2021 | 2023 | 2022 | 2021 | |||||||||||||||||||
| Benefit obligations |
$ | 10,294 | $ | 10,594 | $ | 13,851 | $ | 1,131 | $ | 1,097 | $ | 1,405 | ||||||||||||
| Fair value of plan assets |
10,501 | 10,235 | 13,434 | | | | ||||||||||||||||||
|
|
|
|
|
|
|
|
|
|
|
|
|
|||||||||||||
| Accrued (gain)/cost, December 31 |
$ | (207 | ) | $ | 359 | $ | 417 | $ | 1,131 | $ | 1,097 | $ | 1,405 | |||||||||||
|
|
|
|
|
|
|
|
|
|
|
|
|
|||||||||||||
Changes in the present value of the defined benefit obligations for the years ended December 31, 2023 and 2022 are as follows:
| Pension Benefits | Other Post-retirement Benefits |
|||||||||||||||
| 2023 | 2022 | 2023 | 2022 | |||||||||||||
| Benefit obligations, January 1 |
$ | 10,594 | $ | 13,851 | $ | 1,097 | $ | 1,405 | ||||||||
| Service cost |
| | 3 | 4 | ||||||||||||
| Interest cost |
502 | 332 | 53 | 35 | ||||||||||||
| Benefits paid |
(860 | ) | (855 | ) | (72 | ) | (41 | ) | ||||||||
| Actuarial (gain)/loss |
58 | (2,734 | ) | 50 | (306 | ) | ||||||||||
|
|
|
|
|
|
|
|
|
|||||||||
| Benefit obligations, December 31 |
$ | 10,294 | $ | 10,594 | $ | 1,131 | $ | 1,097 | ||||||||
|
|
|
|
|
|
|
|
|
|||||||||
| Discount rate used in computing ending obligations |
4.84 | % | 5.13 | % | 4.84 | % | 5.13 | % | ||||||||
The following rates of increase in the cost of covered health care benefits was assumed:
|
Other Post-retirement Benefits |
||||||||
| 2023 | 2022 | |||||||
| Health care cost trend rate: |
||||||||
| 2022 |
N/A | 6.3 | % | |||||
| 2023 |
6.0 | % | 6.0 | % | ||||
| 2024 |
5.5 | % | 5.5 | % | ||||
| 2025 |
5.3 | % | 5.3 | % | ||||
| 2026 |
4.8 | % | 4.8 | % | ||||
| 2027 and thereafter |
4.5 | % | 4.5 | % | ||||
F-53
Table of Contents
Titan America SA and Subsidiaries
Notes to Consolidated Financial Statements
December 31, 2023, 2022 and 2021
(All amounts in thousands)
20. Retirement Benefit Obligations (continued)
Changes in the fair value of plan assets for the years ended December 31, 2023 and 2022 are as follows:
| Pension Benefits | Other Post-retirement Benefits |
|||||||||||||||
| 2023 | 2022 | 2023 | 2022 | |||||||||||||
| Fair value of plan assets, January 1 |
$ | 10,235 | $ | 13,434 | $ | | $ | | ||||||||
| Return on plan assets |
1,405 | (2,175 | ) | | | |||||||||||
| Contributions |
| | 72 | 41 | ||||||||||||
| Administrative expenses |
(279 | ) | (169 | ) | | | ||||||||||
| Benefits paid |
(860 | ) | (855 | ) | (72 | ) | (41 | ) | ||||||||
|
|
|
|
|
|
|
|
|
|||||||||
| Fair value of plan assets, December 31 |
$ | 10,501 | $ | 10,235 | $ | | $ | | ||||||||
|
|
|
|
|
|
|
|
|
|||||||||
The estimated future benefit payments at December 31, 2023, 2022 and 2021 are as follows:
| Pension Benefits | Other Post-retirement Benefits |
|||||||||||||||||||||||
| 2023 | 2022 | 2021 | 2023 | 2022 | 2021 | |||||||||||||||||||
| Year 1 |
$ | 1,368 | $ | 956 | $ | 1,357 | $ | 113 | $ | 103 | $ | 97 | ||||||||||||
| Year 2 |
919 | 948 | 973 | 102 | 108 | 104 | ||||||||||||||||||
| Year 3 |
896 | 926 | 964 | 99 | 111 | 109 | ||||||||||||||||||
| Year 4 |
869 | 904 | 940 | 101 | 92 | 111 | ||||||||||||||||||
| Year 5 |
833 | 877 | 918 | 96 | 94 | 91 | ||||||||||||||||||
| Years 6-10 |
3,736 | 3,924 | 4,131 | 405 | 409 | 459 | ||||||||||||||||||
| Years 10+ |
7,189 | 7,917 | 8,706 | 688 | 715 | 828 | ||||||||||||||||||
|
|
|
|
|
|
|
|
|
|
|
|
|
|||||||||||||
| $ | 15,810 | $ | 16,452 | $ | 17,989 | $ | 1,604 | $ | 1,632 | $ | 1,799 | |||||||||||||
|
|
|
|
|
|
|
|
|
|
|
|
|
|||||||||||||
Movements in the net pension and other post-retirement benefit liabilities during the years ended 2023, 2022 and 2021 are as follows:
| Pension Benefits | Other Post-retirement Benefits |
|||||||||||||||||||||||
| 2023 | 2022 | 2021 | 2023 | 2022 | 2021 | |||||||||||||||||||
| Accrued cost, January 1 |
$ | 359 | $ | 417 | $ | 1,919 | $ | 1,097 | $ | 1,405 | $ | 1,497 | ||||||||||||
| Expense recognized in the income statement |
290 | 174 | 226 | 56 | 39 | 37 | ||||||||||||||||||
| Amount recognized as other comprehensive (income)/loss |
(856 | ) | (232 | ) | (1,256 | ) | 50 | (306 | ) | (35 | ) | |||||||||||||
| Contributions |
| | (472 | ) | (72 | ) | (41 | ) | (94 | ) | ||||||||||||||
|
|
|
|
|
|
|
|
|
|
|
|
|
|||||||||||||
| Accrued (gain)/loss, December 31 |
$ | (207 | ) | $ | 359 | $ | 417 | $ | 1,131 | $ | 1,097 | $ | 1,405 | |||||||||||
|
|
|
|
|
|
|
|
|
|
|
|
|
|||||||||||||
F-54
Table of Contents
Titan America SA and Subsidiaries
Notes to Consolidated Financial Statements
December 31, 2023, 2022 and 2021
(All amounts in thousands)
20. Retirement Benefit Obligations (continued)
The components of net periodic pension and other post-retirement benefit costs for the years ended December 31, 2023, 2022 and 2021 are as follows:
| Pension Benefits | Other Post-retirement Benefits |
|||||||||||||||||||||||
| 2023 | 2022 | 2021 | 2023 | 2022 | 2021 | |||||||||||||||||||
| Service cost |
$ | | $ | | $ | | $ | 3 | $ | 4 | $ | 4 | ||||||||||||
| Administrative expenses |
279 | 170 | 190 | | | | ||||||||||||||||||
| Net interest cost |
11 | 4 | 36 | 53 | 35 | 33 | ||||||||||||||||||
|
|
|
|
|
|
|
|
|
|
|
|
|
|||||||||||||
| Net periodic pension expense |
290 | 174 | 226 | 56 | 39 | 37 | ||||||||||||||||||
| Other comprehensive (income)/loss |
(856 | ) | (232 | ) | (1,256 | ) | 50 | (306 | ) | (35 | ) | |||||||||||||
|
|
|
|
|
|
|
|
|
|
|
|
|
|||||||||||||
| Total comprehensive (income)/loss |
$ | (566 | ) | $ | (58 | ) | $ | (1,030 | ) | $ | 106 | $ | (267 | ) | $ | 2 | ||||||||
|
|
|
|
|
|
|
|
|
|
|
|
|
|||||||||||||
The amounts recorded in other comprehensive (income)/loss for the years ended December 31, 2023, 2022 and 2021 are as follows:
| 2023 | 2022 | 2021 | ||||||||||
| Cost of goods sold |
$ | 282 | $ | 174 | $ | 194 | ||||||
| Finance cost |
64 | 39 | 69 | |||||||||
|
|
|
|
|
|
|
|||||||
| Net periodic expense |
346 | 213 | 263 | |||||||||
| Other comprehensive (income) |
(806 | ) | (538 | ) | (1,291 | ) | ||||||
|
|
|
|
|
|
|
|||||||
| Comprehensive (income)/loss |
$ | (460 | ) | $ | (325 | ) | $ | (1,028 | ) | |||
|
|
|
|
|
|
|
|||||||
The components of actuarial (gains)/losses included in other comprehensive (income)/loss for the years ended December 31, 2023, 2022 and 2021 are as follows:
| 2023 | 2022 | 2021 | ||||||||||
| Asset (gain)/loss |
$ | (914 | ) | $ | 2,503 | $ | (1,078 | ) | ||||
| Demographic loss/(gain) |
(160 | ) | (243 | ) | 157 | |||||||
| Assumption (gain)/loss |
268 | (2,798 | ) | (370 | ) | |||||||
|
|
|
|
|
|
|
|||||||
| Total actuarial gain |
$ | (806 | ) | $ | (538 | ) | $ | (1,291 | ) | |||
|
|
|
|
|
|
|
|||||||
F-55
Table of Contents
Titan America SA and Subsidiaries
Notes to Consolidated Financial Statements
December 31, 2023, 2022 and 2021
(All amounts in thousands)
20. Retirement Benefit Obligations (continued)
A one percentage point change in the assumed rate of increase in healthcare costs would have the following effects:
| Increase | Decrease | |||||||
| 2023 |
||||||||
| Effect on the aggregate current service cost and interest cost |
$ | 3 | $ | (3 | ) | |||
| Effect on other post-retirement benefit obligations |
$ | 72 | $ | (64 | ) | |||
| 2022 |
||||||||
| Effect on the aggregate current service cost and interest cost |
$ | 2 | $ | (2 | ) | |||
| Effect on other post-retirement benefit obligations |
$ | 70 | $ | (62 | ) | |||
| 2021 |
||||||||
| Effect on the aggregate current service cost and interest cost |
$ | 2 | $ | (2 | ) | |||
| Effect on other post-retirement benefit obligations |
$ | 100 | $ | (88 | ) | |||
A one percentage point change in the assumed discount rate would have the following effects:
| Increase | Decrease | |||||||
| 2023 |
||||||||
| Effect on the aggregate current service cost and interest cost |
$ | 6 | $ | (7 | ) | |||
| Effect on pension and other post-retirement benefit obligations |
$ | (782 | ) | $ | 902 | |||
| 2022 |
||||||||
| Effect on the aggregate current service cost and interest cost |
$ | 9 | $ | (11 | ) | |||
| Effect on pension and other post-retirement benefit obligations |
$ | (809 | ) | $ | 934 | |||
| 2021 |
||||||||
| Effect on the aggregate current service cost and interest cost |
$ | 10 | $ | (12 | ) | |||
| Effect on pension and other post-retirement benefit obligations |
$ | (1,309 | ) | $ | 1,523 | |||
21. Provisions
The components of provisions at December 31, 2023 are as follows:
| Income Statement Charges | ||||||||||||||||||||||||||||
| Provision Description |
Balance at 12/31/22 |
Operating Expenses |
Finance Cost |
Cash Payments |
Other Adjustments |
Balance at 12/31/23 |
||||||||||||||||||||||
| Restoration obligations |
a | $ | 10,884 | $ | 1,921 | $ | 464 | $ | | $ | 4,406 | $ | 17,675 | |||||||||||||||
| Environmental |
a | 1,187 | 1,888 | 40 | (28 | ) | | 3,087 | ||||||||||||||||||||
| Equipment removal |
a | 9,235 | (215 | ) | 331 | (95 | ) | 3,900 | 13,156 | |||||||||||||||||||
| Insurance reserves |
b | 21,385 | 38,448 | 878 | (35,721 | ) | | 24,990 | ||||||||||||||||||||
| Lease return obligations |
c | 4,497 | 317 | 100 | | 1,574 | 6,488 | |||||||||||||||||||||
| Sales and use tax |
d | 538 | (180 | ) | | | | 358 | ||||||||||||||||||||
|
|
|
|
|
|
|
|
|
|
|
|
|
|||||||||||||||||
| Total |
$ | 47,726 | $ | 42,179 | $ | 1,813 | $ | (35,844 | ) | $ | 9,880 | $ | 65,754 | |||||||||||||||
|
|
|
|
|
|
|
|
|
|
|
|
|
|||||||||||||||||
F-56
Table of Contents
Titan America SA and Subsidiaries
Notes to Consolidated Financial Statements
December 31, 2023, 2022 and 2021
(All amounts in thousands)
21. Provisions (continued)
The components of provisions at December 31, 2022 are as follows:
| Income Statement Charges | ||||||||||||||||||||||||||||
| Provision Description |
Balance at 12/31/21 |
Operating Expenses |
Finance Cost |
Cash Payments |
Other Adjustments |
Balance at 12/31/22 |
||||||||||||||||||||||
| Restoration obligations |
a | $ | 12,001 | $ | (1,188 | ) | $ | 165 | $ | (181 | ) | $ | 87 | 10,884 | ||||||||||||||
| Environmental |
a | 2,126 | (972 | ) | 43 | (10 | ) | | 1,187 | |||||||||||||||||||
| Equipment removal |
a | 10,296 | (413 | ) | 221 | (115 | ) | (754 | ) | 9,235 | ||||||||||||||||||
| Insurance Reserves |
b | 19,584 | 40,461 | 434 | (39,781 | ) | 687 | 21,385 | ||||||||||||||||||||
| Lease return obligations |
c | | | 113 | | 4,384 | 4,497 | |||||||||||||||||||||
| Sales and use tax |
d | 700 | (162 | ) | | | | 538 | ||||||||||||||||||||
| Severance |
21 | (21 | ) | | | | | |||||||||||||||||||||
|
|
|
|
|
|
|
|
|
|
|
|
|
|||||||||||||||||
| Total |
$ | 44,728 | $ | 37,705 | $ | 976 | $ | (40,087 | ) | $ | 4,404 | $ | 47,726 | |||||||||||||||
|
|
|
|
|
|
|
|
|
|
|
|
|
|||||||||||||||||
| a. | These provisions represent the present value of the estimated costs to reclaim quarry sites and other similar post-closure obligations for owned and leased properties. It is expected that this amount will be used over the next 2 to 50 years. The Company estimates its ultimate liability using detailed engineering calculations that consider the amount and timing of the future cash flows. Future cash flows are determined by applying inflation rates to the estimated current cost of reclamation. The present value of these future cash flows is determined by applying discount rates consistent with the time horizons of the expected future cash flow. Discount rates are based on U.S. treasury bonds with maturities similar to the duration of the obligation. |
An annual review of restoration, environmental and equipment removal liabilities are conducted by plant management and environmental teams and is focused on estimated costs, updated regulations, and changes in contractual obligations. More technical quarry and sand mine reclamation evaluations are performed periodically and include a precise evaluation of quarry conditions, exploration of new technologies and consultation with third-party experts. During 2023, the Company increased these obligations by $9,512 as a result of updated costs estimates to reclaim quarry sites and other similar post-closure obligations for owned and leased properties.
| b. | This provision represents the expected costs of claims payments related to risk and workers compensation claims, in addition to Company sponsored health insurance costs. |
| c. | This provision represents the amount of expected costs to bring lease equipment to return conditions and/or locations required in lease agreement. |
| d. | This provision represents the amount of expected settlements for sales and use tax audits in states where the Company operates. It is expected that this amount will be utilized within 2 to 5 years. |
During the years ended December 31, 2023, 2022, and 2021, the Company increased provisions by the net amounts of $1,813, $976 and $324, respectively, due to the passage of time. Accretion is included in finance cost in the Consolidated Statements of Income.
F-57
Table of Contents
Titan America SA and Subsidiaries
Notes to Consolidated Financial Statements
December 31, 2023, 2022 and 2021
(All amounts in thousands)
21. Provisions (continued)
The current and non-current portions of the total provisions are follows:
| 2023 | 2022 | |||||||
| Current portion of provisions |
$ | 10,452 | $ | 8,989 | ||||
| Non-current portion of provisions |
55,302 | 38,737 | ||||||
|
|
|
|
|
|||||
| Total |
$ | 65,754 | $ | 47,726 | ||||
|
|
|
|
|
|||||
22. Accrued expenses
The components of accrued expenses at December 31, 2023 and 2022 are as follows:
| 2023 | 2022 | |||||||
| Employee compensation and benefits |
$ | 12,991 | $ | 12,632 | ||||
| Customer rebates |
3,621 | 3,279 | ||||||
| Taxes payable, other than income taxes |
2,114 | 8,744 | ||||||
| Accrued royalties and dues |
1,210 | 867 | ||||||
| Professional fees |
601 | 489 | ||||||
| Other |
220 | 2,215 | ||||||
|
|
|
|
|
|||||
| Total accrued expenses |
$ | 20,757 | $ | 28,226 | ||||
|
|
|
|
|
|||||
23. Related Party Transactions
The following is a summary of the transactions that were carried out with related parties during 2023:
| Purchases and charges from related parties |
Amounts owed to related parties, net |
|||||||
| Financing (Note 18) |
$ | 11,391 | $ | 342,857 | ||||
| Purchase of cement |
107,122 | 6,281 | ||||||
| Management fee |
11,043 | 3,659 | ||||||
| Other |
2,621 | 1,527 | ||||||
|
|
|
|
|
|||||
| $ | 132,177 | $ | 354,324 | |||||
|
|
|
|
|
|||||
The following is a summary of the transactions that were carried out with related parties during 2022:
| Purchases and charges from related parties |
Amounts owed to related parties, net |
|||||||
| Financing (Note 18) |
$ | 17,550 | $ | 322,638 | ||||
| Purchase of cement |
84,193 | 4,604 | ||||||
| Management fee |
9,555 | 3,283 | ||||||
| Other |
3,294 | 1,472 | ||||||
|
|
|
|
|
|||||
| $ | 114,592 | $ | 331,997 | |||||
|
|
|
|
|
|||||
F-58
Table of Contents
Titan America SA and Subsidiaries
Notes to Consolidated Financial Statements
December 31, 2023, 2022 and 2021
(All amounts in thousands)
23. Related Party Transactions (continued)
The following is a summary of the transactions that were carried out with related parties during 2021:
| Purchases and charges from related parties |
Amounts owed to related parties, net |
|||||||
| Financing (Note 18) |
$ | 15,040 | $ | 343,787 | ||||
| Purchase of cement |
70,347 | 1,147 | ||||||
| Management fee |
7,729 | 3,766 | ||||||
| Other |
1,803 | 2,047 | ||||||
|
|
|
|
|
|||||
| $ | 94,919 | $ | 350,747 | |||||
|
|
|
|
|
|||||
Outstanding balances at the year-end related to purchases from related parties are unsecured and interest free and settlement occurs in cash. There have been no guarantees provided or received for any related party receivables or payables.
Dividends/Return of capital
During 2023, Titan Atlantic declared a dividend to TCI on October 19, 2023 of 32,000 ($33,786 equivalent) which was paid on October 20, 2023. During 2022 and 2021, Titan Atlantic did not declare any dividends to TCI.
During 2023 and 2022, Titan Atlantic did not declare any returns of capital to TCI. On April 8, 2021, Titan Atlantic declared and subsequently paid a return of capital of $82,372 (69,378 Euro equivalent) to TCI. On this same date Titan Atlantic capitalized, into common stock, share premium of $82,784 (69,725 Euro equivalent) resulting in $911 (767 Euro equivalent) of Greek federal tax.
Key Management Compensation
Key management compensation expense, which includes all payroll-related expenses for vice-president level positions and higher for the years ended December 31, 2023, 2022, and 2021 is as follows:
| 2023 | 2022 | 2021 | ||||||||||
| Salaries and related payroll taxes |
$ | 11,518 | $ | 10,191 | $ | 9,638 | ||||||
| Short-term employee benefits |
683 | 579 | 487 | |||||||||
| Retirement plan contributions |
235 | 214 | 202 | |||||||||
| Long-term incentives, including share-based payments |
2,577 | 1,947 | 2,214 | |||||||||
| Termination benefits |
| | 145 | |||||||||
| Other |
291 | 155 | 190 | |||||||||
|
|
|
|
|
|
|
|||||||
| Total key management compensation |
$ | 15,304 | $ | 13,086 | $ | 12,876 | ||||||
|
|
|
|
|
|
|
|||||||
| Number of key management employees at December 31 |
25 | 24 | 19 | |||||||||
F-59
Table of Contents
Titan America SA and Subsidiaries
Notes to Consolidated Financial Statements
December 31, 2023, 2022 and 2021
(All amounts in thousands)
23. Related Party Transactions (continued)
Restricted Stock Incentive Plan
Prior to 2020, TCI granted stock options under a Restricted Stock Incentive Plan to certain members of senior management and other employees of TCI and its subsidiaries, including the Company. Under this plan, participants were granted options, the exercise of which was subject to the financial results of TCI and the performance of its common share vs. a peer group. After completion of a three-year vesting period, the final vesting percentage for the options grant was determined by reference to:
| | TCIs average three-year Return on Average Capital compared to the target of the period (50% weighting); and |
| | the overall performance of TCIs common share compared to the average overall performance of the shares of a pre-defined group of international cement producers (50% weighting). |
The Beneficiaries were entitled to exercise their stock option rights, either in whole or in part, within the first five working days of each month, paying the Company the required amounts until the expiration date of their stock options. The fair value of the options granted under the plan was determined using the Binomial Method and the Monte Carlo Simulation valuation model.
All stock options issued under the Restricted Stock Incentive Plan were vested and released prior to 2022. As a result, no expense amounts were recognized in 2023 or 2022 and $381 was recognized in 2021.
Movements in the number of share options outstanding for the years ended December 31, 2023, 2022 and 2021 are as follows:
| 2023 | 2022 | 2021 | ||||||||||
| Shares under option, January 1 |
43 | 206 | 353 | |||||||||
| Exercised |
(34 | ) | (20 | ) | (57 | ) | ||||||
| Expired/cancelled |
(9 | ) | (143 | ) | (90 | ) | ||||||
|
|
|
|
|
|
|
|||||||
| Shares under option, December 31 |
| 43 | 206 | |||||||||
|
|
|
|
|
|
|
|||||||
| Options exercisable, December 31 |
| 44 | 12 | |||||||||
|
|
|
|
|
|
|
|||||||
Long-Term Incentive Plan
TCI maintains a Long-Term Incentive Plan (LTIP) for certain employees of TCI and its subsidiaries, including the Company. Participants in the plan are awarded a conditional grant of TCI shadow shares at no consideration in April (or later) of each year. (see Note 1.14).
At each reporting date until vesting, the Company calculates a best estimate of the cumulative expense to be recognized in relation to each LTIP award at that date, being the product of:
| | the fair value of the award at grant date; |
| | the number of awards that will vest (best estimate); and |
| | the expired portion of the vesting period. |
The charge to the Consolidated Statements of Income for the period is the cumulative amount calculated above less the amounts already charged in previous periods. In the year of vesting any difference between the equity-settled value and the cash-settled value is recharged or credited by TCI and is recorded in retained earnings.
F-60
Table of Contents
Titan America SA and Subsidiaries
Notes to Consolidated Financial Statements
December 31, 2023, 2022 and 2021
(All amounts in thousands)
23. Related Party Transactions (continued)
For the years ended December 31, 2023, 2022, and 2021, $3,147, $2,104, and $1,667 respectively, was recorded as general and administrative expense in the Consolidated Statements of Income related to vested LTIP awards.
During 2023, the Company was recharged $1,762 by TCI for the LTIP. Of this, $1,333, representing an amount equal to the capital contribution and expense recognized during the vesting period of the awards, was returned to TCI and has been included within cash flows from operating activities in the Consolidated Statement of Cash Flows. The remaining $429, representing the excess of the capital contribution and expense recognized during the vesting period of the awards, was treated as a distribution from the Company to TCI and has been included in cash flows from financing activities in the Consolidated Statement of Cash Flows. There was no recharge from TCI for the LTIP in 2022 or 2021.
Movements in the number of shadow shares outstanding for the years ended December 31, 2023, 2022 and 2021 are as follows:
| 2023 | 2022 | 2021 | ||||||||||
| Shadow shares outstanding, January 1 |
653 | 423 | 240 | |||||||||
| Granted |
260 | 249 | 188 | |||||||||
| Vested and distributed |
(113 | ) | | | ||||||||
| Cancelled |
(16 | ) | (19 | ) | (5 | ) | ||||||
|
|
|
|
|
|
|
|||||||
| Shadow shares outstanding, December 31 |
784 | 653 | 423 | |||||||||
|
|
|
|
|
|
|
|||||||
| Fair value of awards granted in year ( per share) |
| 14.64 | | 11.90 | | 17.14 | ||||||
| Fair value of awards granted in year ($ per share) |
$ | 16.08 | $ | 12.39 | $ | 20.71 | ||||||
The fair value of the award represents the closing price of TCI shares in Euronext Brussels on the date of the related Annual General Meeting of Shareholders for TCI corresponding to the grant year.
The stock price of TCIs common share was 21.25 ($23.48) at December 31, 2023, 12.00 ($12.80) at December 31, 2022 and 13.26 ($15.02) at December 31, 2021.
24. Commitments and Contingencies
Litigation
On the basis of its own estimates (and both internal and external legal counsel), Management is of the opinion that its remote that material losses will be incurred in respect of claims in excess of provisions that have been made in these consolidated financial statements.
Environmental remediation
The Company is subject to certain environmental regulations and normal business operations may cause conditions requiring remedial action. Management has provided for all known, probable and estimable costs related to such occurrences. See Note 21 for further information about restoration, environmental and remediation provisions.
F-61
Table of Contents
Titan America SA and Subsidiaries
Notes to Consolidated Financial Statements
December 31, 2023, 2022 and 2021
(All amounts in thousands)
24. Commitments and Contingencies (continued)
Purchase commitments
The Company has contracted to purchase raw materials and energy as part of its ongoing operations as follows:
Aggregates purchase commitment
In 2004, the Company entered into a supply agreement with a third party for the purchase of construction aggregates in Florida. The supply agreement contained various provisions including minimum annual volume guarantees and, in certain circumstances, prepayment obligations. Subsequent amendments modified the original agreement and a 2012 amendment replaced the annual volume guarantees with an overall purchase commitment of approximately 12,100 tons over a 20-year term commencing November 1, 2012. Provisions of the amended agreement includes a 500-ton minimum annual volume and a maximum annual volume of no more than 2,400 tons. In addition, the 2012 amendment eliminated all future prepayment obligations.
In 2023, 2022 and 2021, the Company accepted delivery of approximately 985, 871 and 628 tons of construction aggregates from the supplier, respectively. The remaining commitment under the supply agreement is 4,804 and 5,789 tons at December 31, 2023 and December 31, 2022, respectively. Under the terms of the supply agreement, purchases are made at current market prices, subject to periodic adjustments. For the annual periods ended December 31, 2023, 2022 and 2021, prices, excluding taxes and fees, are $21.05, $15.50 and $14.00 per ton, respectively.
Natural gas purchase commitment
In 2019, the Company entered into a natural gas supply agreement for its cement plant in Florida. After completion of the requisite infrastructure upgrades, the plant began consuming natural gas in November 2020. A take-or-pay agreement with the utility company requires payments of $11,600 over a maximum period of 6 years. Until fully satisfied this agreement requires, and the Company has met, minimum cumulative payments equal to $1,935 per contract year. On December 31, 2023, the Company had paid $8,390 (December 31, 2022: $5,457; December 31, 2021: $2,425) cumulatively under the agreement.
In conjunction with the aforementioned take-or-pay natural gas agreement, the Company also entered into capacity supply agreements with a natural gas marketer annually since 2020. On December 31, 2023, there are 910 MMBtus of committed capacity remaining through March 2024. Pricing under the capacity contract is based on the front-month Florida Gas Transmission Zone 3 natural gas price settlements, plus a variable basis component.
Office lease
In June 2023, the Company signed a 11 year and 7 month lease for new office space in Deerfield, Florida. The expected lease commencement date is July 2024 with an initial expected lease liability of $7,800. Lease payments exclude variable operating expenses which will be expensed as incurred. The lease payments are subject to an annual 3% increase and include two five-year renewal options with lease payments determined at fair market value (FMV) as such time of each renewal. the Company has concluded these renewal options are not reasonably certain and therefore are excluded from the initial valuation of the expected lease liability.
F-62
Table of Contents
Titan America SA and Subsidiaries
Notes to Consolidated Financial Statements
December 31, 2023, 2022 and 2021
(All amounts in thousands)
24. Commitments and Contingencies (continued)
Supply commitments
The Company does not currently have any material contracted supply commitments.
25. Financial risk management objectives and policies
Financial Risk Factors
The Company, by nature of its business and treasury policies, is exposed to financial risks. The Companys overall financial risk policy aims to minimize potential unfavorable impacts arising from the markets fluctuations on the Companys financial performance. The Company does not engage in speculative transactions or transactions which are not related to its commercial, investing or borrowing activities.
Liquidity risk
Prudent liquidity risk management implies maintaining sufficient cash and cash equivalents, the availability of funding through an adequate amount of committed credit facilities and the ability to close out market positions. Due to the dynamic nature of the underlying businesses, the Company aims to maintain flexibility in funding by having both committed and uncommitted credit lines available.
The table below summarizes the maturity profile of financial liabilities at December 31, 2023 based on contractual undiscounted payments.
| Less than 6 months |
6 to 12 months |
1 to 5 years | >5 years | Total | ||||||||||||||||
| Loans from related parties |
$ | 4,676 | $ | 269,876 | $ | 80,457 | $ | | $ | 355,009 | ||||||||||
| Loans from third parties |
| | | | | |||||||||||||||
| Lease liabilities |
6,053 | 6,053 | 34,403 | 26,824 | 73,333 | |||||||||||||||
| Derivative financial instruments |
2,706 | 16,621 | | | 19,327 | |||||||||||||||
| Other non-current liabilities |
| | 114 | | 114 | |||||||||||||||
| Trade and other payables |
162,696 | | | | 162,696 | |||||||||||||||
|
|
|
|
|
|
|
|
|
|
|
|||||||||||
| $ | 176,131 | $ | 292,550 | $ | 114,974 | $ | 26,824 | $ | 610,479 | |||||||||||
|
|
|
|
|
|
|
|
|
|
|
|||||||||||
The table below summarizes the maturity profile of financial liabilities at December 31, 2022 based on contractual undiscounted payments.
| Less than 6 months |
6 to 12 months |
1 to 5 years | >5 years | Total | ||||||||||||||||
| Loans from related parties |
$ | 35,235 | $ | 5,002 | $ | 304,488 | $ | | $ | 344,725 | ||||||||||
| Loans from third parties |
70,000 | | | | 70,000 | |||||||||||||||
| Lease liabilities |
6,734 | 6,562 | 36,636 | 23,284 | 73,216 | |||||||||||||||
| Derivative financial instruments |
2,684 | 2,740 | 19,327 | | 24,751 | |||||||||||||||
| Other non-current liabilities |
| | 788 | | 788 | |||||||||||||||
| Trade and other payables |
184,727 | | | | 184,727 | |||||||||||||||
|
|
|
|
|
|
|
|
|
|
|
|||||||||||
| $ | 299,380 | $ | 14,304 | $ | 361,239 | $ | 23,284 | $ | 698,207 | |||||||||||
|
|
|
|
|
|
|
|
|
|
|
|||||||||||
F-63
Table of Contents
Titan America SA and Subsidiaries
Notes to Consolidated Financial Statements
December 31, 2023, 2022 and 2021
(All amounts in thousands)
25. Financial risk management objectives and policies (continued)
Foreign exchange risk
The majority of the Companys debt obligations are denominated in Euros. As a result, the Company is exposed to foreign currency exchange rate risk arising from the conversion of Euro loan proceeds to U.S. Dollars at the borrowing date and the related obligation to repay the loans in Euros at maturity. To manage this exposure, the Company may enter into derivative financial instruments to offset its exposure to fluctuations in the Euro/U.S. Dollar exchange rate during the life of the loans. These activities and the related account balances are further described in Note 9.
In addition to foreign exchange gains and losses arising from re-measurement of Euro denominated debt obligations to USD, the Company is exposed to foreign exchange gains and losses on Euro denominated interest obligations and other foreign currency denominated payables or receivables which are recorded in the Consolidated Statements of Income in one period and settled in another.
Derivatives
150,000 Cross-currency interest rate swap Economic Hedge
In August 2018, the Company entered into three 6-year cross-currency interest rate swap agreements with third party financial institutions to manage the foreign currency and interest rate risk associated with the fixed rate Euro denominated borrowing. Under the terms of those agreements, the counterparties fixed the November 16, 2024, U.S. Dollar to Euro exchange rate for the scheduled 150,000 repayment at $1.158867 to 1.00. In addition, over the life of the agreements, the Company will receive Euro denominated fixed rate interest on 150,000 and pay U.S. Dollar denominated fixed rate interest on $173,830.
Through the cross-currency swaps, the Company converted the Euro denominated fixed rate loan to a U.S. dollar loan at a pre-agreed foreign exchange rate and fixed U.S. dollar interest rate. These derivative financial instruments were initially recognized at fair value on the inception dates and are subsequently re-measured at fair value at the end of each reporting period. Gains or losses arising from changes in the fair value of the derivative financial instruments are recognized in the Consolidated Statements of Income as finance cost.
Foreign Exchange Forwards Fixed Rate Debt Economic Hedge
To manage the foreign currency exchange rate risk associated with its Euro denominated fixed rate borrowing, the Company has entered into a series of short-term foreign exchange derivatives with third party financial institutions. Under the terms of the open positions at December 31, 2023, the Company fixed the U.S. Dollar to Euro exchange rate at an average of $1.07092 to 1.00 with value dates of, March 22 (notional amount 40,800 at $1.07945 to 1.00 and notional amount 30,000 at $1.07907 to 1.00), and April 5, 2024 (notional amount 42,000 at $1.05962 to 1.00 and 10,000 at $1.05918 to 1.00).
Under the terms of the open positions at December 31, 2022, the Company fixed the U.S. Dollar to Euro exchange rate at an average of $1.04531 to 1.00 with value dates of April 6 (notional amount 42,000 at $1.00344 to 1.00 and 10,000 at $1.00491 to 1.00) and June 23 (notional amount 40,800 at $1.0759 to 1.00 and 30,000 at $1.0758 to 1.00).
F-64
Table of Contents
Titan America SA and Subsidiaries
Notes to Consolidated Financial Statements
December 31, 2023, 2022 and 2021
(All amounts in thousands)
25. Financial risk management objectives and policies (continued)
Under the terms of the open positions at December 31, 2021, the Company fixed the U.S. Dollar to Euro exchange rate at $1.1609 to 1.00 with value dates of January 14 (notional amount 40,800 at $1.1593 to 1.00 and 30,000 at $1.16075 to 1.00) and April 8, 2022 (notional amount 62,000 at $1.16162 to 1.00 and 20,000 at $1.16245 to 1.00).
Foreign Exchange Forwards Variable Rate RCF Debt Economic Hedge
To manage the foreign currency exchange rate risk associated with its Euro denominated variable rate borrowing, the Company has entered into a series of short-term foreign exchange derivatives with third party financial institutions. Under the terms of the open positions at December 31, 2023, the Company fixed the U.S. Dollar to Euro at an average of $1.08840 to 1.00 with value dates of January 19 (notional amount 16,500 at $1.09379 to 1.00) and February 29 (notional amount 20,000 at $1.08395 to 1.00). At December 31, 2022 and 2021 there were no open positions.
Interest Rate Swap - Exposure to Variable Interest Rates Economic Hedge
In May 2022, the Company entered into two 3-year interest rate swap agreements with third party financial institutions to manage the interest rate risk associated with the variable interest rates. Under the terms of those agreements, the counterparties fixed the interest rate for a notional amount of $100,000. Over the life of the agreements, the Company will receive variable rate interest on $100,000 and pay a fixed rate interest of 2.653% on $50,000 and 2.655% on $50,000. Gains or losses arising from changes in the fair value of the derivative financial instruments are recognized in the Consolidated Statements of Income as Finance cost.
Natural Gas Cash Flow Hedge
In 2023, the Company entered into a series of natural gas swap transactions in order to fix a portion of the monthly NYMEX component of its natural gas costs during 2023 and 2024. The total notional amount of the swap contracts was 420,000 MMBtus of which 390,000 MMBtus were outstanding at December 31, 2023 with a final settlement date is June 5, 2024. The Company designated a cash flow hedge relationship between the highly probable forecast monthly purchases of natural gas during 2023 and 2024 and the swap contracts. Due to matching of economic terms, no ineffectiveness is anticipated in this hedge relationship and none was recognized in the Consolidated Statements of Income as cost of goods sold during 2023.
In 2022, the Company entered into a series of natural gas swap transactions in order to fix a portion of the monthly NYMEX component of its natural gas costs during 2023. The total notional amount of the swap contracts was 2,970,000 MMBtus with a final settlement date is December 31, 2023. The Company designated a cash flow hedge relationship between the highly probable forecast monthly purchases of natural gas during 2023 and the swap contracts. Due to matching of economic terms, no ineffectiveness is anticipated in this hedge relationship and none was recognized in the Consolidated Statements of Income as cost of goods sold during 2022.
In 2021, the Company entered into a series of natural gas swap transactions in order to fix a portion of the monthly NYMEX component of its natural gas costs during 2022. The total notional amount of the swap contracts was 2,350,000 MMBtus and the final termination date is December 31, 2022. Again, the Company designated a cash flow hedge relationship between the highly probable forecast monthly purchases of natural gas during 2022 and the swap contracts. Due to coincidence of economic terms, no ineffectiveness is anticipated in this hedge relationship, and none was recognized in the Consolidated Statements of Income as cost of goods during 2021.
F-65
Table of Contents
Titan America SA and Subsidiaries
Notes to Consolidated Financial Statements
December 31, 2023, 2022 and 2021
(All amounts in thousands)
25. Financial risk management objectives and policies (continued)
Credit Support Payments and Receipts
The Company and each financial institution counterparty is required to post weekly credit support payments for the difference between: (1) accumulated mark-to-market gains or losses on derivative financial instruments; and (2) the net accumulated credit support payments posted, provided that the difference is at least 1,000 or 500, depending on the counterparty, when compared to the previous weekly calculation.
Sensitivity analysis to foreign exchange rate differences
The following table demonstrates the sensitivity of the Companys profit before income tax to reasonable changes in foreign exchange rates (after taking into consideration the impact of outstanding economic hedges in place for Euro denominated borrowings and other obligations), with all other variables held constant:
| Year Ended |
Decrease in USD:Euro FX Rate |
Effect on profit before tax (-/+) |
Increase in USD:Euro FX Rate |
Effect on profit before tax (+/-) |
||||||||||||
| 12/31/23 |
5.0 | % | $ | | (5.0 | )% | $ | | ||||||||
| 12/31/22 |
5.0 | % | $ | | (5.0 | )% | $ | | ||||||||
| 12/31/21 |
5.0 | % | $ | | (5.0 | )% | $ | | ||||||||
Interest rate risk
As the Company has no material interest-bearing assets, the Companys income and operating cash flows are not directly impacted by changes in market interest rates. The Companys interest rate risk arises from short-term and long-term borrowings. Borrowings issued at variable rates expose the Company to cash flow interest rate risk. Borrowings issued at fixed rates expose the Company to fair value interest rate risk. The Companys policy for long term borrowings will vary and is managed by the Company in coordination with TCIs group treasury function.
The following table demonstrates the sensitivity of the Companys profit before income tax (considering the impact of the outstanding floating rate borrowings at the end of the period) to reasonable changes in interest rates, with all other variables held constant:
| Year Ended |
Interest Rate Increase |
Effect on profit before tax (-/+) |
Interest Rate Decrease |
Effect on profit before tax (+/-) |
||||||||||||
| 12/31/23 |
1.0 | % | $ | 403 | (1.0 | )% | $ | (403 | ) | |||||||
| 12/31/22 |
1.0 | % | $ | 700 | (1.0 | )% | $ | (700 | ) | |||||||
| 12/31/21 |
1.0 | % | $ | 378 | (1.0 | )% | $ | (378 | ) | |||||||
Cash flow hedge
The Company entered into a series of natural gas swap transactions in order to fix a portion of the monthly NYMEX component of its natural gas costs during 2023, 2022, and 2021. The Company designated a cash flow hedge relationship between the highly probable forecast monthly purchases of natural gas during 2023, 2022 and 2021, and the swap contracts.
F-66
Table of Contents
Titan America SA and Subsidiaries
Notes to Consolidated Financial Statements
December 31, 2023, 2022 and 2021
(All amounts in thousands)
25. Financial risk management objectives and policies (continued)
The following table demonstrates the sensitivity of the Companys OCI (considering the impact of the outstanding contracts at the end of the period) to reasonable changes in natural gas pricing, with all other variables held constant:
| Year Ended |
Decrease in NG contract price |
Effect on OCI before tax (-/+) |
Increase in NG contract price |
Effect on OCI before tax (+/-) |
||||||||||||
| 12/31/23 |
$ | 1.00 | $ | 390 | $ | 1.00 | $ | (390 | ) | |||||||
| 12/31/22 |
$ | 1.00 | $ | 2,940 | $ | 1.00 | $ | (2,940 | ) | |||||||
| 12/31/21 |
$ | 1.00 | $ | | $ | 1.00 | $ | | ||||||||
Credit risk
The Company has no material concentrations of credit risk. Trade accounts receivable consist mainly of a large, widespread customer base. The Company monitors the financial position of its debtors on an ongoing basis. Refer to Note 15 for further details.
Financial instruments by measurement category
As of December 31, 2023 and 2022, the Companys financial assets were classified as follows:
| 2023 | 2022 | |||||||||||||||
| Assets at amortized cost |
Assets at FVPL* |
Assets at |
Assets at FVPL* |
|||||||||||||
| Financial Assets |
||||||||||||||||
| Trade receivables, net |
$ | 55,873 | $ | | $ | 56,445 | $ | | ||||||||
| Other receivables, net |
65,121 | | 60,363 | | ||||||||||||
| Non-current assets |
| 5,547 | | 4,024 | ||||||||||||
| Derivative financial instruments |
| 7,386 | | 7,552 | ||||||||||||
| Derivative credit support payments |
11,470 | | 22,447 | | ||||||||||||
| Cash and cash equivalents |
22,036 | | 29,841 | | ||||||||||||
|
|
|
|
|
|
|
|
|
|||||||||
| $ | 154,500 | $ | 12,933 | $ | 169,096 | $ | 11,576 | |||||||||
|
|
|
|
|
|
|
|
|
|||||||||
F-67
Table of Contents
Titan America SA and Subsidiaries
Notes to Consolidated Financial Statements
December 31, 2023, 2022 and 2021
(All amounts in thousands)
25. Financial risk management objectives and policies (continued)
At December 31, 2023 and 2022, the Companys financial liabilities were classified as follows:
| 2023 |
2022 |
|||||||||||||||||||||||
| Liabilities at amortized cost |
Liabilities at FVPL * |
Liabilities at FVOCI** |
Liabilities at amortized cost |
Liabilities at FVPL * |
Liabilities at FVOCI** |
|||||||||||||||||||
| Financial Liabilities |
||||||||||||||||||||||||
| Accounts payable |
$ | 151,229 | $ | | $ | | $ | 175,368 | $ | | $ | | ||||||||||||
| Accounts payable, related parties |
11,467 | | | 9,359 | | | ||||||||||||||||||
| Borrowings |
343,932 | | | 394,506 | | | ||||||||||||||||||
| Derivative financial instruments-economic hedges |
| 10,512 | | | 18,197 | | ||||||||||||||||||
| Derivative financial instruments-cash flow hedge |
| | | | | 2,930 | ||||||||||||||||||
| Derivative credit support receipts |
7,142 | | | 6,690 | | | ||||||||||||||||||
| Other noncurrent liabilities |
114 | | | 788 | | | ||||||||||||||||||
|
|
|
|
|
|
|
|
|
|
|
|
|
|||||||||||||
| $ | 513,884 | $ | 10,512 | $ | | $ | 586,711 | $ | 18,197 | $ | 2,930 | |||||||||||||
|
|
|
|
|
|
|
|
|
|
|
|
|
|||||||||||||
| * | FVPL Fair value through profit or loss |
| ** | FVOCI Fair value through comprehensive income |
Fair value of financial instruments
Recurring fair value measurements
Recurring fair value measurements are those that the accounting standards require or permit in the statement of financial position at the end of each reporting period. The Companys derivative financial instruments fall under this category, and under the fair value hierarchy, are measured based on Level 2 inputs.
Level 2 derivative financial instruments comprise cross currency interest rate swaps, interest rate swaps, foreign exchange forward contracts and natural gas futures. The Company uses a variety of valuation methods and makes assumptions that are based on market conditions existing at each reporting date. The recorded fair values of these contracts are based on: a) forward exchange rates that are quoted in an active market, b) forward interest rates extracted from observable yield curves, and c) natural gas prices extracted from observable yield curves, which are quoted in an active market. There were no changes in valuation techniques for Level 2 recurring fair value measurements during the years ended December 31, 2023, 2022 or 2021.
Financial instruments for which fair value does not approximate carrying amount
Financial instruments where fair value is not deemed to approximate carrying amount in the statement of financial position are the Companys loans from related parties and lease liabilities. The fair values are disclosed in Note 18.
| | Loans from related parties the fair value of loans from related parties are measured based on Level 3 inputs. The valuation models incorporate parameters such as interest rates and price quotations at the reporting date. With respect to long-term borrowings, quoted market prices or dealer quotes for the specific or similar instruments are also used. |
F-68
Table of Contents
Titan America SA and Subsidiaries
Notes to Consolidated Financial Statements
December 31, 2023, 2022 and 2021
(All amounts in thousands)
25. Financial risk management objectives and policies (continued)
| | Lease liabilities the fair value of lease liabilities is measured based on Level 2 inputs. The valuation model incorporates interest rates observable at commonly quoted intervals used to recalculate remaining lease payments based on current incremental borrowing rates. |
Capital management
The Companys objectives when managing capital are to safeguard the Companys ability to continue as a going concern to provide returns for its members and to maintain a reasonable capital structure and related cost of capital. The Company is a subsidiary of a group, the ultimate parent of which is TCI. As such, the capital management strategy of the Company is not determined in isolation, but rather, by taking into consideration both local and overseas funding alternatives, relative costs, and financial flexibility.
The Company has 240,000 of loans from related parties due in November 2024. The management of the Company intends to refinance these obligations (Note 29). In addition, the Company has a history of strong operating cash flow and available lines of credit (Note 18 and Note 29).
26. Earnings per share
Basic earnings per share is calculated by dividing net income attributable to ordinary equity holders of the Company (the numerator) by the weighted average number of shares outstanding (the denominator) during the period. During the periods presented the Company has no financial instruments or stock awards that dilute earnings per share.
The amounts considered for calculations of earnings per share in 2023, 2022 and 2021 were as follows:
| 2023 | 2022 | 2021 | ||||||||||
| Denominator (whole shares) |
||||||||||||
| Weighted average number of common stock - basic and diluted(1) |
175,362,465 | 175,362,465 | 175,362,465 | |||||||||
|
|
|
|
|
|
|
|||||||
| Numerator |
||||||||||||
| Net income |
$ | 155,244 | $ | 62,721 | $ | 59,221 | ||||||
|
|
|
|
|
|
|
|||||||
| Earnings per share of common stock |
||||||||||||
| Basic earnings per share |
$ | 0.89 | $ | 0.36 | $ | 0.34 | ||||||
| Diluted earnings per share |
$ | 0.89 | $ | 0.36 | $ | 0.34 | ||||||
|
|
|
|
|
|
|
|||||||
| (1) | For purposes of calculating earnings per share the Company has retrospectively presented earnings per share as if the reorganization in Note 1 had occurred at the beginning of the earliest period presented. Such retrospective presentation reflects 175,362,465 common shares due to the exchange of shares in Titan Atlantic for 175,342,465 shares in Titan America, the initial issuance of 2,000 common shares upon formation of Titan America and the subsequent conversion of each of the 2,000 common shares into 10 common shares. |
F-69
Table of Contents
Titan America SA and Subsidiaries
Notes to Consolidated Financial Statements
December 31, 2023, 2022 and 2021
(All amounts in thousands)
27. Segment information
Description of segments and principal activities
The Company operates its business through two reportable segments based on US geographic regions: the Florida and Mid Atlantic business segments. Each region has a regional president who is a member of the Executive Committee and reports directly to the Companys CEO, who is the chief operating decision maker (CODM). The core business activities of the two regions are substantially the same and encompass the manufacture, distribution, and sale of a comprehensive range of cement, aggregates, ready-mix concrete, concrete block, and fly ash.
In addition, the Companys operations include (1) the STET segment, a nonreportable operating segment that develops, manufactures, sells, and services triboelectrostatic separators and related equipment used to beneficiate fly ash, industrial minerals, and food and feed organics and (2) certain income and expense items managed on a total Company level which are not allocated to the operating segment measure of profit and loss, including: unallocated corporate costs, fair value loss on sale of accounts receivable, finance cost, finance income, foreign exchange gain/loss, derivative financial instrument gain/loss, and income taxes.
The CODM evaluates segment performance based on earnings before interest, taxes, depreciation, amortization & impairment (segment adjusted EBITDA). The segment adjusted EBITDA calculation includes the operating profit plus depreciation, amortization and impairment of tangible and intangible assets. This measure excludes the unallocated corporate costs summarized above. The CODM also receives information about the segments external revenue, capital spending, and depreciation and amortization on a regular basis.
Information about segment adjusted EBITDA, revenue, depreciation, depletion and amortization and capital spending follows:
Segment adjusted EBITDA
| Years Ended December 31, |
||||||||||||
| 2023 | 2022 | 2021 | ||||||||||
| Florida business segment |
$ | 221,227 | $ | 130,520 | $ | 105,530 | ||||||
| Mid-Atlantic business segment |
118,260 | 72,753 | 77,098 | |||||||||
|
|
|
|
|
|
|
|||||||
| Subtotal reportable segments |
$ | 339,487 | $ | 203,273 | $ | 182,628 | ||||||
|
|
|
|
|
|
|
|||||||
| STET segment |
(6,371 | ) | (5,119 | ) | (3,942 | ) | ||||||
| Unallocated Corporate |
(4,743 | ) | (5,057 | ) | (1,101 | ) | ||||||
| Finance cost, net |
(22,244 | ) | (19,078 | ) | (21,856 | ) | ||||||
| Depreciation, depletion and amortization |
(91,079 | ) | (87,728 | ) | (81,731 | ) | ||||||
| Loss on disposal of fixed assets |
(3,852 | ) | (1,186 | ) | (141 | ) | ||||||
| Asset impairment recovery/(loss) |
609 | (525 | ) | | ||||||||
| Foreign exchange (loss)/gain, net |
(11,981 | ) | 19,990 | 28,835 | ||||||||
| Derivative financial instrument (loss)/gain, net |
10,967 | (18,534 | ) | (25,915 | ) | |||||||
| Fair value loss on sale of accounts receivable, net |
(6,113 | ) | (3,041 | ) | (1,101 | ) | ||||||
| Share-based compensation |
(3,173 | ) | (2,402 | ) | (2,590 | ) | ||||||
| Other |
871 | (901 | ) | 1,471 | ||||||||
|
|
|
|
|
|
|
|||||||
| Income before income taxes |
$ | 202,378 | $ | 79,692 | $ | 74,557 | ||||||
|
|
|
|
|
|
|
|||||||
F-70
Table of Contents
Titan America SA and Subsidiaries
Notes to Consolidated Financial Statements
December 31, 2023, 2022 and 2021
(All amounts in thousands)
27. Segment information (continued)
Segment external revenue
External revenue are transactions with external customers for each of the business segments.
| 2023 | 2022 | 2021 | ||||||||||
| Florida business segment |
$ | 969,932 | $ | 808,558 | $ | 667,689 | ||||||
| Mid-Atlantic business segment |
619,683 | 553,335 | 481,908 | |||||||||
| STET segment |
1,986 | 2,253 | 2,820 | |||||||||
|
|
|
|
|
|
|
|||||||
| Total External Revenue |
$ | 1,591,601 | $ | 1,364,146 | $ | 1,152,417 | ||||||
|
|
|
|
|
|
|
|||||||
Segment depreciation, depletion and amortization
Depreciation, depletion and amortization per segment is as follows:
| 2023 | 2022 | 2021 | ||||||||||
| Florida business segment |
$ | 57,000 | $ | 55,655 | $ | 49,779 | ||||||
| Mid-Atlantic business segment |
33,472 | 31,490 | 30,344 | |||||||||
| STET segment |
591 | 576 | 505 | |||||||||
| Corporate |
16 | 7 | 1,103 | |||||||||
|
|
|
|
|
|
|
|||||||
| Total depreciation, depletion and amortization |
$ | 91,079 | $ | 87,728 | $ | 81,731 | ||||||
|
|
|
|
|
|
|
|||||||
Segment capital spending
Capital spending is investment in property, plant, equipment and intangible assets (e.g. software), excluding additions to quarries.
| 2023 | 2022 | 2021 | ||||||||||
| Florida business segment |
$ | 74,458 | $ | 85,725 | $ | 31,053 | ||||||
| Mid-Atlantic business segment |
41,970 | $ | 40,683 | 26,945 | ||||||||
| STET segment |
83 | $ | 72 | 64 | ||||||||
| Corporate |
349 | $ | 4,233 | 9,358 | ||||||||
|
|
|
|
|
|
|
|||||||
| Total Capital Spending |
$ | 116,860 | $ | 130,713 | $ | 67,420 | ||||||
|
|
|
|
|
|
|
|||||||
28. Issued capital and reserves
Titan America has one class of common stock. After considering the effect of the Share Split and Reorganization Transaction described in footnote 29, the number of shares authorized for issuance and outstanding was 175,362,465 for the years ended December 31, 2023, 2022 and 2021. There were no shares issued but not fully paid as of December 31, 2023, December 31, 2022 and December 31, 2021.
29. Events after the reporting period
Management has evaluated subsequent events through December 20, 2024, which is the date these financial statements were available to be issued:
| | On February 1, 2024, the Company entered into a cash management agreement with TGF. The agreement is effective until either party provides written notice of termination. Pursuant to this |
F-71
Table of Contents
Titan America SA and Subsidiaries
Notes to Consolidated Financial Statements
December 31, 2023, 2022 and 2021
(All amounts in thousands)
29. Events after the reporting period (continued)
| agreement, the Companys two existing HSBC UK bank accounts, one denominated in U.S. dollars and one denominated in Euros, are funded when there are negative daily balances. Fundings are subject to maximum borrowing limits of $15 million and 15 million, respectively. Conversely, when there are cash balances in either account, these funds are swept as a deposit into the TGF concentration account. There are no deposit limits. |
With respect to borrowings made under the cash management agreement, the Company bears a daily interest charge based on the benchmark rates of the European Central Bank (ECB) Main Refinancing Rate (for Euro borrowings) and the U.S. Federal Reserve Federal Funds Target Rate (for U.S. dollar borrowings), plus an applicable margin.
With respect to deposits made under the cash management agreement, the Company receives a daily interest credit based on the benchmark interest rates of the ECB Deposit Facility Rate (for Euro deposits) and the U.S. Federal Reserve Federal Funds Target Rate (for U.S. dollar deposits), minus an applicable margin.
| | On March 15, 2024, the Company renewed its $45,000 committed borrowing facility with a bank through March 15, 2025. |
| | On April 29, 2024, the Company amended its 45,000 note payable with TGF bearing interest at 3.05% and maturing on November 15, 2024, to increase the principal to a 50,000 note payable bearing interest of 4.80% and maturing on June 11, 2029 (Note 25). |
| | On April 29, 2024, the Company amended its 75,000 note payable with TGF bearing interest at 3.05% and maturing on November 15, 2024, to increase the principal to a 100,000 note payable bearing interest of 4.80% and maturing on June 11, 2029 (Note 25). |
| | On April 29, 2024, the Company entered into 5-year cross-currency interest rate swap agreements with third party financial institutions to manage the foreign currency and interest rate risk associated with the aforementioned fixed rate Euro denominated borrowings. Under the terms of these agreements, the counterparties fixed the June 11, 2029, U.S. Dollar to Euro exchange rate for the scheduled 150,000 repayment at $1.07213 to 1.00. In addition, over the life of the agreements, the Company will receive Euro denominated fixed rate interest on 150,000 and pay U.S. Dollar denominated fixed rate interest on $160,820. |
| | On April 29, 2024, the Company entered into a series of short-term foreign exchange forwards with third party financial institutions. Under the terms the Company fixed the U.S. Dollar to Euro exchange rate (notional amount of 149,300) at an average of $1.072929 to 1.00 with a value date of May 31st and June 17, 2024. |
| | On April 30, 2024, the Company renewed its $60,000 committed borrowing facility with a bank through April 29, 2025. |
| | On May 20, 2024, the Company renewed the accounts receivable securitization agreements until May 19, 2025. |
| | On June 17, 2024, the Company entered into a short-term foreign exchange forward with third party financial institutions. Under the terms the Company fixed the U.S. Dollar to Euro exchange rate (notional amount of 10,000) at $1.0795 to 1.00 with a value date of September 23, 2024. |
| | On July 15 and 18, 2024, Titan Atlantic declared and paid dividends of $80,000 (73,450 euro equivalent) and $5,067 (4,635 euro equivalent), respectively, to Titan Cement Company S.A. and Columbus Properties BV. |
| | On July 17, 2024, Titan America was incorporated in Belgium and was capitalized by TCI with $200 and 2,000 common shares. |
F-72
Table of Contents
Titan America SA and Subsidiaries
Notes to Consolidated Financial Statements
December 31, 2023, 2022 and 2021
(All amounts in thousands)
29. Events after the reporting period (continued)
| | On July 17, 2024, the Company entered into a short-term foreign exchange forward with third party financial institutions. Under the terms the Company fixed the U.S. Dollar to Euro exchange rate (notional amount of 15,000) at $1.09665 to 1.00 with a value date of September 6, 2024. |
| | On July 31, 2024, the Company amended its 100,000 multicurrency revolving credit facility with TGF, bearing interest at variable rates and maturing on January 30, 2026, to increase it to 130,000. |
| | On September 4, 2024, the Company entered into a short-term foreign exchange forward with third party financial institutions. Under the terms the Company fixed the U.S. Dollar to Euro exchange rate (notional amount of 14,500) at $1.0689 to 1.00 with a value date of October 7, 2024. |
| | On October 20, 2024, the Company purchased D.M. Conner, Inc., a Virginia quarry business, for a base purchase price of $4,400 less indebtedness. In addition, the Company purchased the associated land on which the quarry operates for an additional base purchase price of $800. As the transaction recently closed, the Company is still in the process of completing the accounting related to the acquisition. |
| | On October 25, 2024, Titan Atlantic declared and paid a return of capital of $51,591 (47,819 euro equivalent) to TCI. The return of capital was funded through a combination of drawdowns on short-term third party and short-term and long-term related party credit facilities. |
| | On November 15, 2024, the Company executed a 150,000 note payable with TGF bearing interest at 3.20% and maturing on July 7, 2027. The proceeds of this note were used to settle the 120,000 note maturing November 15, 2024, and 30,000 of the multicurrency revolving credit facility with TGF. |
| | On November 18, 2024, the Company entered into 30-month cross-currency interest rate swap agreements with third party financial institutions to manage the foreign currency and interest rate risk associated with the aforementioned fixed rate Euro denominated borrowings. Under the terms of these agreements, the counterparties fixed the July 7, 2027, U.S. Dollar to Euro exchange rate for the scheduled 150,000 repayment at $1.05383 to 1.00. In addition, over the life of the agreements, the Company will receive Euro denominated fixed rate interest on 150,000 and pay U.S. Dollar denominated fixed rate interest on $158,075. |
| | On December 18, 2024, Titan Americas 2,000 common shares, without nominal value, were converted into 20,000 common shares, without nominal value at a ten to one ratio (the Share Split). Following the Share Split, the derived value of Titan Americas outstanding common shares was $10.00 per share. |
| | On December 18, 2024, TCI contributed 100% of its equity interest in Titan Atlantic to Titan America in exchange for 175,342,465 common shares, which was treated as a reorganization under common control. As a result, the following adjustments will be recorded by the Company within equity: |
| | Common Stock will be adjusted to reflect the $10.00 derived value of Titan Americas common shares multiplied by common shares outstanding; and |
| | Share Premium will be adjusted to reflect an issue premium multiplied by the number of common shares issued by Titan America in the Reorganization Transaction, less the value of the Companys retained earnings; and |
| | A Common Control Reserve will be established within equity to adjust the Companys Total Stockholders Equity balance to the carrying value of Total Stockholders Equity immediately prior to the Reorganization Transaction. |
No other material matters were identified impacting the Companys financial position or requiring further disclosure.
F-73
Table of Contents
Titan America SA and Subsidiaries
Interim Condensed Consolidated Statements of Income
(Unaudited)
| (all amounts in thousands of US$ except for earning per share) | Nine Months Ended September 30, | |||||||||
| Notes | 2024 | 2023 | ||||||||
| Revenue |
3 | $ | 1,244,578 | $ | 1,192,464 | |||||
| Cost of goods sold |
(923,653 | ) | (920,955 | ) | ||||||
|
|
|
|
|
|||||||
| Gross profit |
320,925 | 271,509 | ||||||||
|
|
|
|
|
|||||||
| Selling expense |
(24,913 | ) | (21,271 | ) | ||||||
| General and administrative expense |
(91,823 | ) | (74,608 | ) | ||||||
| Net impairment losses on financial assets |
(251 | ) | (1,136 | ) | ||||||
| Fair value loss on sale of accounts receivable, net |
4 | (4,050 | ) | (4,937 | ) | |||||
| Other operating income, net |
1,341 | 11 | ||||||||
|
|
|
|
|
|||||||
| Operating income |
201,229 | 169,568 | ||||||||
|
|
|
|
|
|||||||
| Finance cost, net |
(18,835 | ) | (19,156 | ) | ||||||
| Foreign exchange (loss)/gain, net |
5 | (7,467 | ) | 1,970 | ||||||
| Derivative financial instrument loss, net |
5 | (1,482 | ) | (4,155 | ) | |||||
|
|
|
|
|
|||||||
| Income before income taxes |
173,445 | 148,227 | ||||||||
|
|
|
|
|
|||||||
| Income tax expense |
11 | (43,899 | ) | (38,427 | ) | |||||
|
|
|
|
|
|||||||
| Net income |
$ | 129,546 | $ | 109,800 | ||||||
|
|
|
|
|
|||||||
| Earnings per share of common stock (Note 15): |
||||||||||
| Basic earnings per share |
$ | 0.74 | $ | 0.63 | ||||||
| Diluted earnings per share |
$ | 0.74 | $ | 0.63 | ||||||
| Weighted average number of common stock - basic and diluted |
175,362,465 | 175,362,465 | ||||||||
The accompanying notes are an integral part of these interim condensed consolidated financial statements.
F-74
Table of Contents
Titan America SA and Subsidiaries
Interim Condensed Consolidated Statements of Other Comprehensive Income
(Unaudited)
| (all amounts in thousands of US$) | Nine Months Ended September 30, | |||||||||||
| Notes | 2024 | 2023 | ||||||||||
| Net income |
$ | 129,546 | $ | 109,800 | ||||||||
| Other comprehensive income: |
||||||||||||
| Other comprehensive income to be reclassified to profit or loss in subsequent periods: |
||||||||||||
| Losses on cash flow hedges |
5 | (111 | ) | (4,335 | ) | |||||||
| Reclassification to income statement |
100 | 5,774 | ||||||||||
| Income tax relating to these items |
3 | (367 | ) | |||||||||
|
|
|
|
|
|||||||||
| Net (loss)/gain on cash flow hedge |
(8 | ) | 1,072 | |||||||||
|
|
|
|
|
|||||||||
| Net other comprehensive income/(expense) to be reclassified to profit or loss in subsequent periods |
(8 | ) | 1,072 | |||||||||
| Items not to be reclassified to profit or loss in subsequent periods |
||||||||||||
| Re-measurement gains on defined benefit plans |
| | ||||||||||
| Income tax relating to these items |
| | ||||||||||
|
|
|
|
|
|||||||||
| Net gain on defined benefit plans |
| | ||||||||||
| Cumulative translation adjustments |
1,237 | 50 | ||||||||||
|
|
|
|
|
|||||||||
| Net other comprehensive income not to be reclassified to profit or loss in subsequent periods |
1,237 | 50 | ||||||||||
| Other comprehensive income, net of tax |
1,229 | 1,122 | ||||||||||
|
|
|
|
|
|||||||||
| Total comprehensive income, net of tax |
$ | 130,775 | $ | 110,922 | ||||||||
|
|
|
|
|
|||||||||
The accompanying notes are an integral part of these interim condensed consolidated financial statements.
F-75
Table of Contents
Titan America SA and Subsidiaries
Interim Condensed Consolidated Statements of Financial Position
(Unaudited)
| (all amounts in thousands of US$) | September 30, December 31, | |||||||||||
| Notes | 2024 | 2023 | ||||||||||
| Current assets: |
||||||||||||
| Cash and cash equivalents |
12,149 | 22,036 | ||||||||||
| Derivative financial instruments |
5 | 147 | 5,315 | |||||||||
| Derivative credit support payments |
5 | 12,360 | 11,470 | |||||||||
| Trade receivables, net |
7 | 50,837 | 55,873 | |||||||||
| Other receivables, net |
8 | 67,917 | 65,121 | |||||||||
| Inventories |
9 | 208,463 | 189,989 | |||||||||
| Prepaid expenses and other current assets |
9,378 | 16,194 | ||||||||||
| Income taxes receivable |
11,249 | 6,901 | ||||||||||
|
|
|
|
|
|||||||||
| Total current assets |
372,500 | 372,899 | ||||||||||
| Noncurrent assets: |
||||||||||||
| Derivative financial instruments |
5 | 3,121 | 2,071 | |||||||||
| Property, plant, equipment and mineral deposits, net |
6 | 847,271 | 801,031 | |||||||||
| Right-of-use assets |
64,767 | 61,441 | ||||||||||
| Other assets |
7,860 | 6,586 | ||||||||||
| Intangible assets, net |
30,435 | 33,213 | ||||||||||
| Goodwill |
221,562 | 221,562 | ||||||||||
|
|
|
|
|
|||||||||
| Total noncurrent assets |
1,175,016 | 1,125,904 | ||||||||||
|
|
|
|
|
|||||||||
| Total assets |
$ | 1,547,516 | $ | 1,498,803 | ||||||||
|
|
|
|
|
|||||||||
The accompanying notes are an integral part of these interim condensed consolidated financial statements.
F-76
Table of Contents
Titan America SA and Subsidiaries
Interim Condensed Consolidated Statements of Financial Position (continued)
(Unaudited)
| (all amounts in thousands of US$) | Notes | September 30, 2024 |
December 31, 2023 |
|||||||||
| Current liabilities: |
||||||||||||
| Accounts payable |
124,490 | 151,229 | ||||||||||
| Derivative financial instruments |
5 | 8,436 | 10,512 | |||||||||
| Related party payables |
12 | 9,747 | 11,467 | |||||||||
| Accrued expenses |
32,963 | 20,757 | ||||||||||
| Derivative credit support receipts |
5 | | 5,061 | |||||||||
| Provisions |
9,377 | 10,452 | ||||||||||
| Contract liabilities |
618 | 1,090 | ||||||||||
| Income taxes payable |
1,952 | 1,999 | ||||||||||
| Short-term borrowings, including accrued interest |
10 | 141,816 | 267,670 | |||||||||
| Lease liabilities |
10 | 11,901 | 11,737 | |||||||||
|
|
|
|
|
|||||||||
| Total current liabilities |
341,300 | 491,974 | ||||||||||
| Noncurrent liabilities: |
||||||||||||
| Long-term borrowings |
10 | 227,858 | 76,262 | |||||||||
| Retirement benefit obligations |
4,760 | 4,310 | ||||||||||
| Derivative credit support receipts |
5 | 3,075 | 2,081 | |||||||||
| Provisions |
54,864 | 55,302 | ||||||||||
| Contract liabilities |
347 | 868 | ||||||||||
| Other noncurrent liabilities |
307 | 114 | ||||||||||
| Lease liabilities |
10 | 57,615 | 53,744 | |||||||||
| Deferred income tax liability |
94,728 | 94,377 | ||||||||||
|
|
|
|
|
|||||||||
| Total noncurrent liabilities |
443,554 | 287,058 | ||||||||||
|
|
|
|
|
|||||||||
| Total liabilities |
784,854 | 779,032 | ||||||||||
| Stockholders equity: |
||||||||||||
| Common stock |
25,419 | 25,219 | ||||||||||
| Share premium |
168,605 | 168,791 | ||||||||||
| Capital reserves |
4,039 | 4,039 | ||||||||||
| Retained earnings |
560,269 | 518,621 | ||||||||||
| Accumulated other comprehensive income/(loss) |
4,330 | 3,101 | ||||||||||
|
|
|
|
|
|||||||||
| Total stockholders equity |
762,662 | 719,771 | ||||||||||
|
|
|
|
|
|||||||||
| Total liabilities and stockholders equity |
$ | 1,547,516 | $ | 1,498,803 | ||||||||
|
|
|
|
|
|||||||||
The accompanying notes are an integral part of these interim condensed consolidated financial statements.
F-77
Table of Contents
Titan America SA and Subsidiaries
Interim Condensed Consolidated Statements of Changes in Stockholders Equity
(Unaudited)
| (all amounts in thousands of US$) | Notes | Common Stock |
Share premium |
Capital Reserves |
Retained Earnings |
Accumulated Other Comprehensive Income/(Loss) |
Total Stockholders Equity |
|||||||||||||||||||||
| January 1, 2023 |
$ | 25,219 | $ | 165,982 | $ | 2,822 | $ | 398,687 | $ | 17 | $ | 592,727 | ||||||||||||||||
| Net income |
| | | 109,800 | | 109,800 | ||||||||||||||||||||||
| Cash flow hedge, net of tax |
| | | | 1,072 | 1,072 | ||||||||||||||||||||||
| Stock based compensation expense |
| 2,338 | | | | 2,338 | ||||||||||||||||||||||
| Related party recharge for stock-based compensation |
| (1,333 | ) | | (429 | ) | | (1,762 | ) | |||||||||||||||||||
| Cumulative translation adjustments |
| | | | 50 | 50 | ||||||||||||||||||||||
|
|
|
|
|
|
|
|
|
|
|
|
|
|||||||||||||||||
| September 30, 2023 |
$ | 25,219 | $ | 166,987 | $ | 2,822 | $ | 508,058 | $ | 1,139 | $ | 704,225 | ||||||||||||||||
|
|
|
|
|
|
|
|
|
|
|
|
|
|||||||||||||||||
| January 1, 2024 |
$ | 25,219 | $ | 168,791 | $ | 4,039 | $ | 518,621 | $ | 3,101 | $ | 719,771 | ||||||||||||||||
| Net income |
| | | 129,546 | | 129,546 | ||||||||||||||||||||||
| Dividend |
| | | (85,068 | ) | | (85,068 | ) | ||||||||||||||||||||
| Cash flow hedge, net of tax |
| | | | (8 | ) | (8 | ) | ||||||||||||||||||||
| Stock based compensation expense |
| 2,875 | | | | 2,875 | ||||||||||||||||||||||
| Related party recharge for stock-based compensation |
| (3,061 | ) | | (2,830 | ) | | (5,891 | ) | |||||||||||||||||||
| Cumulative translation adjustments |
| | | | 1,237 | 1,237 | ||||||||||||||||||||||
| Contribution from related party |
200 | | | | | 200 | ||||||||||||||||||||||
|
|
|
|
|
|
|
|
|
|
|
|
|
|||||||||||||||||
| September 30, 2024 |
$ | 25,419 | $ | 168,605 | $ | 4,039 | $ | 560,269 | $ | 4,330 | $ | 762,662 | ||||||||||||||||
|
|
|
|
|
|
|
|
|
|
|
|
|
|||||||||||||||||
The accompanying notes are an integral part of these interim condensed consolidated financial statements.
F-78
Table of Contents
Titan America SA and Subsidiaries
Interim Condensed Consolidated Statements of Cash Flows
(Unaudited)
| (all amounts in thousands of US$) | Nine Months Ended September 30, | |||||||||||
| Notes | 2024 | 2023 | ||||||||||
| Cash flows from operating activities |
||||||||||||
| Income before income taxes |
$ | 173,445 | $ | 148,227 | ||||||||
| Adjustments for: |
||||||||||||
| Depreciation, depletion and amortization |
69,024 | 63,798 | ||||||||||
| Finance cost |
20,060 | 19,845 | ||||||||||
| Finance income |
(1,225 | ) | (689 | ) | ||||||||
| Foreign exchange loss/(gain), net |
5 | 7,467 | (1,970 | ) | ||||||||
| Derivative financial instrument (gain)/loss, net |
5 | 1,482 | 4,155 | |||||||||
| Changes in net operating assets and liabilities |
(24,712 | ) | (63,992 | ) | ||||||||
| Other |
652 | 2,307 | ||||||||||
|
|
|
|
|
|||||||||
| Cash generated from operations before income taxes |
246,193 | 171,681 | ||||||||||
| Income taxes paid |
(49,050 | ) | (29,266 | ) | ||||||||
|
|
|
|
|
|||||||||
| Net cash provided by operating activities |
197,143 | 142,415 | ||||||||||
|
|
|
|
|
|||||||||
| Cash flows from investing activities |
||||||||||||
| Investments in property, plant and equipment |
6 | (113,213 | ) | (91,989 | ) | |||||||
| Investments in identifiable intangible assets |
(333 | ) | 35 | |||||||||
| Interest received |
1,226 | 688 | ||||||||||
| Proceeds from the sale of assets, net of disposition costs |
199 | 141 | ||||||||||
|
|
|
|
|
|||||||||
| Net cash used in investing activities |
(112,121 | ) | (91,125 | ) | ||||||||
|
|
|
|
|
|||||||||
The accompanying notes are an integral part of these interim condensed consolidated financial statements.
F-79
Table of Contents
Titan America SA and Subsidiaries
Interim Condensed Consolidated Statements of Cash Flows (continued)
(Unaudited)
| (all amounts in thousands of US$) | Nine Months Ended September 30, | |||||||
| 2024 | 2023 | |||||||
| Cash flows from financing activities |
||||||||
| Repayments of affiliated party borrowings |
(32,563 | ) | (31,147 | ) | ||||
| Borrowings from affiliated party |
48,964 | | ||||||
| Offering costs associated with borrowings |
(682 | ) | | |||||
| Borrowings from third party line of credit |
20,000 | | ||||||
| Repayment of third party line of credit |
(20,000 | ) | (18,795 | ) | ||||
| Lease payments |
(7,300 | ) | (9,434 | ) | ||||
| Dividends paid |
(85,068 | ) | | |||||
| Contribution from related party |
200 | | ||||||
| Related party recharge for stock-based compensation |
(2,830 | ) | (429 | ) | ||||
| Settlement of derivative financial instrument receipts |
704 | 4,499 | ||||||
| Derivative credit support payments |
(4,958 | ) | (4,448 | ) | ||||
| Interest paid |
(13,053 | ) | (15,137 | ) | ||||
| IPO costs |
(628 | ) | | |||||
|
|
|
|
|
|||||
| Net cash used in financing activities |
(97,214 | ) | (74,891 | ) | ||||
|
|
|
|
|
|||||
| Net decrease in cash and cash equivalents |
(12,192 | ) | (23,601 | ) | ||||
| Cash and cash equivalents at: |
||||||||
| Beginning of period |
22,036 | 29,841 | ||||||
| Effects of exchange rate changes |
2,305 | 24 | ||||||
|
|
|
|
|
|||||
| End of period |
$ | 12,149 | $ | 6,264 | ||||
|
|
|
|
|
|||||
| Changes in net operating assets and liabilities |
||||||||
| Inventories |
$ | (18,474 | ) | $ | (4,962 | ) | ||
| Trade receivables, net |
4,632 | (7,662 | ) | |||||
| Other receivables, net |
(5,270 | ) | (4,532 | ) | ||||
| Prepaid expenses and other current assets |
6,816 | 830 | ||||||
| Other assets |
(120 | ) | (294 | ) | ||||
| Accounts payable |
(18,285 | ) | (43,665 | ) | ||||
| Accrued expenses |
12,008 | 1,052 | ||||||
| Provisions |
(4,413 | ) | 388 | |||||
| Other liabilities |
191 | 40 | ||||||
| Retirement benefit obligations |
(76 | ) | (49 | ) | ||||
| Operating related party activity |
(1,721 | ) | (5,138 | ) | ||||
|
|
|
|
|
|||||
| Changes in net operating assets and liabilities |
$ | (24,712 | ) | $ | (63,992 | ) | ||
|
|
|
|
|
|||||
The principal non-cash investing and financing transactions are accrued purchases of property, plant, and equipment and leasing of right-of-use assets.
The accompanying notes are an integral part of these interim condensed consolidated financial statements.
F-80
Table of Contents
Titan America SA and Subsidiaries
Notes to the Interim Condensed Consolidated Financial Statements
(Unaudited)
(All amounts in thousands of US$)
| 1. | General Information and Summary of Material Accounting Policies |
Titan America SA (Titan America or the Company) is a Belgium-based holding company, incorporated on July 17, 2024 for the purpose of facilitating an initial public offering and other related transactions in order to carry on the business of Titan Atlantic Industrial and Commercial SA (Titan Atlantic). Titan Americas primary role is that of a holding company, and it will not engage in significant operational activities. Its sole material asset is its investment in Titan Atlantic. Titan America, along with its wholly owned subsidiaries including Titan Atlantic, are referred to as the Company.
The Company, through its wholly owned subsidiaries, primarily operates in the manufacture, distribution, and sale of cement, fly ash, construction aggregates, ready-mixed concrete, and concrete blocks to resellers and construction contractors in the Eastern region of the United States. Titan Americas principal offices are located in Belgium.
Reorganization Transaction
On December 18, 2024, Titan Cement International SA (TCI), contributed Titan Atlantic to Titan America in exchange for 175,342,465 common shares representing 100% of the equity in Titan America (the Reorganization Transaction). The Reorganization Transaction signified a continuation of Titan Atlantics operations within a new legal framework, rather than the initiation of new business activities. The Reorganization Transaction represents an internal reorganization of entities under common control and is not within the scope of IFRS 3, Business Combinations. As a result, the consolidated financial statements for periods prior to the Reorganization Transaction reflect the operations of our predecessor, Titan Atlantic.
The interim condensed consolidated financial statements for the nine months ended September 30, 2024 were authorized for issuance by the Board of Directors of the Company on December 20, 2024.
Summary of material accounting policies
| 1.1 | Basis of Preparation |
The interim condensed consolidated financial statements have been prepared in accordance with International Accounting Standard (IAS) 34, as issued by the International Accounting Standards Board.
The interim condensed consolidated financial statements have been prepared under the historical cost convention, except for certain financial assets and liabilities (including derivative financial instruments) and defined benefit pension plan assets, which are measured at fair value.
These interim condensed consolidated financial statements follow the same significant accounting policies as those included in the Companys most recent audited consolidated financial statements. Management believes that all adjustments that are required for a proper presentation of the financial information are incorporated in these interim condensed consolidated financial statements, except for the adoption of the new or revised standards, amendments and/or interpretations that became mandatory for periods beginning on or after January 1, 2024.
The accompanying interim condensed consolidated financial statements present the results of operations, financial position, and cash flows of the Company, which includes the historical consolidated financial information of our predecessor, Titan Atlantic, prior to the Reorganization. The earnings per share of the Company have been presented to retrospectively reflect the capital structure of the Company in connection with the Reorganization Transaction.
F-81
Table of Contents
Titan America SA and Subsidiaries
Notes to the Interim Condensed Consolidated Financial Statements
(Unaudited)
(All amounts in thousands of US$)
| 1.1.1 | New and Amended Standards and Interpretations |
Certain new accounting standards and interpretations have been published that are not mandatory for September 30, 2024 reporting periods and have not been early adopted by the Company. The Company is currently assessing whether these standards will have a material impact on the Company in the current or future periods and on foreseeable future transactions.
| | Presentation and Disclosure in Financial Statements IFRS 18 |
| | Financial Instruments Amendments to IFRS 9 and IFRS 7 |
| | Disclosure of Revenues and Expenses for Reportable Segments IFRIC Interpretations Committee Agenda Decision IFRS 8 |
The Company has applied the following standards and amendments for the first time in the annual reporting period commencing on January 1, 2024:
| | Classification of Liabilities as Current or Non-current Amendments to IAS 1 |
| | Lease Liability in a Sale and Leaseback Amendments to IFRS 16 |
| | Financial Instruments: Disclosures Amendments to IFRS 7 |
The Company has applied the following standards and amendments for the first time in the annual reporting period commencing on January 1, 2023:
| | Disclosure of accounting policies Amendments to IAS 1 and IFRS Practice statement 2 (January 1, 2023) |
| | Definition of accounting estimates Amendments to IAS 8 (January 1, 2023) |
| | Deferred Tax related to Assets and Liabilities arising from a single Transaction Amendments to IAS 12 (January 1, 2023) |
| | International Tax Reform Pillar Two Model Rules Amendments to IAS 12 (January 1, 2023) (see Note 11) |
The amendments listed above did not have a material impact on the amounts recognized in prior periods and are not expected to materially affect the current or future periods.
| 1.2 | Consolidation |
| (a) | Subsidiaries |
The interim condensed consolidated financial statements comprise the financial statements of the Company and its subsidiaries. All intercompany balances and transactions have been eliminated in consolidation. Subsidiaries are all entities over which the Company has control. The Company controls an entity when the Company is exposed to, or has rights to, variable returns from its involvement with the entity and has the ability to affect those returns through its power over the entity. Subsidiaries are fully consolidated from the date on which control is transferred to the Company. They are deconsolidated from the date that control ceases.
F-82
Table of Contents
Titan America SA and Subsidiaries
Notes to the Interim Condensed Consolidated Financial Statements
(Unaudited)
(All amounts in thousands of US$)
A listing of Company subsidiaries at September 30, 2024 and December 31, 2023, follows:
| List of Legal Entities | Country of incorporation |
State of incorporation |
Nature of business | September 30, 2024 % of investment |
December 31, 2023 % of investment |
|||||||||
| Titan Atlantic Cement Industrial and Commercial S.A. |
Greece | N/A | Investment holding company |
100 | 100 | |||||||||
| Titan America LLC |
USA | Delaware | Investment holding company |
100 | 100 | |||||||||
| Essex Cement Company LLC |
USA | Delaware | Trading company | 100 | 100 | |||||||||
| Mechanicsville Concrete LLC |
USA | Virginia |
Ready-mix producer |
100 | 100 | |||||||||
| Pennsuco Cement Company LLC |
USA | Delaware | Investment holding company |
100 | 100 | |||||||||
| Roanoke Cement Company LLC |
USA | Virginia | Cement producer | 100 | 100 | |||||||||
| S&W Ready Mix LLC |
USA | North Carolina |
Ready-mix producer |
100 | 100 | |||||||||
| Separation Technologies LLC |
USA | Delaware | Fly ash beneficiation |
100 | 100 | |||||||||
| ST Equipment & Technology LLC |
USA | Delaware | Sales and engineering services |
100 | 100 | |||||||||
| ST Equipment & Technology Trading Company LLC |
USA | Delaware | Trading company | 100 | 100 | |||||||||
| Titan Florida LLC |
USA | Delaware | Cement, aggregates, ready-mix and concrete block producer |
100 | 100 | |||||||||
| Titan Mid-Atlantic Aggregates LLC |
USA | Virginia | Aggregates producer |
100 | 100 | |||||||||
| Titan Virginia Ready-Mix |
USA | Delaware |
Ready-mix concrete producer |
100 | 100 | |||||||||
| Trusa Realty LLC |
USA | Florida | Real estate holding company |
100 | 100 | |||||||||
| Markfield America LLC |
USA | Virginia | Insurance brokerage company |
100 | 100 | |||||||||
| Titan Florida Holdings LLC |
USA | Delaware | Investment holding company |
100 | 100 | |||||||||
| Carolinas Cement Company LLC |
USA | Delaware | Investment holding company |
100 | 100 | |||||||||
| Norfapeake Terminal LLC |
USA | Virginia | Trading company | 100 | 100 | |||||||||
F-83
Table of Contents
Titan America SA and Subsidiaries
Notes to the Interim Condensed Consolidated Financial Statements
(Unaudited)
(All amounts in thousands of US$)
| List of Legal Entities | Country of incorporation |
State of incorporation |
Nature of business | September 30, 2024 % of investment |
December 31, 2023 % of investment |
|||||||||
| S&W Ready Mix LLC |
USA | South Carolina |
Ready-mix producer |
100 | 100 | |||||||||
| Titan Florida Concrete Products LLC |
USA | Delaware | Investment holding company |
100 | 100 | |||||||||
| Titan Florida Aggregates LLC |
USA | Delaware | Investment holding company |
100 | 100 | |||||||||
| Titan Florida Cement LLC |
USA | Delaware | Investment holding company |
100 | 100 | |||||||||
| Metro Redi-Mix LLC |
USA | Florida | Real estate holding company |
100 | 100 | |||||||||
| Miami Valley Ready-Mix Florida LLC |
USA | Delaware | Real estate holding company |
100 | 100 | |||||||||
| Summit Ready-Mix LLC |
USA | Florida | Real estate holding company |
100 | 100 | |||||||||
| Silver Sand Transportation LLC |
USA | Delaware | Transportation brokerage |
100 | 100 | |||||||||
| Standard Concrete LLC |
USA | Florida | Investment holding company |
100 | 100 | |||||||||
| Massey Sand and Rock Co. |
USA | California | Inactive | 100 | 100 | |||||||||
| Daleville Development LLC |
USA | Virginia | Real estate holding company |
100 | 100 | |||||||||
| Nestor Timber Development LLC |
USA | Virginia | Real estate holding company |
100 | 100 | |||||||||
| SEI LLC |
USA | North Carolina |
Real estate holding company |
100 | 100 | |||||||||
| (b) | Associates |
The Company has assessed the nature of an investment in which it does not exercise control over the investee and determined it to be an associate, as the Company does not control or jointly control the entity, but rather exerts significant influence. Associates are accounted for using the equity method.
F-84
Table of Contents
Titan America SA and Subsidiaries
Notes to the Interim Condensed Consolidated Financial Statements
(Unaudited)
(All amounts in thousands of US$)
| 2. | Significant Accounting Estimates and Critical Judgments |
The preparation of the interim condensed consolidated financial statements requires management to make estimates and judgments that affect the reported amounts and disclosures. Estimates and judgments are continuously evaluated and are based on historical experience and other factors, including expectations about future events believed to be reasonable under the circumstances.
Such estimates and assumptions form the basis in making judgments to determine the carrying value of assets and liabilities not readily available from other sources. The resulting accounting estimates will, by definition, seldom equal the actual results. The estimates and assumptions that have higher degree of judgment or complexity, and of items which are more likely to be materially adjusted within the next financial year are discussed below.
| 2.1 | Significant accounting estimates and changes in estimates: |
| (a) | Depreciation |
Property, plant and equipment are depreciated over their estimated useful lives. The actual lives of the assets are assessed annually and may vary depending on a number of factors. In reassessing asset lives, factors such as technological innovation, product lifecycles, life-of-mine and maintenance programs are considered.
| (b) | Goodwill |
Impairment tests of goodwill use the recoverable amounts of CGU that are determined based on value-in-use calculations.
| (c) | Valuation of Financial Instruments |
The valuation of derivative financial instruments is based on the market position provided by the counterparty financial institutions at the reporting date. Further information on financial instruments is provided in Note 5.
| (d) | Provisions for restoration obligations, environmental and equipment removal |
Estimating provisions for restoration obligations, environmental and equipment removal involves inherent uncertainty due to unknown conditions, changing governmental regulations and legal standards regarding the liabilities, the length of the clean-up periods and evolving technologies. The restoration, environmental and remediation provisions reflect the information available to management at the time of determination of the liability and are adjusted periodically as remediation efforts progress or as additional technical or legal information becomes available.
The calculation of provisions for restoration obligations, environmental and equipment removal is most sensitive to the following assumptions:
| | Current estimated costs; |
| | Inflation rates; and |
| | Discount rates. |
F-85
Table of Contents
Titan America SA and Subsidiaries
Notes to the Interim Condensed Consolidated Financial Statements
(Unaudited)
(All amounts in thousands of US$)
| 2.2 | Critical Judgments: |
| (a) | Interest in Unconsolidated Entities |
The Company has an agreement with a Special Purpose Entity (SPE) under which trade accounts receivable, originated by certain of the Companys operating subsidiaries, are aggregated and sold to the SPE (which was established to house and manage the trade accounts receivable) in exchange for cash and interest-bearing notes receivable.
Management determined the most relevant activity of the SPE to be the management of impaired trade accounts receivable within the overall portfolio of trade accounts receivable owned by the SPE, as this activity has the greatest impact on credit losses incurred, and hence, the variability of the SPEs returns. The entities most exposed to variable returns are (i) the Company which holds the most subordinated interest in the SPE, as well as the third most subordinated interest, and (ii) an unrelated party (the Control Party) which holds the second most subordinated interest and retains the right to manage the impaired accounts receivable and substantive rights to replace the Company as servicer of the SPE. As a result, the Company does not consolidate the SPE.
| (b) | Derecognition of Trade Accounts Receivable transferred to the SPE |
The Company does not consolidate the SPE, but rather sells it qualifying trade accounts receivable originated by certain of the Companys operating subsidiaries in exchange for cash and interest-bearing notes receivable. As a result of the arrangement, the Company transfers its rights to receive the cash flows from the trade accounts receivable sold to the SPE. Credit losses within the SPE are shared among the lenders to the SPE based on the seniority of their loans to the SPE. Based on the current level of bad debts in the entity and an associated analysis of the risks and rewards of receivables transferred to the SPE, the Company has concluded that it is appropriate to derecognize the receivables at the time of sale.
At September 30, 2024, expected credit losses within the SPE total $1,045, and, if realized, would be allocated first to the Companys junior subordinated note (which is fully reserved for in the accompanying financial statements) and the Control Partys intermediate subordinated note.
Additional details about the SPE can be found in Note 4.
| (c) | Determination of Lease Terms under IFRS 16 |
Extension options are included in a number of property and equipment leases across the Company. A limited number of leases contain termination options, and these are generally only exercisable by the Company. In determining the lease term, the Company considers all facts and circumstances that create an economic incentive to exercise an extension option. Extension options are only included in the lease term if the lease is reasonably certain to be extended.
In determining the lease term, the Company considers the contractual terms, termination costs and strategic importance of the assets to the operations (in addition to the significance of investments undertaken or planned in connection with leased properties). The reasonably certain assessment is only revised if a material event or a material change in circumstance occurs that is within the control of the Company.
As of September 30, 2024, potential future cash flows of $41,455 (undiscounted) were not included in the lease liability due to it not being reasonably certain that the lease terms would be extended.
F-86
Table of Contents
Titan America SA and Subsidiaries
Notes to the Interim Condensed Consolidated Financial Statements
(Unaudited)
(All amounts in thousands of US$)
3. Revenue
The components of revenue for the nine months ended September 30, 2024 and 2023 are as follows:
| 2024 | 2023 | |||||||
| Cement |
$ | 489,327 | $ | 491,571 | ||||
| Aggregates |
60,399 | 64,786 | ||||||
| Ready-mixed concrete |
557,178 | 515,846 | ||||||
| Concrete block and related products |
119,715 | 103,835 | ||||||
| Fly ash |
16,488 | 14,438 | ||||||
| Equipment and related services |
1,164 | 1,522 | ||||||
| Other goods and services |
307 | 466 | ||||||
|
|
|
|
|
|||||
| Revenue |
$ | 1,244,578 | $ | 1,192,464 | ||||
|
|
|
|
|
|||||
4. Fair value loss on accounts receivable
Net of interest earned on the note receivable and servicing and other fees paid to the Company, the Company recognized a fair value loss on sale of receivables of $4,050 and $4,937 for the nine months ended September 30, 2024 and 2023, respectively. The Company may incur losses on its notes and miscellaneous receivables due from the SPE if the amount of credit losses on the underlying receivables sold to the SPE exceeds the value of the control partys note due from the SPE by the amount of $1,310 as of September 30, 2024 ($1,565 as of December 31, 2023). The notes and miscellaneous receivables, net due from the SPE at September 30, 2024 and December 31, 2023 are $61,028 and $59,346, respectively (see Note 8), representing the Companys maximum exposure to loss from its interest in the SPE. During the nine months ended September 30, 2024 and 2023 respectively, the Company sold $952,442 and $888,060, of trade accounts receivable to the SPE.
F-87
Table of Contents
Titan America SA and Subsidiaries
Notes to the Interim Condensed Consolidated Financial Statements
(Unaudited)
(All amounts in thousands of US$)
5. Foreign exchange and derivative financial instruments
Foreign exchange gains/(losses) are comprised of gains and losses associated with the remeasurement and settlement of foreign currency denominated financial assets and liabilities. For the nine months ended September 30, 2024, the Company recorded a net foreign exchange loss of $7,467:
|
120,000 Fixed Rate Loan |
100,000 Fixed Rate Loan |
50,000 Fixed Rate Loan |
32,800 Fixed Rate Loan |
45,000 Fixed Rate Loan |
75,000 Fixed Rate Loan |
Euro Revolving Credit (RCF) |
Remeasurement and settlement of other transactions |
Total | ||||||||||||||||||||||||||||
| Foreign exchange gains/(losses) arising from: |
||||||||||||||||||||||||||||||||||||
| Remeasurement and settlement of Euro denominated loan obligations (principal) |
(1,752 | ) | (4,395 | ) | (2,342 | ) | (479 | ) | 1,485 | 2,475 | 99 | | $ | (4,909 | ) | |||||||||||||||||||||
| Remeasurement and settlement of Euro denominated loan obligations (finance cost) |
(36 | ) | (35 | ) | (17 | ) | (1 | ) | 3 | 2 | 1 | | (83 | ) | ||||||||||||||||||||||
| Other |
| | | | | | | (2,475 | ) | (2,475 | ) | |||||||||||||||||||||||||
|
|
|
|
|
|
|
|
|
|
|
|
|
|
|
|
|
|
|
|||||||||||||||||||
| Total foreign exchange (loss)/gain for the nine months ended September 30, 2024 |
$ | (1,788 | ) | $ | (4,430 | ) | $ | (2,359 | ) | $ | (480 | ) | $ | 1,488 | $ | 2,477 | $ | 100 | $ | (2,475 | ) | $ | (7,467 | ) | ||||||||||||
|
|
|
|
|
|
|
|
|
|
|
|
|
|
|
|
|
|
|
|||||||||||||||||||
| 150,000 6 year- Cross Currency Rate Swaps |
150,000 5 year- Cross Currency Rate Swaps |
50,800 Foreign Exchange Forwards |
42,000 Foreign Exchange Forwards |
30,000 Foreign Exchange Forwards |
15,000 Foreign Exchange Forwards |
Total | ||||||||||||||||||
| Derivative financial instrument gain/(loss) for the nine months ended September 30, 2024 |
$ | 2,696 | $ | 1,441 | $ | (1,940 | ) | $(1,471) | $ | (1,476 | ) | $ | (732 | ) | $(1,482) | |||||||||
|
|
|
|
|
|
|
|
|
|
|
|
|
|||||||||||||
For the nine months ended September 30, 2023, the Company recorded a net foreign exchange gain of $1,970:
| 120,000 Fixed Rate Loan |
75,000 Fixed Rate Loan |
45,000 Fixed Rate Loan |
32,800 Fixed Rate Loan |
Euro Revolving Credit Facility (RCF) |
Other | Total | ||||||||||||||||||||||
| Foreign exchange gains/(losses) arising from: |
||||||||||||||||||||||||||||
| Remeasurement and settlement of Euro denominated loan obligations (principal) |
$ | 864 | $ | 540 | $ | 324 | $ | 236 | $ | 27 | $ | | $ | 1,991 | ||||||||||||||
| Remeasurement and settlement of Euro denominated loan obligations (finance cost) |
17 | 17 | 6 | 10 | 14 | | 65 | |||||||||||||||||||||
| Other |
| | | | (86 | ) | (86 | ) | ||||||||||||||||||||
|
|
|
|
|
|
|
|
|
|
|
|
|
|
|
|||||||||||||||
| Total foreign exchange gain/(loss) for the nine months ended September 30, 2023 |
$881 | $557 | $ | 330 | $ | 246 | 41 | $ | (86 | ) | $1,970 | |||||||||||||||||
|
|
|
|
|
|
|
|
|
|
|
|
|
|
|
|||||||||||||||
F-88
Table of Contents
Titan America SA and Subsidiaries
Notes to the Interim Condensed Consolidated Financial Statements
(Unaudited)
(All amounts in thousands of US$)
5. Foreign exchange and derivative financial instruments (continued)
|
150,000 Cross Currency Interest Rate Swaps |
50,800 Foreign Exchange Forwards |
42,000 Foreign Exchange Forwards |
30,000 Foreign Exchange Forwards |
Euro Revolving Credit Facility (RCF) Forwards |
Other Foreign Exchange Forwards |
Total | ||||||||||||||||||||||
| Derivative financial instrument (loss)/gain for the nine months ended September 30, 2023 |
$ | (903 | ) | $ | (1,418 | ) | $ | (1,068 | ) | $ | (768 | ) | | $ | 2 | $ | (4,155 | ) | ||||||||||
|
|
|
|
|
|
|
|
|
|
|
|
|
|
|
|||||||||||||||
Activity within the Companys derivative financial instruments for the nine months ended September 30, 2024 and 2023 consists of the following:
| Derivative Financial Instruments - Asset/(Liability) | ||||||||||||||||||||||||||||
|
Cross Currency Interest Rate Swaps Economic Hedge |
Interest Rate Swaps |
Foreign Exchange Forwards Economic Hedge |
Natural Gas Futures Cash Flow Hedge |
Total Derivatives |
Credit Support Payments/ (Receipts) |
Net Exposure |
||||||||||||||||||||||
| January 1, 2023 |
$ | (18,196 | ) | $ | 3,711 | $ | 3,840 | $ | (2,930 | ) | $ | (13,575 | ) | $ | 15,757 | $ | 2,182 | |||||||||||
|
|
|
|
|
|
|
|
|
|
|
|
|
|
|
|||||||||||||||
| Gain/(Loss) on derivative financial instruments |
(903 | ) | | (3,253 | ) | | (4,156 | ) | | (4,156 | ) | |||||||||||||||||
| Gain/(Loss) on derivative financial instruments through OCI |
| | | (4,335 | ) | (4,335 | ) | | (4,335 | ) | ||||||||||||||||||
| Gain/(Loss) on derivative financial instruments through finance costs |
| (1,629 | ) | | | (1,629 | ) | | (1,629 | ) | ||||||||||||||||||
| Gain/(Loss) on derivative financial instruments through COGS |
| | | | | | | |||||||||||||||||||||
| Settlement of derivative financial instruments |
| 318 | (3,793 | ) | 5,774 | 2,299 | | 2,299 | ||||||||||||||||||||
| Credit support payments on derivative financial instruments, net |
| | | | | 4,448 | 4,448 | |||||||||||||||||||||
|
|
|
|
|
|
|
|
|
|
|
|
|
|
|
|||||||||||||||
| September 30, 2023 |
$ | (19,099 | ) | $ | 2,400 | $ | (3,206 | ) | $ | (1,491 | ) | $ | (21,396 | ) | $ | 20,205 | $ | (1,191 | ) | |||||||||
|
|
|
|
|
|
|
|
|
|
|
|
|
|
|
|||||||||||||||
F-89
Table of Contents
Titan America SA and Subsidiaries
Notes to the Interim Condensed Consolidated Financial Statements
(Unaudited)
(All amounts in thousands of US$)
5. Foreign exchange and derivative financial instruments (continued)
| Derivative Financial Instruments - Asset/(Liability) | ||||||||||||||||||||||||||||
| For the nine months ended September 30, 2024 |
Cross Currency Interest Rate Swaps Economic Hedge |
Interest Rate Swaps |
Foreign Exchange Forwards Economic Hedge |
Natural Gas Futures Cash Flow Hedge |
Total Derivatives |
Credit Support Payments/ (Receipts) |
Net Exposure |
|||||||||||||||||||||
| January 1, 2024 |
$ | (10,512 | ) | $ | 2,072 | $ | 5,304 | $ | 10 | $ | (3,126 | ) | $ | 4,328 | $ | 1,202 | ||||||||||||
|
|
|
|
|
|
|
|
|
|
|
|
|
|
|
|||||||||||||||
| Gain/(Loss) on derivative financial instruments |
4,137 | | (5,619 | ) | | (1,482 | ) | | (1,482 | ) | ||||||||||||||||||
| Gain/(Loss) on derivative financial instruments through OCI |
| | | (111 | ) | (111 | ) | | (111 | ) | ||||||||||||||||||
| Gain/(Loss) on derivative financial instruments through finance costs |
| 62 | | | 62 | | 62 | |||||||||||||||||||||
| Settlement of derivative financial instruments |
| (1,075 | ) | 461 | 100 | (514 | ) | | (514 | ) | ||||||||||||||||||
| Credit support payments on derivative financial instruments, net |
| | | | | 4,958 | 4,958 | |||||||||||||||||||||
|
|
|
|
|
|
|
|
|
|
|
|
|
|
|
|||||||||||||||
| September 30, 2024 |
$ | (6,375 | ) | $ | 1,059 | $ | 146 | $ | (1 | ) | $ | (5,171 | ) | $ | 9,286 | $ | 4,115 | |||||||||||
|
|
|
|
|
|
|
|
|
|
|
|
|
|
|
|||||||||||||||
The Companys risk management strategy involves the use of cross-currency and interest rate swaps, and forward foreign exchange and commodities contracts.
| | Cross-currency and interest rate swaps are used to fix the U.S. Dollar cashflows (principal and interest) associated with Euro denominated borrowings. Over the life of the instruments, there is breakage in the derivative mark-to-market and foreign exchange gain/loss on borrowings due to the employment of partial term economic hedging strategies, the impact of the yield curve and evolution of the USD/Euro exchange rate on the derivative valuations. |
| | Foreign exchange forwards are used to mitigate the variation of the USD/Euro exchange rate for short-term intervals over the life of Euro denominated borrowings. The Company monitors market expectations for the USD/Euro exchange rate and will periodically buy USD/sell Euro to offset foreign exchange variation on designated Euro denominated transactions for the duration of the forwards. Over the life of the instruments, there is breakage in the derivative mark-to-market and foreign exchange gain/loss on borrowings due to the partial term economic hedging strategies and forward points associated with the derivative valuations. |
| | Natural gas commodities futures are used to fix the variable component of certain highly probable forecasted purchases of natural gas. |
F-90
Table of Contents
Titan America SA and Subsidiaries
Notes to the Interim Condensed Consolidated Financial Statements
(Unaudited)
(All amounts in thousands of US$)
6. Property, plant, equipment and mineral deposits
Activity within property, plant, equipment and mineral deposits, as of September 30, 2024 consists of the following:
| Quarries | Land & Land Improvements |
Buildings | Machinery & equipment |
Motor vehicles |
Furniture & fixtures |
Assets under construction |
Total | |||||||||||||||||||||||||
| Opening balance |
$ | 114,537 | $ | 157,668 | $ | 59,849 | $ | 288,025 | $ | 91,030 | $ | 4,289 | $ | 85,633 | $ | 801,031 | ||||||||||||||||
| Additions |
10,935 | | | | | | 93,547 | 104,482 | ||||||||||||||||||||||||
| Disposals |
| (163 | ) | (24 | ) | (736 | ) | (701 | ) | | | (1,624 | ) | |||||||||||||||||||
| Reclassification |
21 | 5,419 | 28,912 | 42,097 | 26,821 | 877 | (104,147 | ) | | |||||||||||||||||||||||
| Provision adjustments |
431 | (6 | ) | | (129 | ) | | | | 296 | ||||||||||||||||||||||
| Capitalized interest |
| | | | | | 200 | 200 | ||||||||||||||||||||||||
| Depreciation, depletion, & amortization (DD&A) |
(7,587 | ) | (1,961 | ) | (4,327 | ) | (27,526 | ) | (15,111 | ) | (602 | ) | | (57,114 | ) | |||||||||||||||||
|
|
|
|
|
|
|
|
|
|
|
|
|
|
|
|
|
|||||||||||||||||
| Ending balance |
$ | 118,337 | $ | 160,957 | $ | 84,410 | $ | 301,731 | $ | 102,039 | $ | 4,564 | $ | 75,233 | $ | 847,271 | ||||||||||||||||
|
|
|
|
|
|
|
|
|
|
|
|
|
|
|
|
|
|||||||||||||||||
| As of September 30, 2024 |
||||||||||||||||||||||||||||||||
| Cost |
266,314 | 222,148 | 178,851 | 993,384 | 330,284 | 20,647 | 81,659 | $ | 2,093,287 | |||||||||||||||||||||||
| Accumulated DD&A |
(146,972 | ) | (59,191 | ) | (94,441 | ) | (691,284 | ) | (228,245 | ) | (16,083 | ) | (6,426 | ) | (1,242,642 | ) | ||||||||||||||||
| Impairment reserve |
(1,005 | ) | (2,000 | ) | | (369 | ) | | | | (3,374 | ) | ||||||||||||||||||||
|
|
|
|
|
|
|
|
|
|
|
|
|
|
|
|
|
|||||||||||||||||
| Net book value |
$ | 118,337 | $ | 160,957 | $ | 84,410 | $ | 301,731 | $ | 102,039 | $ | 4,564 | $ | 75,233 | $ | 847,271 | ||||||||||||||||
|
|
|
|
|
|
|
|
|
|
|
|
|
|
|
|
|
|||||||||||||||||
Activity within property, plant, equipment and mineral deposits, as of December 31, 2023 consists of the following:
| Quarries | Land & Land Improvements |
Buildings | Machinery & equipment |
Motor vehicles |
Furniture & fixtures |
Assets under construction |
Total | |||||||||||||||||||||||||
| Opening balance |
$ | 113,948 | $ | 151,346 | $ | 35,740 | $ | 283,321 | $ | 87,928 | $ | 921 | $ | 75,062 | $ | 748,266 | ||||||||||||||||
| Additions |
7,917 | | | 681 | | | 111,521 | 120,119 | ||||||||||||||||||||||||
| Disposals |
| | (255 | ) | (3,405 | ) | (339 | ) | | | (3,999 | ) | ||||||||||||||||||||
| Reclassification |
47 | 7,070 | 27,775 | 43,342 | 22,557 | 4,180 | (104,309 | ) | 662 | |||||||||||||||||||||||
| Provision adjustments |
4,778 | (32 | ) | 118 | 2,885 | | | | 7,749 | |||||||||||||||||||||||
| Capitalized interest |
| | | | | | 2,826 | 2,826 | ||||||||||||||||||||||||
| Depreciation, depletion, & amortization (DD&A) |
(11,148 | ) | (2,166 | ) | (3,529 | ) | (38,430 | ) | (19,116 | ) | (812 | ) | | (75,201 | ) | |||||||||||||||||
| Impairment reserve |
(1,005 | ) | 1,450 | | (369 | ) | | | 533 | 609 | ||||||||||||||||||||||
|
|
|
|
|
|
|
|
|
|
|
|
|
|
|
|
|
|||||||||||||||||
| Ending balance |
$ | 114,537 | $ | 157,668 | $ | 59,849 | $ | 288,025 | $ | 91,030 | $ | 4,289 | $ | 85,633 | $ | 801,031 | ||||||||||||||||
|
|
|
|
|
|
|
|
|
|
|
|
|
|
|
|
|
|||||||||||||||||
| As of December 31, 2023 |
||||||||||||||||||||||||||||||||
| Cost |
$ | 254,832 | $ | 216,944 | $ | 150,219 | $ | 957,365 | $ | 313,197 | $ | 19,248 | $ | 90,670 | $ | 2,002,475 | ||||||||||||||||
| Accumulated DD&A |
(139,290 | ) | (57,276 | ) | (90,370 | ) | (668,971 | ) | (222,167 | ) | (14,959 | ) | (5,037 | ) | (1,198,070 | ) | ||||||||||||||||
| Impairment reserve |
(1,005 | ) | (2,000 | ) | | (369 | ) | | | | (3,374 | ) | ||||||||||||||||||||
|
|
|
|
|
|
|
|
|
|
|
|
|
|
|
|
|
|||||||||||||||||
| Net book value |
$ | 114,537 | $ | 157,668 | $ | 59,849 | $ | 288,025 | $ | 91,030 | $ | 4,289 | $ | 85,633 | $ | 801,031 | ||||||||||||||||
|
|
|
|
|
|
|
|
|
|
|
|
|
|
|
|
|
|||||||||||||||||
F-91
Table of Contents
Titan America SA and Subsidiaries
Notes to the Interim Condensed Consolidated Financial Statements
(Unaudited)
(All amounts in thousands of US$)
7. Trade receivables
The components of trade receivables at September 30, 2024 and December 31, 2023 are as follows:
| September 30, 2024 |
December 31, 2023 |
|||||||
| Trade receivables |
$ | 55,411 | $ | 60,719 | ||||
| Expected credit loss allowance |
(4,574 | ) | (4,846 | ) | ||||
|
|
|
|
|
|||||
| Total trade receivables, net |
$ | 50,837 | $ | 55,873 | ||||
|
|
|
|
|
|||||
Activity within expected credit loss allowance for the nine months ended September 30, 2024 and year ended December 31, 2023 consists of the following:
| September 30, 2024 |
December 31, 2023 |
|||||||
| Balance at January 1 |
$ | (4,846 | ) | $ | (3,930 | ) | ||
| Bad debt expense for the period |
(404 | ) | (1,177 | ) | ||||
| Utilization and other adjustments |
676 | 261 | ||||||
|
|
|
|
|
|||||
| Balance at end of the Period |
$ | (4,574 | ) | $ | (4,846 | ) | ||
|
|
|
|
|
|||||
8. Other receivables
The components of other receivables at September 30, 2024 and December 31, 2023 are as follows:
| September 30, 2024 |
December 31, 2023 |
|||||||
| Receivables due from SPE, net (Note 4) |
61,028 | 59,346 | ||||||
| Receivables, non-trade |
3,284 | 3,473 | ||||||
| Reserve for receivables, non-trade |
(2,402 | ) | (2,602 | ) | ||||
| Rebates and refunds due |
633 | 742 | ||||||
| Reimbursements |
68 | 746 | ||||||
| Deposits |
430 | 514 | ||||||
| Other |
4,876 | 2,902 | ||||||
|
|
|
|
|
|||||
| Total other receivables, net |
$ | 67,917 | $ | 65,121 | ||||
|
|
|
|
|
|||||
9. Inventories
The components of inventories at September 30, 2024 and December 31, 2023 are as follows:
| September 30, 2024 |
December 31, 2023 |
|||||||
| Finished goods |
$ | 72,522 | $ | 63,809 | ||||
| Spare parts |
60,810 | 61,833 | ||||||
| Work in process |
37,214 | 32,823 | ||||||
| Raw materials |
27,769 | 22,641 | ||||||
| Manufacturing supplies and other |
10,148 | 8,883 | ||||||
|
|
|
|
|
|||||
| Total Inventory |
$ | 208,463 | $ | 189,989 | ||||
|
|
|
|
|
|||||
F-92
Table of Contents
Titan America SA and Subsidiaries
Notes to the Interim Condensed Consolidated Financial Statements
(Unaudited)
(All amounts in thousands of US$)
9. Inventories (continued)
Reserves for the write-downs of inventories to net realizable value were $291 and $816 as of September 30, 2024 and December 31, 2023, respectively. Further, the reversals of write-downs of inventories to net realizable value totaled $525 and $1,451 during the nine months ended September 30, 2024 and September 30, 2023, respectively, due to improved productions efficiencies during the periods.
10. Credit facilities and long-term debt
The carrying amount and the fair value of the Companys debt obligations, including leases, at September 30, 2024, is as follows:
| September 30, 2024 | ||||||||
| Carrying Amount | Fair Value | |||||||
| Current |
||||||||
| Loans from third parties |
10 | 10 | ||||||
| Loans from related parties |
141,807 | 141,440 | ||||||
| Lease liabilities |
11,901 | 11,560 | ||||||
|
|
|
|
|
|||||
| $ | 153,718 | $ | 153,010 | |||||
| Non-current |
||||||||
| Loans from related parties |
$ | 227,858 | $ | 227,851 | ||||
| Lease liabilities |
57,615 | 45,148 | ||||||
|
|
|
|
|
|||||
| $ | 285,473 | $ | 272,999 | |||||
|
|
|
|
|
|||||
| Total borrowings |
$ | 439,190 | $ | 426,009 | ||||
|
|
|
|
|
|||||
The carrying amount and the fair value of the Companys debt obligations, including leases, at December 31, 2023, is as follows:
| December 31, 2023 | ||||||||
| Carrying Amount | Fair Value | |||||||
| Current |
||||||||
| Loans from third parties |
$ | 2 | $ | 2 | ||||
| Loans from related parties |
267,668 | 264,446 | ||||||
| Lease liabilities |
11,737 | 11,395 | ||||||
|
|
|
|
|
|||||
| $ | 279,407 | $ | 275,843 | |||||
| Non-current |
||||||||
| Loans from related parties |
$ | 76,262 | $ | 75,330 | ||||
| Lease liabilities |
53,744 | 41,246 | ||||||
|
|
|
|
|
|||||
| $ | 130,006 | $ | 116,576 | |||||
|
|
|
|
|
|||||
| Total borrowings |
$ | 409,413 | $ | 392,419 | ||||
|
|
|
|
|
|||||
F-93
Table of Contents
Titan America SA and Subsidiaries
Notes to the Interim Condensed Consolidated Financial Statements
(Unaudited)
(All amounts in thousands of US$)
10. Credit facilities and long-term debt (continued)
In April 2017, the Company entered into a 250,000 multicurrency revolving credit facility with TGF, bearing interest at variable rates and maturing on January 30, 2022. In July 2019, the agreement was amended to increase the facility to 340,000. In April 2020, the facility was reduced to 100,000 by an amendment dated April 29, 2020. In January 2022 the agreement maturity date was extended to January 30, 2026. In July 2024, the facility was increased to 130,000. At September 30, 2024 and December 31, 2023, there was $24,071 (21,500 equivalent) and $40,333 outstanding borrowings respectively under the facility.
The Company has a committed borrowing facility with a bank of $45,000 with $15,000 available for the issuance of letters of credit. The maturity date of this facility is March 15, 2025. The facility provides for daily drawdowns and repayments at a borrowing rate based on SOFR. In connection with the borrowing facility, the Company has agreed to financial covenants related to operating EBITDA, tangible net worth and maintenance of a committed line of credit as well as non-financial covenants including restrictions on incurring certain liens on or disposing of certain existing assets without notification to the lender. As of September 30, 2024, the Company was in compliance with all the covenants. The facility is guaranteed by TCI. At September 30, 2024 and December 31, 2023, there were $0 and $0 borrowings respectively under the facility.
The Company has an uncommitted borrowing facility with a bank of $40,000 with the full amount available for the issuance of letters of credit. The maturity date of this facility is December 20, 2024. The facility provides for loans at variable interest rates based on SOFR which are reset periodically depending on the term and type of draw made thereunder. In connection with the borrowing facility, the Company has agreed to certain covenants including restrictions on incurring certain liens on or disposing of certain existing assets without notification to the lender. As of September 30, 2024, the Company was in compliance with all of the covenants. The facility is guaranteed by TCI. At September 30, 2024 and December 31, 2023, there were $0 and $0 outstanding borrowings respectively under the facility.
The Company has an uncommitted borrowing facility with a bank of $60,000. In April 2024, the maturity date of this facility was extended to April 29, 2025. The facility provides for loans at variable interest rates based on SOFR which are reset periodically depending on the term and type of draw made thereunder. In connection with the borrowing facility, the Company has agreed to certain covenants including restrictions on disposing of certain existing assets without notification to the lender. The facility is guaranteed by TCI. At September 30, 2024 and December 31, 2023, there was $0 and $0 outstanding borrowings respectively under the facility.
In December 2017, the Company entered into a 150,000 note payable with TGF bearing interest of 3.07% through July 16, 2021 and 3.15% through the maturity date of November 15, 2024. In December 2022 the interest rate was modified to 3.05% through the maturity date of November 15, 2024. In April 2022 the Company paid back 30,000 of this note leaving a 120,000 balance as of September 30, 2024 and December 31, 2023.
In March 2018, the Company entered into a 75,000 note payable with the TGF bearing interest at 3.15% and maturing on November 15, 2024. In December 2022 the interest rate was modified to 3.05% through the maturity date of November 15, 2024. In April 2024, the note was amended to increase the principal to 100,000, modify the interest rate to 4.80%, and extend the maturity date to June 11, 2029.
F-94
Table of Contents
Titan America SA and Subsidiaries
Notes to the Interim Condensed Consolidated Financial Statements
(Unaudited)
(All amounts in thousands of US$)
10. Credit facilities and long-term debt (continued)
In June 2021 the Company entered into two separate loans with TGF. The first loan was a 45,000 note payable bearing interest at 3.15% and maturing on November 14, 2024. In December 2022 the interest rate was modified to 3.05% through the maturity date of November 14, 2024. In April 2024, the loan was amended to increase the principal to 50,000, modify the interest rate to 4.80% and extend the maturity date to June 11, 2029. The second loan was a 32,800 note payable bearing interest at 3.35% and maturing on July 7, 2027.
On February 1, 2024, the Company entered into a cash management agreement with TGF. The agreement is effective until either party provides written notice of termination. Pursuant to this agreement, the Companys two existing HSBC UK bank accounts, one denominated in U.S. dollars and one denominated in Euros, are funded when there are negative daily balances. Fundings are subject to maximum borrowing limits of $15,000 and 15,000, respectively. Conversely, when there are cash balances in either account, these funds are swept as a deposit into the TGF concentration account. There are no deposit limits.
With respect to borrowings made under the cash management agreement, the Company bears a daily interest charge based on the benchmark rates of the European Central Bank (ECB) Main Refinancing Rate (for Euro borrowings) and the U.S. Federal Reserve Federal Funds Target Rate (for U.S. dollar borrowings), plus an applicable margin.
With respect to deposits made under the cash management agreement, the Company receives a daily interest credit based on the benchmark interest rates of the ECB Deposit Facility Rate (for Euro deposits) and the U.S. Federal Reserve Federal Funds Target Rate (for U.S. dollar deposits), minus an applicable margin.
Company funds on deposit with TGF under the cash management agreement are due upon demand from the Company. Amounts borrowed from TGF under the cash management agreement may be repaid (in whole or in any part) at the discretion of the Company. Following written notice of termination, outstanding borrowings from TGF under the cash management agreement are due upon demand from TGF.
The Company maintains letter of credit facilities with banks, which are guaranteed by TCI. No amounts were drawn against the letters of credit at September 30, 2024 and December 31, 2023. At September 30, 2024 and December 31, 2023, the banks had issued letters of credit on behalf of the Company totaling $12,652 and $12,534, respectively, as shown below:
| September 30, 2024 |
December 31, 2023 |
|||||||
| Facility amount |
$ | 55,000 | $ | 55,000 | ||||
| Less letters of credit issued in support of: |
||||||||
| Casualty, liability, and workers compensation |
||||||||
| insurance programs |
(12,199 | ) | (12,199 | ) | ||||
| Performance obligations |
(218 | ) | (100 | ) | ||||
| Other payment obligations |
(235 | ) | (235 | ) | ||||
|
|
|
|
|
|||||
| Available facility amount |
$ | 42,348 | $ | 42,466 | ||||
|
|
|
|
|
|||||
F-95
Table of Contents
Titan America SA and Subsidiaries
Notes to the Interim Condensed Consolidated Financial Statements
(Unaudited)
(All amounts in thousands of US$)
10. Credit facilities and long-term debt (continued)
In addition to the letter of credit facilities described above, the Company maintains a performance bond facility with an insurance company, which is guaranteed by TCI. No amounts were drawn against the performance bonds at September 30, 2024 and December 31, 2023. At September 30, 2024 and December 31, 2023, the insurance company had issued performance bonds on behalf of the Company totaling $35,717 and $35,140, respectively, as shown below:
| September 30, 2024 |
December 31, 2023 |
|||||||
| Facility amount |
$ | 60,000 | $ | 60,000 | ||||
| Less performance bonds issued in support of: |
||||||||
| Excavation and reclamation obligations |
(5,017 | ) | (4,954 | ) | ||||
| Surety bond |
(3,629 | ) | (3,629 | ) | ||||
| Other payment and performance obligations |
(27,071 | ) | (26,557 | ) | ||||
|
|
|
|
|
|||||
| Available facility amount |
$ | 24,283 | $ | 24,860 | ||||
|
|
|
|
|
|||||
11. Income taxes
Income tax expense is recognized based on managements estimate of the weighted average effective annual income tax rate expected for the full financial year. The estimated average annual tax rate used for the nine months ended September 30, 2024 is 25.3%, compared to 25.9% for the nine months ended September 30, 2023.
The components of income tax expense for the nine months ended September 30, 2024 and 2023 are as follows:
| September 30, 2024 |
September 30, 2023 |
|||||||
| Current income tax: |
||||||||
| Current income tax expense |
$ | 44,336 | $ | 29,406 | ||||
| Adjustments in respect of previous years |
30 | (27 | ) | |||||
| Deferred income tax: |
||||||||
| Deferred tax expense relating to origination and reversal of temporary differences |
(467 | ) | 9,048 | |||||
|
|
|
|
|
|||||
| Income tax expense |
$ | 43,899 | $ | 38,427 | ||||
|
|
|
|
|
|||||
Pillar Two legislation has been substantively enacted in Belgium where the Company is tax resident and in Greece which is the tax residency of the owner (Titan Atlantic) of Titan America LLC. The legislation is effective for the Companys financial year beginning January 1, 2024.
Under the Pillar Two legislation, the Company is liable to pay a top-up tax for the difference between its Global Anti-Base Erosion Rules effective tax rate per jurisdiction where it operates and the 15% minimum rate (as defined under Pillar Two). The top-up tax for a particular jurisdiction would be reduced to zero, if at least one of three criteria, the so-called Transitional Country-by-Country Reporting (CbCR) Safe Harbour Rules, is met. These Transitional CbCR Safe Harbour Rules are temporarily applicable until the financial year beginning on or before December 31, 2026.
F-96
Table of Contents
Titan America SA and Subsidiaries
Notes to the Interim Condensed Consolidated Financial Statements
(Unaudited)
(All amounts in thousands of US$)
11. Income taxes (continued)
As of September 30, 2024, the Company has made an assessment of its potential exposure to Pillar Two.
The Companys assessment indicates that:
| | In Belgium, there is no top-up tax exposure due to the nature of the Companys income (dividend income) which is excluded from taxation under Pillar Two legislation. |
| | In Greece and in the US, the Simplified Pillar Two effective tax rate is above 15% and/or at least one of the other Transitional CbCR Safe Harbour tests is met. |
Based on the above, the Company does not anticipate any impact from Pillar Two legislation. The Company has applied the recent amendment to IAS 12 which provides temporary relief to the recognition of deferred taxes related to top-up income taxes.
12. Related party transactions
The following is a summary of the transactions that were carried out with related parties during the nine months ended September 30, 2024:
| September 30, 2024 | ||||||||
| Purchases and charges from related parties |
Amounts owed to related parties, net |
|||||||
| Financing (Note 10) |
$ | 10,407 | $ | 369,182 | ||||
| Purchase of cement |
80,831 | 4,904 | ||||||
| Management fee |
10,176 | 3,561 | ||||||
| Other |
1,758 | 1,282 | ||||||
|
|
|
|
|
|||||
| $ | 103,172 | $ | 378,929 | |||||
|
|
|
|
|
|||||
The following is a summary of the transactions that were carried out with related parties during the nine months ended September 30, 2023 and for the year ended December 31, 2023:
| September 30, 2023 | December 31, 2023 | |||||||
| Purchases and charges from related parties |
Amounts owed to related parties, net |
|||||||
| Financing (Note 10) |
$ | 8,594 | $ | 342,857 | ||||
| Purchase of cement |
75,807 | 6,281 | ||||||
| Management fee |
7,432 | 3,659 | ||||||
| Other |
2,147 | 1,527 | ||||||
|
|
|
|
|
|||||
| $ | 93,980 | $ | 354,324 | |||||
|
|
|
|
|
|||||
Outstanding balances as of September 30, 2024 and December 31, 2023 related to purchases from related parties are unsecured and interest free and settlement occurs in cash. There have been no guarantees provided or received for any related party receivables or payables.
F-97
Table of Contents
Titan America SA and Subsidiaries
Notes to the Interim Condensed Consolidated Financial Statements
(Unaudited)
(All amounts in thousands of US$)
12. Related party transactions (continued)
Dividends/Return of capital
On July 15 and 18, 2024, Titan Atlantic declared and paid dividends of $80,000 (73,450 euro equivalent) and $5,067 (4,635 euro equivalent), respectively, to Titan Cement Company S.A. and Columbus Properties BV.
Key Management Compensation
Key management compensation expense, which includes all payroll-related expenses for vice-president level positions and higher for the periods ended September 30, 2024 and 2023 is as follows:
| September 30, | ||||||||
| 2024 | 2023 | |||||||
| Salaries and related payroll taxes |
$ | 10,927 | $ | 9,664 | ||||
| Short-term employee benefits |
529 | 488 | ||||||
| Retirement plan contributions |
207 | 199 | ||||||
| Long-term incentives, including share-based payments |
2,302 | 1,889 | ||||||
| Termination benefits |
21 | | ||||||
| Other |
| 25 | ||||||
|
|
|
|
|
|||||
| Total key management compensation |
$ | 13,986 | $ | 12,265 | ||||
|
|
|
|
|
|||||
| Number of key management employees, end of period |
25 | 25 | ||||||
13. Commitments and contingencies
Litigation
On the basis of its own estimates (and both internal and external legal counsel), Management is of the opinion that it is remote that material losses will be incurred in respect of claims in excess of provisions that have been made in these interim condensed consolidated financial statements.
Environmental Remediation
The Company is subject to certain environmental regulations and normal business operations may cause conditions requiring remedial action. Management has provided for all known, probable and estimable costs related to such occurrences.
Purchase Commitments
Office Lease
In June 2023, Titan Florida LLC signed a 11 year and 7 month lease for new office space in Deerfield, Florida. The lease commencement date was July 2024 with an initial lease liability of $8,438. Lease payments exclude variable operating expenses which will be expensed as incurred. The lease payments are subject to an annual 3% increase and include two five-year renewal options with lease payments determined at fair market value (FMV) as such time of each renewal. Titan America LLC has concluded these renewal options are not reasonably certain and therefore are excluded from the initial valuation of the expected lease liability.
F-98
Table of Contents
Titan America SA and Subsidiaries
Notes to the Interim Condensed Consolidated Financial Statements
(Unaudited)
(All amounts in thousands of US$)
14. Financial risk management objectives and policies
Liquidity risk
Prudent liquidity risk management implies maintaining sufficient cash and cash equivalents, the availability of funding through an adequate amount of committed credit facilities and the ability to close out market positions. Due to the dynamic nature of the underlying businesses, the Company aims to maintain flexibility in funding by having both committed and uncommitted credit lines available.
The table below summarizes the maturity profile of financial liabilities at September 30, 2024 based on contractual undiscounted payments.
| Less than 6 months |
6 to 12 months |
1 to 5 years | >5 years | Total | ||||||||||||||||
| Loans from related parties |
141,190 | 4,646 | 263,439 | | $ | 409,275 | ||||||||||||||
| Lease liabilities |
6,998 | 6,998 | 37,584 | 32,391 | 83,971 | |||||||||||||||
| Derivative financial instruments |
10,025 | 1,428 | 4,455 | | 15,908 | |||||||||||||||
| Other non-current liabilities |
| | 307 | | 307 | |||||||||||||||
| Trade and other payables |
134,237 | | | | 134,237 | |||||||||||||||
|
|
|
|
|
|
|
|
|
|
|
|||||||||||
| $ | 292,450 | $ | 13,072 | $ | 305,785 | $ | 32,391 | $ | 643,698 | |||||||||||
|
|
|
|
|
|
|
|
|
|
|
|||||||||||
The table below summarizes the maturity profile of financial liabilities at December 31, 2023 based on contractual undiscounted payments.
| Less than 6 months |
6 to 12 months |
1 to 5 years | >5 years | Total | ||||||||||||||||
| Loans from related parties |
$ | 4,676 | $ | 269,876 | $ | 80,457 | $ | | $ | 355,009 | ||||||||||
| Lease liabilities |
6,053 | 6,053 | 34,403 | 26,824 | 73,333 | |||||||||||||||
| Derivative financial instruments |
2,706 | 16,621 | | | 19,327 | |||||||||||||||
| Other non-current liabilities |
| | 114 | | 114 | |||||||||||||||
| Trade and other payables |
162,696 | | | | 162,696 | |||||||||||||||
|
|
|
|
|
|
|
|
|
|
|
|||||||||||
| $ | 176,131 | $ | 292,550 | $ | 114,974 | $ | 26,824 | $ | 610,479 | |||||||||||
|
|
|
|
|
|
|
|
|
|
|
|||||||||||
Derivatives
On April 29, 2024, the Company entered into 5-year cross-currency interest rate swap agreements with third party financial institutions to manage the foreign currency and interest rate risk associated with the aforementioned fixed rate Euro denominated borrowings. Under the terms of these agreements, the counterparties fixed the June 11, 2029, U.S. Dollar to Euro exchange rate for the scheduled 150,000 repayment at $1.07213 to 1.00. In addition, over the life of the agreements, the Company will receive Euro denominated fixed rate interest on 150,000 and pay U.S. Dollar denominated fixed rate interest on $160,820.
F-99
Table of Contents
Titan America SA and Subsidiaries
Notes to the Interim Condensed Consolidated Financial Statements
(Unaudited)
(All amounts in thousands of US$)
14. Financial risk management objectives and policies (continued)
Financial instruments by measurement category
As of September 30, 2024 and December 31, 2023, the Companys financial assets were classified as follows:
| September 30, 2024 | December 31, 2023 | |||||||||||||||
| Assets at amortized cost |
Assets at FVPL* |
Assets at amortized cost |
Assets at FVPL* |
|||||||||||||
| Financial Assets |
||||||||||||||||
| Trade receivables, net |
$ | 50,837 | $ | | $ | 55,873 | $ | | ||||||||
| Other receivables, net |
67,917 | | 65,121 | | ||||||||||||
| Non-current assets |
| 5,136 | | 5,547 | ||||||||||||
| Derivative financial instruments |
| 3,268 | | 7,386 | ||||||||||||
| Derivative credit support payments |
12,360 | | 11,470 | | ||||||||||||
| Cash and cash equivalents |
12,149 | | 22,036 | | ||||||||||||
|
|
|
|
|
|
|
|
|
|||||||||
| $ | 143,263 | $ | 8,404 | $ | 154,500 | $ | 12,933 | |||||||||
|
|
|
|
|
|
|
|
|
|||||||||
As of September 30, 2024 and December 31, 2023, the Companys financial liabilities were classified as follows:
| September 30, 2024 | December 31, 2023 | |||||||||||||||
| Liabilities at amortized cost |
Liabilities at FVPL* |
Liabilities at amortized cost |
Liabilities at FVPL* |
|||||||||||||
| Financial Liabilities |
||||||||||||||||
| Accounts payable |
$ | 124,490 | $ | | $ | 151,229 | $ | | ||||||||
| Accounts payable, related parties |
9,747 | | 11,467 | | ||||||||||||
| Borrowings |
369,674 | | 343,932 | | ||||||||||||
| Derivative financial instruments-economic hedges |
| 8,436 | | 10,512 | ||||||||||||
| Derivative credit support receipts |
3,075 | | 7,142 | | ||||||||||||
| Other noncurrent liabilities |
307 | | 114 | | ||||||||||||
|
|
|
|
|
|
|
|
|
|||||||||
| $ | 507,293 | $ | 8,436 | $ | 513,884 | $ | 10,512 | |||||||||
|
|
|
|
|
|
|
|
|
|||||||||
| * | FVPL Fair value through profit or loss |
| ** | FVOCI Fair value through comprehensive income |
Fair value of financial instruments
Recurring fair value measurements
Recurring fair value measurements are those that the accounting standards require or permit in the statement of financial position at the end of each reporting period. The Companys derivative financial instruments fall under this category, and under the fair value hierarchy, are measured based on Level 2 inputs.
Level 2 derivative financial instruments comprise cross currency interest rate swaps, interest rate swaps, foreign exchange forward contracts and natural gas futures. The Company uses a variety of valuation methods and makes assumptions that are based on market conditions existing at each reporting date. The recorded fair values of these contracts are based on: a) forward exchange rates that are quoted in an active
F-100
Table of Contents
Titan America SA and Subsidiaries
Notes to the Interim Condensed Consolidated Financial Statements
(Unaudited)
(All amounts in thousands of US$)
14. Financial risk management objectives and policies (continued)
market, b) forward interest rates extracted from observable yield curves, and c) natural gas prices extracted from observable yield curves, which are quoted in an active market. There were no changes in valuation techniques for Level 2 recurring fair value measurements during the nine months ended September 30, 2024 or year ended December 31, 2023.
Financial instruments for which fair value does not approximate carrying amount
Financial instruments where fair value is not deemed to approximate carrying amount in the statement of financial position are the Companys loans from related parties and lease liabilities. The fair values are disclosed in Note 10.
| | Loans from related parties the fair value of loans from related parties are measured based on Level 3 inputs. The valuation models incorporate parameters such as interest rates and price quotations at the reporting date. With respect to long-term borrowings, quoted market prices or dealer quotes for the specific or similar instruments are also used. |
| | Lease liabilities the fair value of lease liabilities is measured based on Level 2 inputs. The valuation model incorporates interest rates observable at commonly quoted intervals used to recalculate remaining lease payments based on current incremental borrowing rates. |
15. Earnings per share
Basic earnings per share is calculated by dividing net income attributable to ordinary equity holders of the Company (the numerator) by the weighted average number of shares outstanding (the denominator) during the period. During the periods presented the Company has no financial instruments or stock awards that dilute earnings per share.
The amounts considered for calculations of earnings per share for the nine months ended September 30, 2024 and 2023 were as follows:
| Nine Months Ended September 30, | ||||||||
| 2024 | 2023 | |||||||
| Denominator (whole shares) |
||||||||
| Weighted average number of common stock - basic and diluted |
175,362,465 | 175,362,465 | ||||||
|
|
|
|
|
|||||
| Numerator |
||||||||
| Net income |
$ | 129,546 | $ | 109,800 | ||||
|
|
|
|
|
|||||
| Earnings per share of common stock |
||||||||
| Basic earnings per share |
$ | 0.74 | $ | 0.63 | ||||
| Diluted earnings per share |
$ | 0.74 | $ | 0.63 | ||||
|
|
|
|
|
|||||
| (1) | For purposes of calculating earnings per share the Company has retrospectively presented earnings per share as if the reorganization in Note 1 had occurred at the beginning of the earliest period presented. Such retrospective presentation reflects 175,362,465 common shares due to the exchange of shares in Titan Atlantic for 175,342,465 shares in Titan America, the initial issuance of 2,000 common shares upon formation of Titan America and the subsequent conversion of each of the 2,000 common shares into 10 common shares. |
F-101
Table of Contents
Titan America SA and Subsidiaries
Notes to the Interim Condensed Consolidated Financial Statements
(Unaudited)
(All amounts in thousands of US$)
16. Segment information
Description of Segments and Principal Activities
The Company operates its business through two reportable segments based on US geographic regions: the Florida and Mid Atlantic business segments. Each region has a regional president who is a member of the Executive Committee and reports directly to the Companys CEO, who is the chief operating decision maker (CODM). The core business activities of the two regions are substantially the same and encompass the manufacture, distribution, and sale of a comprehensive range of cement, construction aggregates, ready-mix concrete, concrete blocks, and fly ash.
In addition, the Companys operations include (1) the STET segment, a nonreportable operating segment that develops, manufactures, sells and services tribo-electrostatic separators and related equipment used to beneficiate fly ash, industrial minerals, and food and feed organics and (2) certain income and expense items managed on a total Company level which are not allocated to the operating segment measure of profit and loss, including: unallocated corporate costs, fair value loss on sale of accounts receivable, finance cost, finance income, foreign exchange gain/loss, derivative financial instrument gain/ loss, and income taxes.
The CODM evaluates segment performance based on earnings before interest, taxes, depreciation, amortization & impairment (adjusted EBITDA). The adjusted EBITDA calculation includes the operating profit plus depreciation, amortization and impairment of tangible and intangible assets. This measure excludes the unallocated corporate costs summarized above. The CODM also receives information about the segments external revenue, capital spending, and depreciation and amortization on a regular basis.
Information about segment adjusted EBITDA, revenue, depreciation, depletion and amortization and capital spending follows:
Segment Adjusted EBITDA
| Nine Months Ended September 30, | ||||||||
| 2024 | 2023 | |||||||
| Florida business segment |
196,962 | 159,730 | ||||||
| Mid-Atlantic business segment |
100,537 | 89,033 | ||||||
|
|
|
|
|
|||||
| Subtotal reportable segments |
$ | 297,499 | $ | 248,763 | ||||
|
|
|
|
|
|||||
| STET segment |
(4,436 | ) | (4,472 | ) | ||||
| Unallocated Corporate(1) |
(15,697 | ) | (3,155 | ) | ||||
| Finance cost, net |
(18,835 | ) | (19,156 | ) | ||||
| Depreciation, depletion and amortization |
(69,024 | ) | (63,798 | ) | ||||
| Loss on disposal of fixed assets |
(1,454 | ) | (736 | ) | ||||
| Foreign exchange (loss)/gain, net |
(7,467 | ) | 1,970 | |||||
| Derivative financial instrument loss, net |
(1,482 | ) | (4,155 | ) | ||||
| Fair value loss on sale of accounts receivable, net |
(4,050 | ) | (4,937 | ) | ||||
| Share-based compensation |
(2,875 | ) | (2,364 | ) | ||||
| Other |
1,266 | 267 | ||||||
|
|
|
|
|
|||||
| Income before income taxes |
$ | 173,445 | $ | 148,227 | ||||
|
|
|
|
|
|||||
| (1) | Unallocated Corporate includes IPO transaction costs incurred during the nine months ended September 30, 2024, which primarily consist of consulting, legal, and accounting fees. |
F-102
Table of Contents
Titan America SA and Subsidiaries
Notes to the Interim Condensed Consolidated Financial Statements
(Unaudited)
(All amounts in thousands of US$)
16. Segment information (continued)
Segment External Revenue
External sales are transactions with external customers for each of the business segments.
| Nine Months Ended September 30, | ||||||||
| 2024 | 2023 | |||||||
| Florida business segment |
$ | 762,373 | $ | 729,314 | ||||
| Mid-Atlantic business segment |
481,041 | 461,628 | ||||||
| STET segment |
1,164 | 1,522 | ||||||
|
|
|
|
|
|||||
| Total External Revenue |
$ | 1,244,578 | $ | 1,192,464 | ||||
|
|
|
|
|
|||||
Segment Depreciation, Depletion and Amortization
Depreciation, depletion and amortization per segment is as follows:
| Nine Months Ended September 30, | ||||||||
| 2024 | 2023 | |||||||
| Florida business segment |
$ | 41,744 | $ | 39,341 | ||||
| Mid-Atlantic business segment |
26,761 | 24,000 | ||||||
| STET segment |
507 | 445 | ||||||
| Corporate |
12 | 12 | ||||||
|
|
|
|
|
|||||
| Total depreciation, depletion and amortization |
$ | 69,024 | $ | 63,798 | ||||
|
|
|
|
|
|||||
Segment Capital Spending
Capital spending is investment in long-term assets and intangibles (e.g. software), excluding additions to quarries.
| Nine Months Ended September 30, | ||||||||
| 2024 | 2023 | |||||||
| Florida business segment |
$ | 55,804 | $ | 49,666 | ||||
| Mid-Atlantic business segment |
41,137 | 30,599 | ||||||
| STET segment |
(1 | ) | 84 | |||||
| Corporate |
313 | 613 | ||||||
|
|
|
|
|
|||||
| Total Capital Spending |
$ | 97,253 | $ | 80,962 | ||||
|
|
|
|
|
|||||
17. Events after the reporting period
Management has evaluated subsequent events through December 20, 2024, which is the date these financial statements were available to be issued:
| | On October 20, 2024, the Company purchased D.M. Conner, Inc. a Virginia quarry business, for a base purchase of $4,400 less indebtedness. In addition, the Company purchased the associated land on which the quarry operates for an additional base purchase price of $800. As the transaction recently closed, the Company is still in the process of completing the accounting related to the acquisition. |
F-103
Table of Contents
Titan America SA and Subsidiaries
Notes to the Interim Condensed Consolidated Financial Statements
(Unaudited)
(All amounts in thousands of US$)
17. Events after the reporting period (continued)
| | On October 25, 2024, Titan Atlantic declared and paid a return of capital of $51,591 (47,819 euro equivalent) to TCI. The return of capital was funded through a combination of drawdowns on short-term third party and short-term and long-term related party credit facilities. |
| | On November 15, 2024, the Company executed a 150,000 note payable with TGF bearing interest at 3.20% and maturing on July 7, 2027. The proceeds of this note were used to settle the 120,000 note maturing November 15, 2024, and 30,000 of the multicurrency revolving credit facility with TGF. |
| | On November 18, 2024, the Company entered into 30-month cross-currency interest rate swap agreements with third party financial institutions to manage the foreign currency and interest rate risk associated with the aforementioned fixed rate Euro denominated borrowings. Under the terms of these agreements, the counterparties fixed the July 7, 2027, U.S. Dollar to Euro exchange rate for the scheduled 150,000 repayment at $1.05383 to 1.00. In addition, over the life of the agreements, the Company will receive Euro denominated fixed rate interest on 150,000 and pay U.S. Dollar denominated fixed rate interest on $158,075. |
| | On December 18, 2024, Titan Americas 2,000 common shares, without nominal value, were converted into 20,000 common shares, without nominal value at a ten to one ratio (the Share Split). Following the Share Split, the derived value of Titan Americas outstanding common shares was $10.00 per share. |
| | On December 18, 2024, TCI contributed 100% of its equity interest in Titan Atlantic to Titan America in exchange for 175,342,465 common shares, which was treated as a reorganization under common control. As a result, the following adjustments will be recorded by the Company within equity: |
| | Common Stock will be adjusted to reflect the $10.00 derived value of Titan Americas common shares multiplied by common shares outstanding; and |
| | Share Premium will be adjusted to reflect an issue premium multiplied by the number of common shares issued by Titan America in the Reorganization Transaction, less the value of the Companys retained earnings; and |
| | A Common Control Reserve will be established within equity to adjust the Companys Total Stockholders Equity balance to the carrying value of Total Stockholders Equity immediately prior to the Reorganization Transaction. |
No other material matters were identified impacting the Companys financial position or requiring further disclosure.
F-104
Table of Contents
24,000,000 Shares
Titan America SA
Common Shares
PRELIMINARY PROSPECTUS
, 2025
Citigroup
Goldman Sachs & Co. LLC
BofA Securities
BNP PARIBAS
Jefferies
HSBC
SOCIETE GENERALE
Stifel
Until , 2025 (25 days after the date of this prospectus), all dealers that effect transactions in these shares of our common shares, whether or not participating in this offering, may be required to deliver a prospectus. This is in addition to the dealers obligation to deliver a prospectus when acting as underwriters and with respect to their unsold allotments or subscriptions.
Table of Contents
PART II
INFORMATION NOT REQUIRED IN PROSPECTUS
Item 6. Indemnification of Office Holders (Including Directors).
Under Belgian law, the directors of a company may be liable for damages to our Company in case of improper performance of their duties. Our directors may be liable to our Company and to third parties for infringement of our articles of association, the Belgian Code on Companies and Associations or, under certain circumstances, Belgian tort, bankruptcy, social security or tax laws. Under certain circumstances, directors may be criminally liable.
The Belgian Code on Companies and Associations sets a cap on the amount for which directors and persons entrusted with the daily management of a Belgian company can be held liable for damages. This cap ranges from EUR 125,000 to EUR 12,000,000 depending on the turnover and balance sheet of the relevant company. The cap is applicable both towards the Company itself and as to third parties. The cap benefits the group of directors and persons entrusted with the daily management who are the subject of the claim for damages as a whole and applies to each fact or set of facts likely to give rise to liability, regardless of the number of claimants or actions. The cap does not apply in case of habitual minor errors (i.e. a minor error which has been committed frequently and not occasionally), serious errors, fraudulent intent or intent to harm, and other specific exceptions.
We maintain liability insurance for our directors and officers, including insurance against liability under the Securities Act of 1933, as amended, and we intend to enter into agreements with our directors and executive officers to provide contractual indemnification. With certain exceptions and subject to limitations on indemnification under Belgian law, these agreements (i) with executive officers will provide for indemnification for damages and expenses including, among other things, attorneys fees, judgments, fines and settlement amounts incurred by any of these individuals in any action or proceeding arising out of his or her actions in that capacity and (ii) with directors or persons entrusted with daily management will only provide for indemnification for attorneys fees and other expenses incurred by any of these individuals in any action or proceeding arising out of his or her actions in that capacity.
These agreements may discourage shareholders from bringing a lawsuit against our directors and executive officers for breach of their fiduciary duty. These provisions also may have the effect of reducing the likelihood of derivative litigation against directors and executive officers, even though such an action, if successful, might otherwise benefit us and our shareholders. Furthermore, a shareholders investment may be adversely affected to the extent we pay the costs of settlement and damage awards pursuant to these indemnification agreements.
Certain of our non-employee directors may, through their relationships with their employers or partnerships, be insured and/or indemnified against certain liabilities in their capacity as members of our board of directors.
In the underwriting agreement, the form of which will or is to be filed as Exhibit 1.1 to this registration statement, the underwriters will agree to indemnify, under certain conditions, us, the members of our board of directors and persons who control our Company within the meaning of the Securities Act against certain liabilities, but only to the extent that such liabilities are caused by information relating to the underwriters furnished to us in writing expressly for use in this registration statement and certain other disclosure documents.
Certain of our non-employee directors may, through their relationships with their employers or partnerships, be insured and/or indemnified against certain liabilities in their capacity as members of our board of directors.
Item 7. Recent Sales of Unregistered Securities.
None.
II-1
Table of Contents
Item 8. Exhibits and Financial Statement Schedules.
The following documents are filed as part of this Registration Statement:
| * | Filed herewith. |
| ** | Previously filed. |
II-2
Table of Contents
Item 9. Undertakings
Insofar as indemnification for liabilities arising under the Securities Act may be permitted to directors, officers and controlling persons of the Registrant pursuant to the foregoing provisions, or otherwise, the Registrant has been advised that in the opinion of the SEC such indemnification is against public policy as expressed in the Securities Act, and is, therefore, unenforceable. In the event that a claim for indemnification against such liabilities (other than the payment by the Registrant of expenses incurred or paid by a director, officer or controlling person of the Registrant in the successful defense of any action, suit or proceeding) is asserted by such director, officer or controlling person in connection with the securities being registered, the Registrant will, unless in the opinion of its counsel the matter has been settled by controlling precedent, submit to a court of appropriate jurisdiction the question of whether such indemnification by it is against public policy as expressed in the Securities Act and will be governed by the final adjudication of such issue.
The undersigned Registrant hereby undertakes that:
| 1. | For purposes of determining any liability under the Securities Act, the information omitted from the form of prospectus filed as part of this Registration Statement in reliance upon Rule 430A and contained in a form of prospectus filed by the Registrant pursuant to Rule 424(b)(1) or (4) or 497(h) under the Securities Act shall be deemed to be part of this Registration Statement as of the time it was declared effective. |
| 2. | For the purpose of determining any liability under the Securities Act, each post-effective amendment that contains a form of prospectus shall be deemed to be a new registration statement relating to the securities offered therein, and the offering of such securities at that time shall be deemed to be the initial bona fide offering thereof. |
II-3
Table of Contents
SIGNATURES
Pursuant to the requirements of the Securities Act of 1933, the Registrant certifies that it has reasonable grounds to believe that it meets all of the requirements for filing on Form F-1 and has duly caused this registration statement to be signed on its behalf by the undersigned, thereunto duly authorized, on February 4, 2025.
| Titan America SA |
| /s/ Bill Zarkalis |
| Name: Bill Zarkalis |
| Title: Chief Executive Officer |
Pursuant to the requirements of the Securities Act of 1933, as amended, this Registration Statement has been signed by the following persons in the capacities and on the dates indicated.
| Signature |
Title |
Date |
||
| /s/ Bill Zarkalis Bill Zarkalis |
Chief Executive Officer (principal executive officer) |
February 4, 2025 | ||
| /s/ Larry Wilt Larry Wilt |
Chief Financial Officer (principal financial officer) |
February 4, 2025 |
||
| /s/ Dan Quirk Dan Quirk |
Chief Accounting Officer (principal accounting officer) |
February 4, 2025 |
||
| /s/ Michael Colakides Michael Colakides |
Chairman of the Board of Directors |
February 4, 2025 |
||
| /s/ Nicolas Birakis Nicolas Birakis |
Director |
February 4, 2025 |
||
| /s/ Nikos Andreadis Nikos Andreadis |
Director |
February 4, 2025 |
||
| /s/ Grigoris Dikaios Grigoris Dikaios |
Director |
February 4, 2025 |
||
II-4
Table of Contents
SIGNATURE OF AUTHORIZED REPRESENTATIVE IN THE UNITED STATES
Pursuant to the requirements of the Securities Act of 1933, as amended, the Registrants duly authorized representative has signed this registration statement on Form F-1 in the city of Norfolk, Virginia, on February 4, 2025.
| By: | /s/ John Christy |
|
| Name: John Christy | ||
| Title: Authorized Representative in the United States |
II-5