EX-96.1
Published on January 13, 2025
Exhibit 96.1
TECHNICAL REPORT SUMMARY FOR PENNSUCO QUARRY, MIAMI-DADE COUNTY, FLORIDA
REPORT CPI-17-6713F-A
| PREPARED BY
Continental Placer Inc. 17945 Hunting Bow Circle, Suite 101 Lutz, Florida 33558 |

|
|||
| PREPARED FOR
Titan America LLC 5700 Lake Wright Drive, Suite 300 Norfolk, Virginia 23502 |
|
|||

SIGNATURE DATE: AUGUST 30, 2024
EFFECTIVE DATE: MAY 24, 2024
TABLE OF CONTENTS
| 1 |
EXECUTIVE SUMMARY |
1 | ||||
| 1.1 |
INTRODUCTION | 1 | ||||
| 1.2 |
PROPERTY DESCRIPTION |
1 | ||||
| 1.3 |
GEOLOGY AND MINERALIZATION |
1 | ||||
| 1.4 |
STATUS OF EXPLORATION |
1 | ||||
| 1.5 |
MINERAL RESOURCE AND RESERVE ESTIMATES |
2 | ||||
| 1.6 |
DEVELOPMENT AND OPERATIONS |
3 | ||||
| 1.7 |
CAPITAL AND OPERATING COST ESTIMATES |
4 | ||||
| 1.7.1 |
Capital Costs |
4 | ||||
| 1.7.2 |
Operating Cost |
4 | ||||
| 1.7.3 |
Summary |
5 | ||||
| 1.8 |
PERMITTING REQUIREMENTS |
5 | ||||
| 1.9 |
QUALIFIED PERSONS CONCLUSIONS AND RECOMMENDATIONS |
6 | ||||
| 2 |
INTRODUCTION |
7 | ||||
| 2.1 |
ISSUER OF REPORT |
7 | ||||
| 2.2 |
TERMS OF REFERENCE AND PURPOSE |
7 | ||||
| 2.3 |
SOURCES OF INFORMATION |
7 | ||||
| 2.4 |
QUALIFIED PERSONS |
8 | ||||
| 2.5 |
PERSONAL INSPECTION |
8 | ||||
| 2.6 |
REPORT VERSION |
8 | ||||
| 3 |
PROPERTY DESCRIPTION |
9 | ||||
| 3.1 |
PROPERTY DESCRIPTION AND LOCATION |
9 | ||||
| 3.2 |
MINERAL RIGHTS |
11 | ||||
| 3.3 |
SIGNIFICANT ENCUMBRANCES OR RISKS TO PERFORM WORK ON PROPERTY |
11 | ||||
| 3.4 |
LEASE AGREEMENTS OR ROYALTIES |
11 | ||||
| 4 |
ACCESSIBILITY, CLIMATE, LOCAL RESOURCES, INFRASTRUCTURE, AND PHYSIOGRAPHY |
12 | ||||
| 4.1 |
TOPOGRAPHY AND VEGETATION |
12 | ||||
| 4.1.1 |
Mining Area |
12 | ||||
| 4.1.2 |
Processing Area |
12 | ||||
| 4.2 |
ACCESSIBILITY AND LOCAL RESOURCES |
12 | ||||
| 4.2.1 |
General |
12 | ||||
| 4.2.2 |
Road Access |
12 | ||||
| 4.2.3 |
Rail Access |
12 | ||||
| 4.2.4 |
Air |
12 | ||||
| 4.3 |
CLIMATE |
13 | ||||
| 4.4 |
INFRASTRUCTURE |
13 | ||||
| 4.4.1 |
Power |
13 | ||||
| 4.4.2 |
Water |
14 |
i
| 4.4.3 |
Personnel |
14 | ||||
| 4.4.4 |
Supplies |
14 | ||||
| 5 |
HISTORY |
16 | ||||
| 5.1 |
PRIOR OWNERSHIP | 16 | ||||
| 5.2 |
DEVELOPMENT AND EXPLORATION HISTORY | 16 | ||||
| 6 |
GEOLOGICAL SETTING, MINERALIZATION, AND DEPOSIT |
18 | ||||
| 6.1 |
REGIONAL GEOLOGY | 18 | ||||
| 6.2 |
LOCAL GEOLOGY | 20 | ||||
| 6.3 |
PROPERTY GEOLOGY AND MINERALIZATION | 20 | ||||
| 6.4 |
STRATIGRAPHY AND MINERALOGY | 21 | ||||
| 7 |
EXPLORATION |
23 | ||||
| 7.1 |
EXPLORATION OTHER THAN DRILLING |
23 | ||||
| 7.1.1 |
Geophysical Testing |
23 | ||||
| 7.1.2 |
Pond Surveys and Bathymetry |
23 | ||||
| 7.2 |
DRILLING PROGRAMS |
23 | ||||
| 7.2.1 |
Drilling History |
23 | ||||
| 7.2.2 |
2020 and 2021 Drilling Campaigns |
23 | ||||
| 7.2.3 |
2024 Drilling Campaign |
23 | ||||
| 7.3 |
HYDROGEOLOGY INFORMATION |
26 | ||||
| 7.4 |
GEOTECHNICAL INFORMATION |
26 | ||||
| 8 |
SAMPLE PREPARATION, ANALYSES, AND SECURITY |
27 | ||||
| 8.1 |
SAMPLE PREPARATION AND ANALYSES |
27 | ||||
| 8.1.1 |
2000 Drilling Program |
27 | ||||
| 8.1.2 |
2001 Testing Program |
27 | ||||
| 8.1.3 |
2024 Drilling Program |
27 | ||||
| 8.1.3.1 |
CTL Laboratory Protocol |
28 | ||||
| 8.1.3.2 |
UES Laboratory Protocol |
29 | ||||
| 8.1.4 |
2024 Geophysical Drilling Program |
29 | ||||
| 8.2 |
QUALITY ASSURANCE/QUALITY CONTROL |
29 | ||||
| 8.3 |
OPINION OF THE QUALIFIED PERSON ON ADEQUACY OF SAMPLE PREPARATION |
30 | ||||
| 9 |
DATA VERIFICATION |
31 | ||||
| 9.1 |
OPINION OF THE QUALIFIED PERSON ON DATA ADEQUACY |
31 | ||||
| 10 |
MINERAL PROCESSING AND METALLURGICAL TESTING |
32 | ||||
| 11 |
MINERAL RESOURCE ESTIMATES |
33 | ||||
| 11.1 |
DEFINITIONS |
33 | ||||
| 11.2 |
KEY ASSUMPTIONS, PARAMETERS AND METHODS |
33 | ||||
| 11.2.1 |
Resource Classification Criteria |
33 | ||||
| 11.2.2 |
Market and Economic Assumptions |
33 | ||||
| 11.2.3 |
Cut-Off Grade |
34 | ||||
| 11.2.4 |
Summary of Resource Model ParamEters |
35 | ||||
| 11.3 |
RESOURCE MODEL |
35 |
ii
| 11.3.1 |
Geodatabase |
35 | ||||
| 11.3.2 |
Geologic and Geochemical Model |
35 | ||||
| 11.3.3 |
Resource Area Description |
36 | ||||
| 11.4 |
MINERAL RESOURCES | 38 | ||||
| 11.4.1 |
Estimate of Mineral Resources |
38 | ||||
| 11.4.2 |
Geologic Confidence and Uncertainty |
38 | ||||
| 11.5 |
OPINION OF THE QUALIFIED PERSON |
38 | ||||
| 12 |
MINERAL RESERVE ESTIMATES |
39 | ||||
| 12.1 |
DEFINITIONS |
39 | ||||
| 12.2 |
KEY ASSUMPTIONS, PARAMETERS AND METHODS |
39 | ||||
| 12.2.1 |
Reserve Classification Criteria |
39 | ||||
| 12.2.2 |
Cut-Off Grade |
39 | ||||
| 12.2.3 |
Market Price |
40 | ||||
| 12.3 |
MINERAL RESERVES |
40 | ||||
| 12.4 |
OPINION OF THE QUALIFIED PERSON |
44 | ||||
| 13 |
MINING METHODS | 45 | ||||
| 13.1 |
GEOTECHNICAL AND HYDROLOGIC CONSIDERATIONS |
45 | ||||
| 13.1.1 |
Reserve Characteristics |
45 | ||||
| 13.1.2 |
Slope Stability |
45 | ||||
| 13.1.3 |
Hydrology |
46 | ||||
| 13.2 |
Mine Operating Parameters |
46 | ||||
| 13.3 |
STRIPPING AND DEVELOPMENT |
47 | ||||
| 13.4 |
MINING PLAN |
49 | ||||
| 13.4.1 |
Dragline Excavation |
49 | ||||
| 13.4.2 |
Dredging |
49 | ||||
| 13.5 |
MINE PLANT, EQUIPMENT AND PERSONNEL |
49 | ||||
| 13.6 |
CONCLUSION |
50 | ||||
| 14 |
PROCESSING AND RECOVERY METHODS | 51 | ||||
| 14.1 |
PRIMARY CRUSHING |
51 | ||||
| 14.2 |
OVERLAND CONVEYOR |
51 | ||||
| 14.3 |
SURGE PILE |
51 | ||||
| 14.4 |
AGGREGATE PLANT |
51 | ||||
| 14.4.1 |
Secondary and Tertiary Crushing |
51 | ||||
| 14.4.2 |
Manufactured sand Production (Screenings) |
53 | ||||
| 14.4.2.1 |
Manufactured Sand |
53 | ||||
| 14.4.2.2 |
Ultra Fines Recovery |
53 | ||||
| 14.4.3 |
Finished Aggregates |
53 | ||||
| 14.4.4 |
Plant Yield |
53 | ||||
| 14.5 |
CEMENT PROCESS PLANT DESCRIPTION |
54 | ||||
| 14.6 |
PLANT THROUGHPUT AND DESIGN |
56 | ||||
| 14.7 |
PLANT OPERATIONAL REQUIREMENTS |
56 | ||||
| 14.7.1 |
Energy |
56 |
iii
| 14.7.2 |
Water |
56 | ||||
| 14.7.3 |
Process Materials |
56 | ||||
| 14.7.4 |
Personnel |
57 | ||||
| 14.8 |
APPLICATION OF NOVEL OR UNPROVEN TECHNOLOGY |
57 | ||||
| 15 |
INFRASTRUCTURE |
58 | ||||
| 15.1 |
INTERNAL ROADS |
60 | ||||
| 15.2 |
RAIL |
60 | ||||
| 15.3 |
NATURAL GAS |
60 | ||||
| 15.4 |
ELECTRIC POWER |
60 | ||||
| 15.5 |
ALTERNATIVE FUELS INFRASTRUCTURE |
60 | ||||
| 15.5.1 |
Tire-Derived Fuel |
61 | ||||
| 15.5.2 |
Processed Engineered Fuel |
61 | ||||
| 15.5.3 |
Summary |
61 | ||||
| 15.6 |
FUEL STORAGE |
61 | ||||
| 15.7 |
Dumps |
61 | ||||
| 16 |
MARKET STUDIES |
62 | ||||
| 16.1 |
MARKET OUTLOOK AND PRICE FORECAST |
62 | ||||
| 16.1.1 |
Introduction |
62 | ||||
| 16.1.2 |
Market Past and Future Impacts |
62 | ||||
| 16.1.2 1 |
Cement |
62 | ||||
| 16.1.2.2 |
Construction Aggregates |
63 | ||||
| 16.1.2.3 |
Competitor Analysis Cement |
64 | ||||
| 16.1.2.4 |
Competitor Analysis Aggregates |
64 | ||||
| 16.1.3 |
Market Review Conclusions |
65 | ||||
| 16.1.4 |
Competitive Advantages |
65 | ||||
| 16.2 |
SALES AND DISTRIBUTION CHANNELS |
66 | ||||
| 16.2.1 |
Distribution Channels |
66 | ||||
| 16.2.1.1 |
Cement |
66 | ||||
| 16.2.1.2 |
Aggregates |
66 | ||||
| 16.2.1.3 |
Rail Distribution |
66 | ||||
| 16.3 |
COMMODITY PRICES |
68 | ||||
| 16.3.1 |
Price Forecasts and Key Influencing Factors (e.g., Economic Conditions) |
68 | ||||
| 16.4 |
MATERIAL CONTRACTS |
68 | ||||
| 16.4.1 |
Description of Different Types of Contracts Involved |
68 | ||||
| 16.4.2 |
Overview of Critical Terms and Conditions in the Contracts |
68 | ||||
| 17 |
ENVIRONMENTAL STUDIES, PERMITTING AND PLANS, NEGOTIATIONS, OR AGREEMENTS WITH LOCAL INDIVIDUALS OR GROUPS | 69 | ||||
| 17.1 |
ENVIRONMENTAL STUDIES AND PERMITTING REQUIREMENTS |
69 | ||||
| 17.1.1 |
Lake Belt Area |
69 | ||||
| 17.1.2 |
Required Permits |
72 | ||||
| 17.2 |
WASTE DISPOSAL, SITE MONITORING AND WATER MANAGEMENT |
73 | ||||
| 17.2.1 |
Location of Mine Waste and Water Management Facilities |
73 |
iv
| 17.3 |
POST-MINING LAND USE AND RECLAMATION |
73 | ||||
| 17.3.1 |
Upland Reclamation |
73 | ||||
| 17.3.2 |
Shoreline Reclamation |
73 | ||||
| 17.3.3 |
Mine Closure Costs |
74 | ||||
| 17.4 |
LOCAL OR COMMUNITY ENGAGEMENT AND AGREEMENTS |
74 | ||||
| 17.5 |
OPINION OF THE QUALIFIED PERSON |
74 | ||||
| 18 |
CAPITAL AND OPERATING COSTS |
75 | ||||
| 18.1 |
SUMMARY AND ASSUMPTIONS |
75 | ||||
| 18.2 |
MINING CAPITAL SUMMARY |
75 | ||||
| 18.2.1 |
Stripping |
75 | ||||
| 18.2.2 |
Sustaining Capital |
75 | ||||
| 18.2.3 |
Mining method extension |
75 | ||||
| 18.2.4 |
Contingency |
75 | ||||
| 18.3 |
PROCESSING CAPITAL COSTS |
75 | ||||
| 18.4 |
MINING OPERATING COST |
76 | ||||
| 18.4.1 |
Introduction and Estimate Results |
76 | ||||
| 18.4.2 |
Depreciation and Amortization |
76 | ||||
| 18.4.3 |
SUMMARY |
77 | ||||
| 19 |
ECONOMIC ANALYSIS |
78 | ||||
| 19.1 |
KEY PARAMETERS AND ASSUMPTIONS |
78 | ||||
| 19.1.1 |
Commodity Prices |
78 | ||||
| 19.1.2 |
Inflation |
78 | ||||
| 19.1.3 |
Labor |
78 | ||||
| 19.1.4 |
Production Parameters |
78 | ||||
| 19.1.5 |
Operational Costs |
78 | ||||
| 19.1.6 |
Capital Expenditures |
79 | ||||
| 19.1.7 |
Tax Rate |
79 | ||||
| 19.2 |
ECONOMIC VIABILITY |
79 | ||||
| 19.2.1 |
Economic viability |
79 | ||||
| 19.2.2 |
Measures of Economic Viability |
80 | ||||
| 19.3 |
Sensitivity Analysis |
80 | ||||
| 19.4 |
CONCLUSION |
81 | ||||
| 20 |
ADJACENT PROPERTIES |
82 | ||||
| 21 |
OTHER RELEVANT DATA AND INFORMATION |
83 | ||||
| 21.1 |
LAND OWNERSHIP IN SECTION 27 |
83 | ||||
| 21.2 |
AGGREGATES TAILINGS RECOVERY FOR CLINKER MANUFACTURING |
83 | ||||
| 21.3 |
CONSUMPTION OF QUARRY TAILINGS FOR RAW MILL PRODUCTION |
84 | ||||
| 22 |
INTERPRETATION AND CONCLUSIONS |
85 | ||||
| 22.1 |
INTERPRETATIONS AND CONCLUSIONS |
85 | ||||
| 22.2 |
RISKS AND UNCERTAINTIES |
85 | ||||
| 23 |
RECOMMENDATIONS |
86 | ||||
| 24 |
REFERENCES |
87 | ||||
| 25 |
RELIANCE ON INFORMATION PROVIDED BY THE REGISTRANT |
89 | ||||
| 26 |
DATE AND SIGNATURE PAGE |
90 |
v
LIST OF TABLES
| Table 1-1. Pennsuco Site - Summary of Limestone Mineral Resources Effective May 24, 2024 |
2 | |||
| Table 1-2. Pennsuco Site - Summary of Limestone Mineral Reserves Effective May 24, 2024 |
3 | |||
| Table 5-1. Record of Site Ownership |
16 | |||
| Table 5-2. Record of Site Improvements and Operational Developments |
16 | |||
| Table 5-3. Record of Drilling Campaigns and Areas Explored |
17 | |||
| Table 7-1. Exploration Drilling |
23 | |||
| Table 11-1. Parameter Assumptions |
35 | |||
| Table 11-2. Summary of Limestone Mineral Resources at the Effective Date of May 24, 2024 |
38 | |||
| Table 12-1. Summary of Limestone Mineral Reserves Effective May 24, 2024 (Page 1 of 2) |
42 | |||
| Table 17-1. Permit Status |
72 | |||
| Table 18-1. Summary of Mining and Cement Processing Operating Costs over LOM |
76 | |||
| Table 19-1. Economic Analysis Model |
80 | |||
| Table 19-2. Sensitivity Analysis |
81 |
vi
LIST OF FIGURES
| Figure 3-1. Property Location and Site Boundary. |
10 | |||
| Figure 4-1. Miami-Dade County Temperature and Precipitation Data Recorded from 1981-2010 (U.S. Climate Data, 2024) |
13 | |||
| Figure 4-2. Regional Infrastructure |
15 | |||
| Figure 6-1. Geologic Map of Southern Florida (Scott, 2001) |
19 | |||
| Figure 6-2. Typical Stratigraphic Column [Modified From (Scott, 2001)] |
21 | |||
| Figure 6-3. Cross Section of the Permitted Area |
22 | |||
| Figure 7-1. Plan View Map of the 2024 Drilling Campaign |
25 | |||
| Figure 11-1. Silica distribution in the deposit |
34 | |||
| Figure 11-2. Resource Area |
37 | |||
| Figure 12-1. Reserves Map |
43 | |||
| Figure 13-1. Historic Phreatic Water Level Elevation (Source: Annual Lake Belt Report) |
46 | |||
| Figure 13-2. Final Quarry Limits |
48 | |||
| Figure 14-1. Aggregate Plant Main Process Flow Chart |
52 | |||
| Figure 14-2. Cement Plant Process |
54 | |||
| Figure 14-3. Cement Plant Process Flow Chart |
55 | |||
| Figure 14-4. Pit to Product Mass Balance |
56 | |||
| Figure 15-1. Site Infrastructure Features |
58 | |||
| Figure 15-2. Plant Area Infrastructure |
59 | |||
| Figure 16-1. Total Florida Cement Consumption Actual and Forecast |
62 | |||
| Figure 16-2. Year-Over-Year Florida Population Growth by County |
63 | |||
| Figure 16-3. Titan Florida Cement & Aggregate Terminal Locations Along the FEC Railway |
67 | |||
| Figure 16-4. Producer Price Index by Industry: Cement and Concrete Product Manufacturing (U.S. Bureau of Labor Statistics, 2024) |
68 | |||
| Figure 17-1. Lake Belt Area |
70 | |||
| Figure 17-2. Lake Belt Phases (MacVicar Consulting, 2017) |
71 | |||
| Figure 21-1. Section 27 with Titans Parcels shown in blue |
83 | |||
| Figure 21-2. Drill and Barge Used for 2008 Fines Drilling Campaign |
84 |
vii
GLOSSARY OF TERMS AND ABBREVIATIONS
| Symbol / Abbreviation |
Description |
|
| |
minute (plane angle) or foot/feet | |
| |
second (plane angle) or inch/inches | |
| ° |
degree | |
| °F |
degrees Fahrenheit | |
| AF |
alternative fuel | |
| Al2O3 |
alumina or aluminum oxide | |
| BTU |
British thermal unit | |
| CaO |
calcium oxide | |
| DERM |
Department of Environmental Resources Management | |
| DOT |
Department of Transportation | |
| EIS |
Environmental Impact Statement | |
| ERP |
Environmental Resource Permit | |
| ESA |
Endangered Species Act | |
| F.A.C |
Florida Administrative Code (FAC) | |
| Fe2O3 |
Iron oxide | |
| FDEP |
Florida Department of Environmental Protection | |
| FEC |
Florida East Coast | |
| Fe2O3 |
iron oxide or ferric oxide | |
| FGS |
Florida Geological Survey | |
| FP&L |
Florida Power & Light | |
| K2O |
potassium oxide | |
| kt |
kiloton | |
| Kt/a |
kilotons per annum | |
| kV |
Kilovolt | |
| kW |
Kilowatt | |
| kWh |
kilowatt hour | |
| LOI |
Loss on ignition | |
| LOM |
Life of Mine |
viii
| MCF |
one thousand cubic feet | |
| MG |
million gallons | |
| MgO |
magnesium oxide | |
| MW |
Megawatt | |
| Na2O |
sodium oxide | |
| NGVD |
National Geodetic Vertical Datum | |
| PEF |
Process engineered fuel | |
| QP |
qualified person | |
| RER |
Miami-Dade County, Department of Regulatory and Economic Resources | |
| ROZA |
Rock mining overlay zoning area | |
| SiO2 |
silicon dioxide | |
| SO3 |
sulfur trioxide | |
| t |
US ton | |
| t/h |
tons per hour | |
| t/a |
ton per year (annum) | |
| TDF |
Tire derived fuel | |
| TiO2 |
titanium dioxide | |
| US |
United States | |
| US$ |
US Dollar | |
| USACE |
United States Army Corps of Engineers | |
| USFWS |
United States Fish and Wildlife Service | |
| XRF |
x-ray fluorescence | |
| ZnO |
zinc oxide |
ix
1 EXECUTIVE SUMMARY
1.1 INTRODUCTION
Titan America LLC (Titan) is a leading U.S. manufacturer of construction materials used in residential, commercial, industrial, infrastructure, and energy applications. Titan has retained Continental Placer Inc. (CPI) to prepare this Technical Report Summary (TRS) for the Pennsuco facility (site) located in the state of Florida, USA.
The purpose of this TRS is to support the disclosure of Mineral Resource and Mineral Reserve estimates for the site as of May 24, 2024. This TRS is intended to fulfill 17 Code of Federal Regulations (CFR) §229, Standard Instructions for Filing Forms Under Securities Act of 1933, Securities Exchange Act of 1934 and Energy Policy and Conservation Act of 1975 Regulation S-K, subsection 1300, Disclosure by Registrants Engaged in Mining Operations. The Mineral Resource and Mineral Reserve estimates presented herein are classified according to 17 CFR §229.1300 (Item 1300) Definitions.
The Mineral Reserves are mined to support the on-site aggregates plant and cement facility.
This TRS was prepared by CPI. No prior TRS has been filed with respect to the site.
1.2 PROPERTY DESCRIPTION
The site is in Miami-Dade County, Florida, and is positioned approximately 14 miles northwest of the Miami city center. The site comprises 68 separate property tracts, all of which are owned by Titan or through its subsidiary companies. In total, the property encompasses 6,465 acres.
The property is bisected by the Florida Turnpike. The area west of the turnpike is the area of the mining activity and the area to the east is the location of the aggregate plant, cement facility, ready mix concrete plant, and the concrete block plant, plus support facilities.
1.3 GEOLOGY AND MINERALIZATION
Limestone extraction is from the Miami Limestone Formation. The Miami Limestone is regionally extensive and underlies a thin veneer of unconsolidated organic sediments. It comprises two primary lithologies: an upper zone of poorly to moderately indurated, sandy, oolitic limestone, and a lower, thicker zone of poorly to well indurated, sandy, fossiliferous limestone. The upper 20 to 35 feet exhibit a higher calcium content. The silica content increases with depth as calcium content decreases. Solution features become more common with depth.
1.4 STATUS OF EXPLORATION
The mine site has been thoroughly explored through numerous drilling and mapping campaigns. The areas planar semi-horizontal lithology lends itself to a simplified stratigraphic understanding and easily reliably correlated drill holes.
1
1.5 MINERAL RESOURCE AND RESERVE ESTIMATES
Table 1-1 shows the resulting Resource tonnage estimate for the quarry effective May 24, 2024. Resource tonnages are exclusive of Reserves, which means the Resources converted to Reserves are not included in the estimates presented in this TRS.
The following are limestone Mineral Resource estimates at the surge pile, as of May 24, 2024:
Table 1-1. Pennsuco Site - Summary of Limestone Mineral Resources Effective May 24, 2024
| Resource Category |
Limestone (tons) |
|||
| Measured Resources |
27,235,000 | |||
| Indicated Resources |
20,081,000 | |||
|
|
|
|||
| Total Measured and Indicated |
47,316,000 | |||
|
|
|
|||
| Notes: (1) Mineral Resources are not Mineral Reserves and do not have demonstrated economic viability. (2) Mineral Resources are exclusive of Mineral Reserves. (3) Mineral Resources point of reference is the limestone surge pile at the plant area. (4) Mineral Resources Reasonable Prospects for Economic Extraction (RPEE) commodity price is based on a 2025 cement price of $136 per ton and a blended aggregates price of $21.00 per ton. Both prices are Free on Board (FOB) the plant. (5) Tons are rounded to the nearest thousand. (6) Sums may not be exact because of rounding. (7) There is no certainty that all or any part of the Mineral Resources estimated will be converted into Mineral Reserves (8) A density factor of 1.55 t/ bank yd3 was applied. |
The Qualified Person (QP) opines that the modeling of the Miami Limestone deposit at the site adequately characterizes the quality and geology of the ore body. Such interpretations were made based on drilling campaigns, other exploration activities, and the mining history at the site. Material density is considered a key assumption in the determination of mineral resources. Through exploration, material testing and mass balance calculations the in-situ density factor utilized is 1.55 tons per bank cubic yard. The QP also opines that the Resource estimates have been developed following customary and industry standard practices in the construction materials mining industry. No proprietary methods, standards or software were used in the Resource estimate.
Table 1-2 exhibits the resulting Reserve tonnage estimate for the quarry effective May 24, 2024.
2
Table 1-2. Pennsuco Site - Summary of Limestone Mineral Reserves Effective May 24, 2024
| Reserve Category |
Limestone (tons) |
SiO2 (%) |
||||||
| Proven |
240,886,000 | 13.71 | ||||||
| Probable |
193,180,000 | 18.29 | ||||||
|
|
|
|
|
|||||
| Total Proven and Probable |
434,066,000 | 15.75 | ||||||
|
|
|
|
|
|||||
| Notes: (1) Price is $136/ton of cement and $21.00/ton of aggregates. U.S. dollars FOB plant site. (2) There is no cut-off grade (3) Mineral Reserves point of reference is the limestone surge pile at the plant area. (4) There is a 95% recovery to the surge pile. (5) Tons are rounded to the nearest thousand. (6) Sums may not be exact because of rounding. (7) A density factor of 1.55 t/ bank yd3 was applied. |
Given the extent of geologic information, mine planning activities, and operating history at the site, the QP is confident the Reserves can be extracted and processed at the quantity and quality required to meet the sites production schedule and produce Portland cement that will achieve or exceed the quality standards set forth by ASTM International (ASTM).
As part of this study, an economic analysis that included capital expenditure estimates for development, infrastructure relocations, fleet acquisitions, plant upgrades, and regulatory projects was performed. Operating expenses were obtained from the cost tracking performed by Titan over its 20 plus-year history of operating the site.
The site has a long history of successfully operating the quarry; therefore, the operational and technical feasibility of mining and processing the limestone is well understood.
The QP opines that the Reserve estimate has been developed following customary standards in the construction materials mining industry. The QP is of the opinion that all relevant technical and economic factors are not likely to be significantly influenced by additional geological investigation, and that any technical and economic issues are not material to the operation of the site.
1.6 DEVELOPMENT AND OPERATIONS
The mineral deposit at the quarry is layers of limestone that originated from a combination of depositional and erosional processes associated with sea-level fluctuation during the late Pleistocene era. The geology is composed of three major sedimentary formations as discussed in Section 6.3. The total thickness of the combination of the Miami Limestone layers varies from 70 to 85 feet. The current quarry excavation extends over an area of approximately 3,045 acres and will expand over the life of the mine (LOM) to 4,655 acres.
The quarry currently averages an annual production of approximately 10 million tons of limestone to feed both the aggregate plant and the cement plant.
Mining is conducted using draglines. In the future, the use of a dredge(s) is planned to recover the permitted remnant material from the quarry floor. The dredge method will also allow for excavation of the material remaining around the perimeter of the quarry that is inaccessible using a dragline. A comprehensive independent dredge mining method study has been commissioned to evaluate dredge technology for the operation.
3
The excavated material from the dragline is stockpiled along the working face to decant. This stockpiled limestone is transported by 100-ton haul trucks to the primary crusher. From the crusher, the material is transferred by belt conveyor to the surge pile, where it is fed to either the aggregate plant or the cement plant.
Based on historical performance of both the aggregate and cement plant, including Title V air permit limitations, the annual production from the quarry is 9.9 million tons. This consists of:
| Cement plant feed
Aggregate plant feed |
3.0 million tons per annum (t/a)
6.9 million t/a |
Projected quarry production:
| Current operations
Dragline
Proposed operations
Dragline
Dredge |
9.9 million t/a
7.4 million t/a
2.5 million t/a |
Based on these production levels, the mine life based on the current Reserves (as defined in Section 12) of:
| | The dragline Reserve life is through 2062 and is a 38-year life for cement raw feed due to the current targeted silica chemistry, from January 2025 at a production level of 9.9 million t/a. |
| | The dredge Reserve life is through 2083 and is a 56-year life from January 2028, 21 years beyond the dragline life with the additional years at a production level of 2.5 million t/a. This life of mine value is for aggregates production only due to silica content, until modifications are made in the cement plant and/or feed correctives are added to the raw meal. |
1.7 CAPITAL AND OPERATING COST ESTIMATES
Capital and operating costs are primarily estimated using a combination of historical performance, historical fuel and labor costs, equipment quotes from recent projects, and vendor quotes for mobile equipment.
1.7.1 CAPITAL COSTS
Over the evaluation period, the capital costs are:
| | Stripping. The quarry performs stripping activities to prepare the mining area. These activities include removing overburden in advance of the blasting schedule. The estimated cost is $84.7 million |
| | Sustaining. The capital associated with mining activities is based on 9.9 million t/a of extracted limestone |
| | Sustaining capital for mobile equipment: replacement and refurbishment of haul trucks, loaders, and auxiliary equipment. |
| | Sustaining capital for draglines annual capitalizable maintenance, significant refurbishments, and major component replacement, as well as on dragline relocation |
| | Sustaining capital for primary crushers and the overland conveyor system. |
The total sustaining capital costs over the evaluation period are: $199.1 million.
| | Mining Expansion - A dredge is currently scheduled to be commissioned in 2028 to extract the remnant material. Based on the current engineering study, the capital cost will be incurred in 2026/2027. The estimated cost is $25 million. |
1.7.2 OPERATING COST
The operating cost estimate for the mining operation was prepared using historical trends and detailed cost models, which were used during the 2024 annual budgetary planning process. The costs are for all activity up to delivery to the surge pile. The 2024 fixed and variable cost for the sites mining activity is estimated at $5.09 per ton delivered to the surge pile.
4
In addition to the fixed and variable costs, the applicable amortization and depreciation are added to determine the total mining cost per ton into the primary surge pile. The amortization and depreciation include allowance for previously incurred capital costs. The existing capital cost of $46.1 million is assumed to be depreciated over a 10-year life. Future capital cost from 2025 onwards of $295.0 million is depreciated over 15 years from the date the asset is placed in service.
Furthermore, the capital cost includes depletion of $0.18 per ton mined.
1.7.3 SUMMARY
The projected total mining cost during the evaluation period is $5.09 per ton delivered to the surge pile in 2025 and increases over the evaluation period to reflect the changes in depreciation and annual inflation based on the Consumer Price Index adjustment.
1.8 PERMITTING REQUIREMENTS
The site is situated in the Miami-Dade County Lake Belt area (Lake Belt), which contains high-quality limestone and encompasses +/-51,000 acres of wetlands. The Lake Belt was recognized legislatively as a critical state Resource. The Lake Belt is the subject of the Lake Belt Plan, which separated the Lake Belt into two areas: areas where rock mining would potentially be allowed, and the Pennsuco wetlands, a contiguous area that would be protected from mining and preserved, to the extent feasible as natural lands.
Each producer in the Lake Belt is responsible for its own facility permits and site-specific impacts; however, each facility is subject to the overall Lake Belt Plan mine phase planning. Phases 1 and 2 of the Lake Belt Plan were subject to a National Environmental Policy Act (NEPA) Environmental Impact Statement (EIS) evaluation led by the United States Army Corps of Engineers (USACE), including associated studies. Notably, the Florida Department of Environmental Protection (FDEP) Environmental Resource Permit (ERP) (e.g., mine permit) and the USACE Section 404 Dredge and Fill Permit (discussed herein) are submitted by each producer in the Lake Belt to the Lake Belt Committee for review and approval before each phase of mining. Currently, producers in the Lake Belt are operating within the approved Phase 1 and Phase 2 areas.
The upcoming permitting efforts for Phase 3 mining and associated wetlands impacts and mitigation will require modification of the USACE 404 Dredge and Fill Permits and FDEP ERP. The Phase 3 permitting effort will also require obtaining a Miami-Dade Class IV Wetland Permit and a Miami-Dade Lake Excavation Permit. Phase 3 mine permit applications for the Lake Belt producers will be submitted prior to December 31, 2024.
All other permits required to allow mining are in place and are current.
5
1.9 QUALIFIED PERSONS CONCLUSIONS AND RECOMMENDATIONS
The following is a summary of the Resource and Reserve estimates for the site:
| | Geology is well known and understood and proven to supply suitable stone both for cement raw material and quality aggregates. |
| | Mining operations and practices have been well established over many decades. Addition of dredge mining to maximize the recovery of the Resource is a well-established and proven mining practice. |
| | The processing of raw materials and manufacture of cement has been in place for many decades and is a very low emissions cement facility. |
| | All necessary infrastructure is in place and has served the operation for many decades. |
| | All necessary permits are in place and future permitting is expected to enable extraction of all Reserves included in the estimate. |
| | Costs are well understood and predictable with the operations having been economical for many years and reasonably expected to be so for the projected LOM. |
The QP opines that no issues are unresolved with the technical or economic factors considered in determining RPEE that supports the Resource estimate and that the risk of material impacts on the Reserve estimate is low.
The following actions are recommended for the site:
| | Advance Phase 3 permitting. |
| | Evaluate the fines recovery from Pit 3 for use in the cement process. |
| | Add a second ultra fines handling system to decrease aggregates processing tailings with recovered material used in the cement mill. |
| | Evaluate the use of bauxite for alumina control in place of fly ash to use more limestone Reserve in the cement process. |
6
2 INTRODUCTION
2.1 ISSUER OF REPORT
Titan is a leading U.S. manufacturer of construction materials that are used in residential, commercial, industrial, infrastructure, and energy applications. Titan has retained CPI to prepare this TRS for the Pennsuco Site located in the state of Florida, USA.
2.2 TERMS OF REFERENCE AND PURPOSE
The purpose of this TRS is to support the disclosure of Mineral Resource and Mineral Reserve estimates for the site as of May 24, 2024. This TRS is intended to fulfill 17 CFR §229, Standard Instructions for Filing Forms Under Securities Act of 1933, Securities Exchange Act of 1934 and Energy Policy and Conservation Act of 1975 Regulation S-K, subsection 1300, Disclosure by Registrants Engaged in Mining Operations. The Mineral Resource and Mineral Reserve estimates presented herein are classified according to 17 CFR §229.1300 (Item 1300) Definitions.
Unless otherwise stated, all measurements are reported in U.S. customary units and currency in U.S. dollars ($).
This TRS was prepared by CPI. No prior TRS has been filed with respect to the site.
The quality of information, conclusions, and estimates contained herein is consistent with the level of effort involved in CPIs services, based on the:
| | Information available at the time of preparation |
| | Data supplied by outside sources |
| | Assumptions, conditions, and qualifications set forth in this TRS |
2.3 SOURCES OF INFORMATION
This study is supported by Titan technical, operational, market, and financial reports, as well as studies and field programs performed by Titan and other external parties, published government reports, published government and historical data, and public information available at the time of writing.
Titan provided the following information:
| | Property history |
| | Property data |
| | Drill hole records |
| | Sampling protocols |
| | Laboratory protocols |
| | Sample analysis data |
| | Mine operations data |
| | Limestone crushing and handling data |
| | Site infrastructure information |
7
| | Environmental permits and related data/information |
| | Historical and forecast capital and operating cost data |
The documentation reviewed and other sources of information are listed in Section 24 of this TRS.
2.4 QUALIFIED PERSONS
The QP for this TRS is CPI. CPI was established in 1988, and is an environmental, engineering, and geological consulting firm with offices in Albany, New York; Lutz, Florida; and Mechanicsburg, Pennsylvania. CPI offers expertise in geologic, hydrogeologic, Reserve analysis, environmental, mine engineering and mapping services to private-sector clients throughout North America.
2.5 PERSONAL INSPECTION
Since 2002, CPI personnel have been on site on multiple occasions to provide technical support for geology, mine planning, and operations.
The CPI QP, Nathan Moore, conducted a site visit from May 17 to May 25, 2024, and completed the following tasks:
| | Visited the core storage area and inspected cores from prior exploration programs |
| | Reviewed logging and sampling procedures |
| | Inspected several locations in the mine, observing the characteristics of the deposit geology |
| | Discussed grade control mapping and sampling procedures |
| | Visited some of the mine stockpile areas |
| | Visited the processing facilities and inspected the sampling points used to determine the tonnages and grades processed |
| | Visited the site sample preparation facility and assay laboratory |
| | Held discussions with site personnel |
2.6 REPORT VERSION
This TRS, dated August 30, 2024, is the first TRS for the project.
8
3 PROPERTY DESCRIPTION
3.1 PROPERTY DESCRIPTION AND LOCATION
The site is in Miami-Dade County, Florida, approximately 14 miles northwest of the city center of Miami, as shown in Figure 3-1. The geodetic coordinates for the plant are approximately 25°5237 N and 80°2227 W.
The property spans multiple land sections and platted subdivisions and is bisected by the Florida Turnpike. The turnpike separates the two main activities of the site. Mining activity occurs west of the turnpike in unincorporated Miami-Dade County. The cement and aggregates processing plants are located on the east side of the turnpike in the Town of Medley, Miami-Dade County. The east side is associated with the sites physical address, 11000 NW 121st Way, Medley, Florida 33178.
The site has 68 tax folios totaling approximately 6,465 acres. Property ownership includes Tarmac Florida, Inc.; Tarmac Roadstone (U.S.A.) Inc.; Tarmac America LLC; Tarmac America, Inc.; Titan Florida LLC; and Sierra Everglades Investments LLC, which are all legal entities, holding companies, and/or subsidiaries under the control of Titan.
9
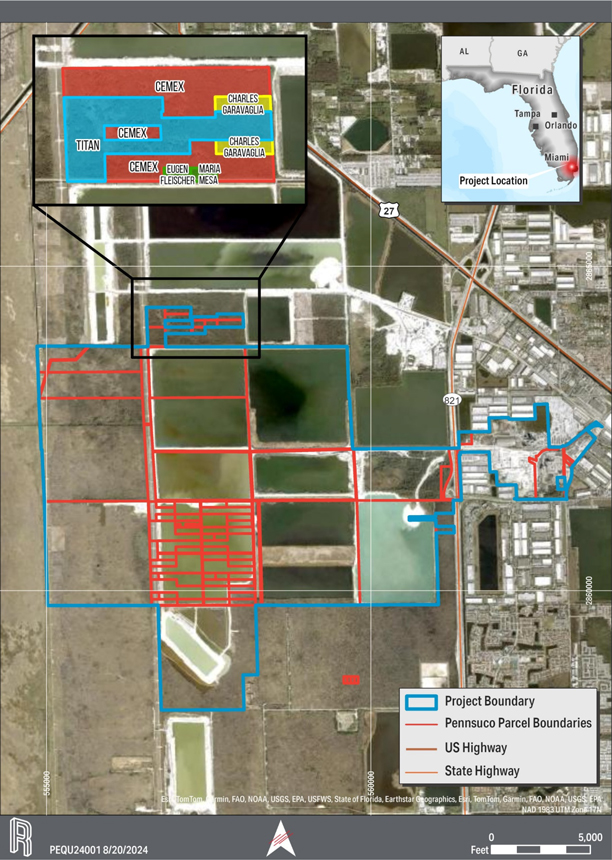
Figure 3-1. Property Location and Site Boundary.
10
3.2 MINERAL RIGHTS
All limestone mining rights are fully owned by deed for the 68 tax parcels identified in section 3.1 by subsidiaries of Titan.
3.3 SIGNIFICANT ENCUMBRANCES OR RISKS TO PERFORM WORK ON PROPERTY
An assessment of title commitments rendered no risks or encumbrances that preclude the proposed activity on the site. The pit shell design and operation layout address several other property interests, including:
| | Power lines. Two high-voltage electricity transmission lines cross the mining area from north to south. One easement is along the western boundary of Sections 3, 10, 15, 22, 27, and 34 (T52S, R39E). The other easement is along the western boundary of Sections 4 (T53S, R39E), 28, and 33 (T52S, R39E). The power lines are located on either Titan property with an easement to Florida Power and Light (FPL) or on FPL-owned property. There are right-of-way access points across the power lines. |
| | Gas line. A gas line runs through the cement plant area along NW 107th Avenue. A second gas line originates on the main line but follows NW 121st Way to the west. |
| | Wellfield. Allowable Land Uses within the Northwest Wellfield permits limestone quarrying, rock crushing, and aggregate plants but not concrete batch plants. Fuels and lubricants are allowed to be used in the rock mining operation; however, a variance from the Environmental Quality Control Board shall be needed for using hazardous materials other than fuels and lubricants and for generating hazardous and liquid wastes. |
| | Canals. Several Miami-Dade County reservations and setbacks are associated with canals and levees on or near the property. These canal restrictions are considered during mine planning and site expansion. |
| | Conservation easement. Limestone Proven Reserve for Pits J, K, and L are based on current permitting with a 1,500-foot setback from the Broward-Dade Levee. Additional Probable Reserves are based on decreasing the setback to the current maximum allowed, assuming that the 1,500-foot offset can be mitigated. |
3.4 LEASE AGREEMENTS OR ROYALTIES
Royalties are not paid on any current mining production, and none are expected to be due in the future. Titan owns all the property in the project area.
11
4 ACCESSIBILITY, CLIMATE, LOCAL RESOURCES, INFRASTRUCTURE, AND PHYSIOGRAPHY
4.1 TOPOGRAPHY AND VEGETATION
4.1.1 MINING AREA
The topography west of the Florida Turnpike in the mining areas is flatagricultural/open dense vegetation land or open water from mining and reclamation operations. The average elevation in the site is approximately 4 feet National Geodetic Vertical Datum (NGVD).
The mining activities are in the Lake Belt, encompassing 77.5 square miles of environmentally sensitive land at the western edge of the Miami-Dade County urban area. The wetlands and lakes of the Lake Belt, a significant part of the sites vegetation, offer the potential to buffer the Everglades from the adverse impacts of urban development.
4.1.2 PROCESSING AREA
East of the Florida Turnpike, the land is developed with structures for processing aggregates; manufacturing cement, concrete, and block; and all associated support uses to conduct business. These facilities are located in the town of Medley, Florida, at an elevation of approximately 7 feet NGVD.
4.2 ACCESSIBILITY AND LOCAL RESOURCES
4.2.1 GENERAL
The eastern portion of the site is located in Medley, Florida, a town incorporated in 1949 and within Miami-Dade County. The site is approximately 14 miles northwest of the city center of Miami. The address is 11000 NW 121st Way, Medley, FL 33178. The site has access to the Miami metropolitan area (Miami-Dade, Broward, and Palm Beach Counties). This tri-county area has a population of approximately 6.2 million people.
4.2.2 ROAD ACCESS
The site is accessed by the following highways: Florida Turnpike and Okeechobee Road (US Hwy 27), which both connect to FL-826 (north to south), FL-836 (east to west), and Interstates 75 and 95 (north to south). Nearby major roadways provide access to the Port of Miami.
4.2.3 RAIL ACCESS
The site is accessed by the Florida East Coast (FEC) Railway, which runs between Miami and Jacksonville, Florida.
4.2.4 AIR
The Miami International Airport is 3 miles southeast of the site, and the Opa-locka Airport/Metro-Dade General Aviation facility is located 6 miles to the northeast.
12
4.3 CLIMATE
The site is in South Florida, which has a tropical climate. The area receives 61.9 inches of precipitation annually, on average (U.S. Climate Data, 2024). Figure 4-1 shows the average minimum and maximum monthly temperature and the average monthly precipitation from 1981 to 2010 in Miami-Dade County.
The mine remains in operation year-round, largely unaffected by the climate. Hazardous weather that may affect mine operations occurs occasionally throughout southern Florida in the form of severe winds, severe hail, and tornados (NWS, 2005). Flooding induced by hurricane activity is generally restricted to coastal areas.
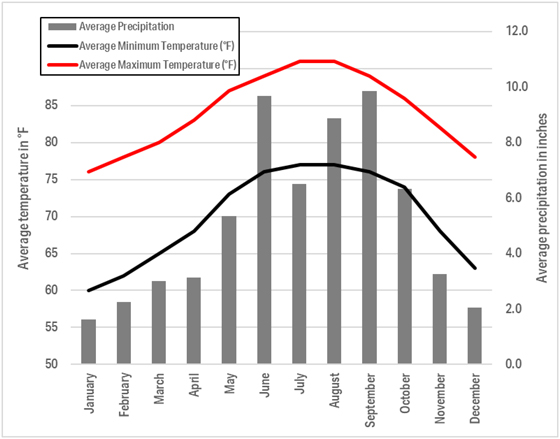
Figure 4-1. Miami-Dade County Temperature and Precipitation Data Recorded from 1981-2010 (U.S. Climate Data, 2024).
4.4 INFRASTRUCTURE
Because of its proximity to the Miami-Dade County metropolitan area, the site has access to existing well-developed infrastructure, including potable water, industrial use water wells, power, gas supply, communications, and transportation. Details of the site Infrastructure are included in Section 15. Regional infrastructure is shown in Figure 4-2.
4.4.1 POWER
The plant relies on multiple sources of energy. The fuel for firing the kiln can be 100 percent gas, which is supplied by Florida City Gas. The use of natural gas can be supplemented by alternative fuels (AFs) including tire-derived fuel (TDF), processed engineered fuel (PEF), and recycled oil. Currently, the target is to provide 30 to 35 percent of the fuel requirement from AFs. Electrical supply to the site is provided by FPL via a 40 megawatt (MW) substation.
13
4.4.2 WATER
Industrial water used on site is withdrawn from a series of shallow wells covered under the Consumptive Water Use Permit, as discussed in Section 17. As part of the permit requirements, each well is metered, and reporting of consumptive use is provided to the authority. Potable water is supplied and serviced by the Town of Medley.
4.4.3 PERSONNEL
The site currently employs approximately 450 employees working in cement, aggregates, and ready-mix concrete and block operations. Employees include heavy equipment operators, skilled tradesman, engineers, support personnel, and managers. Accommodation for site employees is available in the nearby communities of Miami-Dade and Broward Counties, as well as the major metropolitan areas of Miami and Fort Lauderdale.
Because of the size of the metropolitan area and the presence of other mining operations, the site has a supply of qualified personnel with the required skill levels.
4.4.4 SUPPLIES
Supplies for plant operations (e.g., equipment, parts) are adequate and available in the region. The Town of Medley is primarily an industrial community with more than 1,800 businesses supporting its industrial and logistics function for the area.
14
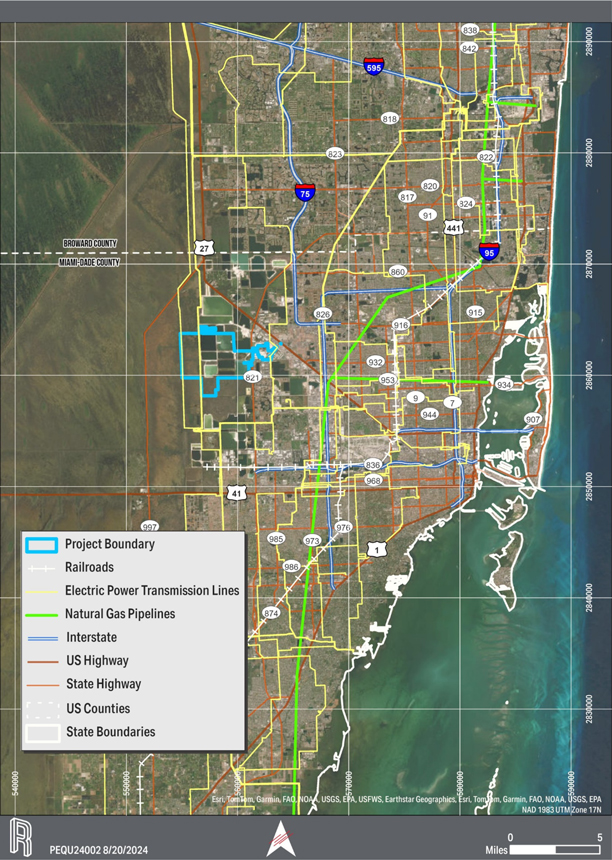
Figure 4-2. Regional Infrastructure.
15
5 HISTORY
5.1 PRIOR OWNERSHIP
The site is named after the Pennsylvania Sugar Company, which established sugar cane operations in the area in the early 1900s, and later discovered the rich limestone Resource supporting the sugar cane factory.
Limestone availability was an important factor in establishing the local sugar industry. This limestone was used to manufacture lime and carbon dioxide, which was needed in the refining process. A lime kiln was built exclusively to support the local sugar industry. The lime production was successful, indicating the potential for cement manufacturing.
The site has been in operation as a cement production and aggregate facility since 1962. A record of ownership is provided in Table 5-1. Record of Site Ownership
Table 5-1. Record of Site Ownership
| Year |
Company |
Operations/Activity |
||
| 1919 | Pennsylvania Sugar Company | Constructed lime kiln to support sugar cane operations, quarried limestone to raise ground level | ||
| 1962 | Maule Industries | Constructed cement plant, including three kilns and an aggregate plant | ||
| 1978 | Lone Star Florida Cement Inc. | Cement and construction aggregates production | ||
| 1988 | Tarmac America, Inc. | Cement and construction aggregates production | ||
| 2000 | Tarmac Florida, Inc. | Cement and construction aggregates production | ||
| 2004 | Titan Florida LLC | Cement and construction aggregates production |
5.2 DEVELOPMENT AND EXPLORATION HISTORY
Eight significant cement plant and quarry modernization projects have taken place during the sites history, as shown in Table 5-2.
Table 5-2. Record of Site Improvements and Operational Developments
| Year |
Company |
Summary of Work |
||
| 1962 | Maule Industries | Cement plant constructed | ||
| 2006 | Titan Florida LLC | New kiln, preheater tower, finish mill 6 and packhouse installed | ||
| 2015 | Titan Florida LLC | System installed to consume used tires as fuel | ||
| 2016 | Titan Florida LLC | Aggregates plant reconstructed | ||
| 2017 | Titan Florida LLC | Page 732 Dragline Commissioned | ||
| 2019 | Titan Florida LLC | New natural gas line and hybrid burner installed, enabling coal replacement | ||
| 2020 | Titan Florida LLC | Alternative fuels plant commissioned to fuel clinker plant | ||
| 2021 | Titan Florida LLC | Artificial Intelligence system for kiln operations | ||
| 2023 | Titan Florida LLC | New raw materials storage commissioned | ||
| 2024 | Titan Florida LLC | Marion 7820 dragline commissioned |
16
Table 5-3 presents the recorded geologic exploration campaigns and their target areas. These campaigns confirmed the quantity and quality of limestone required for the continuous operation of the site. Titan has no data or records of exploration before 1978. More information about the campaigns since 1978 and data are presented in Sections 7 and 8.
Table 5-3. Record of Drilling Campaigns and Areas Explored
| Year |
Number of Drill Holes |
Areas Explored |
||
| 1978 | 13 | A, BC, F, G | ||
| 1980 | 4 | I, H, G, F | ||
| 1988 | 3 | BI | ||
| 1992 | 18 | BI, BC | ||
| 1996 | 6 | BC, F | ||
| 1997 | 9 | I, J, F, G, H | ||
| 2000 | 13 | BC, F, G, H, I | ||
| 2020 | 23 | BI, G, H, I | ||
| 2024 | 45 | All areas |
17
6 GEOLOGICAL SETTING, MINERALIZATION, AND DEPOSIT
6.1 REGIONAL GEOLOGY
The southern portion of Florida is underlain by up to 20,000 feet of sedimentary rocks ranging in age from the Jurassic Period to the Holocene epoch (170 million years ago to present). Nearly the entire sequence consists of carbonate rock, either limestone or dolomite, with the upper 1,000 feet exhibiting a mixture of carbonates and deltaic clastics (Missimer, 1984). The entire sedimentary sequence was deposited in shallow marine conditions, suggesting that the Florida platform has been slowly subsiding for the majority of its geologic history. Figure 6-1 is adapted from (Scott, 2001) illustrates the surficial geologic units found in southern Florida.
18
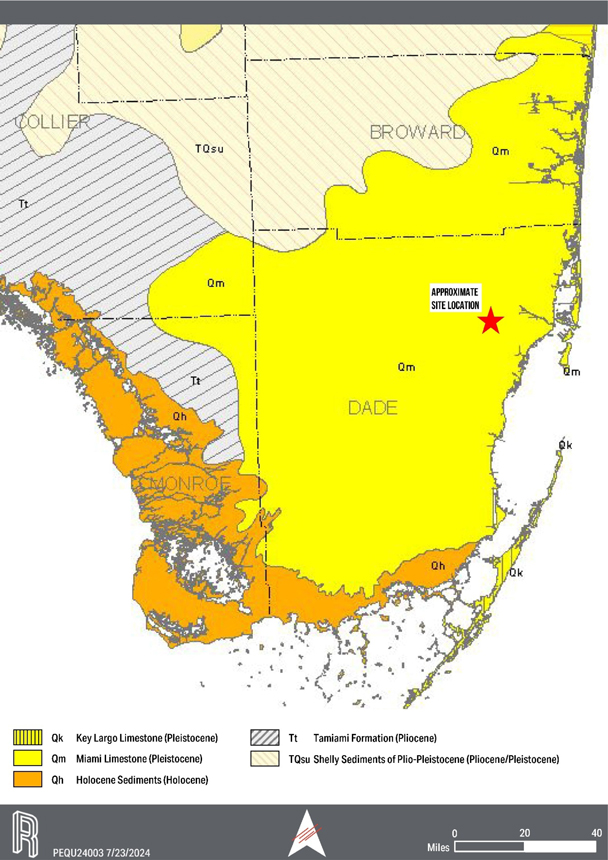
Figure 6-1. Geologic Map of Southern Florida (Scott, 2001).
19
6.2 LOCAL GEOLOGY
The Miami Limestone Formation of Pleistocene age (2.58 to 0.01 million years ago) is the dominant surficial bedrock unit along the Atlantic coast in southern Florida. It extends inland, beneath the Everglades, where it is commonly covered by a thin veneer of organic sediments. The upper Miami Formation is composed of nearly spherical carbonate grains, known as ooids, cemented together. This rock type is termed an oolite and is recognized as a distinct zone of the Miami Limestone named the Oolitic facies (Draper, Maurrasse, Gross, & Gutierrez-Alonso, 2006). The lower portion of the Miami Limestone was, until recently, considered its own unit known as the Fort Thompson Formation. This lower portion predominantly consists of white to orangish gray, poorly to well-indurated, sandy, fossiliferous limestone. Fossils present include mollusks, bryozoans, and corals. For this reason, the lower portion is referred to as the Bryozoan facies. Both the upper and lower portions are now, collectively, the Miami Limestone. Underlying the Miami Limestone is the Tamiami Formation of Pliocene age (5.3 to 3.6 million years ago). The Tamiami is a variable mixture of limestone, coquina, quartz sand, and clay (Means, 2022).
6.3 PROPERTY GEOLOGY AND MINERALIZATION
The site geology has been documented through historical drilling programs and reports. The property geology was initially described in a 1997 Tarmac Report (Morse, 1997), which states:
Limestone is extracted from the Miami Oolite and Fort Thompson formations. These formations are composed of very shelly marine and freshwater limestones. The Miami Oolite is a thin layer, less than 6 feet thick, lying directly below an overburden of everglades muck averaging 4 to 6 feet thick. The Fort Thompson underlies the Miami Oolite and averages 55 to 65 feet thick. Underlying this is the Tamiami Formation which is silty sand of little commercial value.
Given the change of formation names by the Florida Geologic Survey, the site geology is best described from the most recent drilling campaigns of 2022 and 2024 as follows:
| | Everglades peat muck, which is a black organic-rich overburden, averaging 3 to 6 feet in thickness |
| | Miami Limestone with an overall thickness averaging 65 to 70 feet, with areas exceeding 80 feet, subdivided into three distinct facies: |
| | Oolitic Upper facies: 5 feet in thickness, comprising a hard white limestone with sandy texture, occasional oolitic sections, highly solutioned, usually infilled with sand silt and clastic rock fragments |
| | Middle facies: averaging 20 to 25 feet in thickness, comprising marine to freshwater limestones of light gray to buff coloring, micritic to fine grained with abundant calcite cemented infilled solution channels |
| | Bryozoan Lower facies: averaging 35 to 40 feet in thickness, comprising a complex sequence of fossiliferous tan to white sandy limestones; hardness varying from soft to hard with texture varying from micritic to medium grained |
| | Observed in some recent cores that recrystallization of the limestone has occurred |
| | Tamiami Formation, which generally underlies the Miami Limestone comprising fine to very fine unconsolidated sands and weakly cemented carbonates, grey to tan to grey-green in color |
The Miami Limestone is the source material for the production of cement and construction aggregates. Previous Resource reports and geological investigations subdivided the Miami Limestone into the Miami Oolite and the Fort Thompson Formations. The Miami Oolite would be synonymous with the Oolitic upper facies previously described. The Fort Thompson would be synonymous with the Middle facies and the Bryozoan facies combined.
20
Given the young geologic age of the formations, little to no geologic structure exists in the strata. The three geologic formations are flat lying with no discernible regional strike and dip. Locally, undulations are present in the lower contact of the Miami Limestone and the Tamiami Formation. Solution cavities infilled with siliceous sands and silts or calcareous infill form the microstructure and influence the chemical composition of the material.
6.4 STRATIGRAPHY AND MINERALOGY
The site stratigraphy is relatively simple given the flat lying geology. The regional stratigraphy is shown in Figure 6-2 and the site stratigraphy is shown in Figure 6-3 cross section of a mining pit.
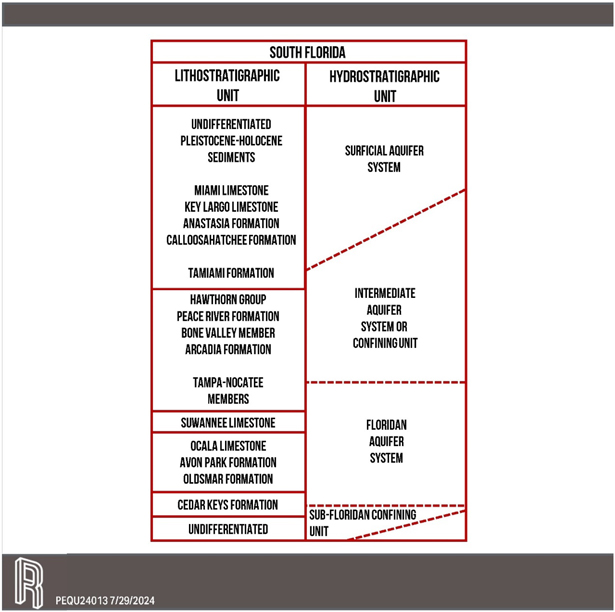
Figure 6-2. Typical Stratigraphic Column [Modified From (Scott, 2001)].
21
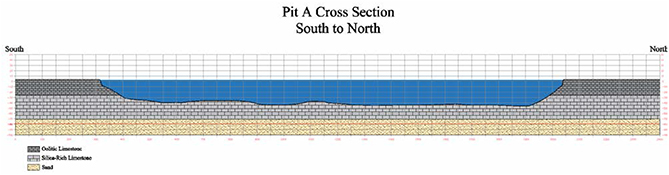
Figure 6-3. Cross Section of the Permitted Area.
The mineralization of the Miami Limestone is based upon the primary depositional environment and the secondary diagenesis involving the creation and infilling of solution channels. This is best observed in the relationship between calcium oxide (CaO) and silica (SiO2). The upper and middle facies combined have a higher CaO percent and lower SiO2 percent when compared to the lower facies. As a result, the upper 30 feet are primarily used for cement kiln feed, and the lower 35 to 40 feet are used for construction aggregates.
22
7 EXPLORATION
7.1 EXPLORATION OTHER THAN DRILLING
7.1.1 GEOPHYSICAL TESTING
The 2024 exploration campaign included down hole geophysics logging to acquire data verification for the in-situ density of the limestone deposit. Two holes were cored and geophysical surveys for density, gamma, and resistivity data were performed.
7.1.2 POND SURVEYS AND BATHYMETRY
Surveys have been completed periodically of the mined areas to determine dig depth and material recovery. As part of the 2024 exploration campaign, a comprehensive survey of the current quarries was completed. This survey provided bathymetry data that were used to calculate the remnant material unmined in each quarry.
7.2 DRILLING PROGRAMS
7.2.1 DRILLING HISTORY
The first recorded drilling campaign at the site was performed in 1978 by Lonestar. Seven drilling campaigns were conducted by previous site owners with differing levels of documentation. Before Titan ownership, databases from drilling campaigns contained core hole data (collar locations, geology, and limited assay information). In addition to this information, drilling campaigns conducted in 1996, 1997, and 2000 also include drill logs.
Titan performed drilling campaigns in 2020 (24 holes) and in 2021 (8 holes) using sonic drilling methods to validate the geology of the deposit. Drill logs, collar information, and assay data were assessed and documented for the holes. The three drilling campaigns are summarized in Table 7-1.
Table 7-1. Exploration Drilling
| Year |
# of Holes |
Description |
||
| 2020 | 24 | Sonic drilling to validate geology; areas: BC, F, G, H, I | ||
| 2021 | 8 | Sonic drilling to validate geology; areas: BI, G, H, I | ||
| 2024 | 43 | Sonic drilling for data verification and to better define the geologic model; all areas |
7.2.2 2020 AND 2021 DRILLING CAMPAIGNS
The 2020 and 2021 drilling campaigns were conducted for broad validation of geology for operational purposes. Detailed logging was not completed, and composite samples were collected for laboratory analysis and were based on mining horizon. Recovery was not recorded.
7.2.3 2024 DRILLING CAMPAIGN
The 2024 drilling campaign consisted of 43 holes across the site. Nine of the holes were drilled to twin previous holes for data verification. The other 34 holes were sited to better define the existing model or to cover areas with no subsurface data. The drilling contractor, Cascade Environmental, provided three sonic rigs to
23
complete the drilling campaign. All holes were drilled with a 4-inch diameter core barrel and a 6-inch casing where necessary, using 5-foot core runs. The CPI protocol for logging and storage was adhered to by the team of field geologists. The total footage drilled was 3,830 feet with an average sample recovery of 77 percent.
Figure 7-1 shows a plan view map of the site with drill holes.
24
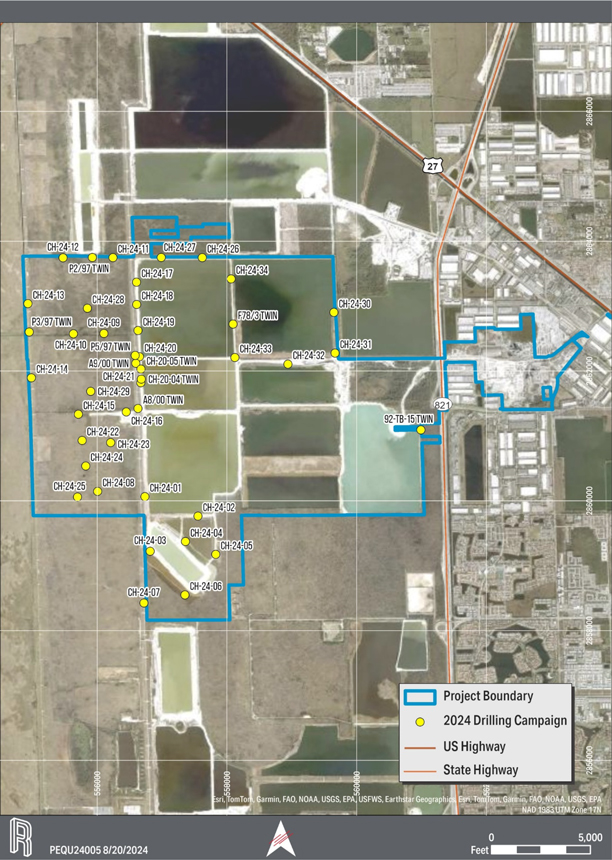
Figure 7-1. Plan View Map of the 2024 Drilling Campaign.
25
7.3 HYDROGEOLOGY INFORMATION
No site-specific hydrogeology investigations or studies are known to exist. More comprehensive studies by the U.S. Geological Survey (Cunningham, Wacker, Robinson, Dixon, & Wingard, 2006) supported the 2009 Supplemental EIS on rock mining over the broader Lake Belt region (USACE, 2009), which supported subsequent permitting and addressed mitigation requirements.
7.4 GEOTECHNICAL INFORMATION
No geotechnical studies for excavation design are known to have been conducted for the site. Studies are not considered necessary because of the relatively shallow excavations and mining method where a buffer of shot rock at angle of repose lays against the unshot wall. The geology is less prone to dissolution features than limestones in central Florida, and no significant stability problems are known to have occurred over many decades of operation.
26
8 SAMPLE PREPARATION, ANALYSES, AND SECURITY
8.1 SAMPLE PREPARATION AND ANALYSES
8.1.1 2000 DRILLING PROGRAM
A drilling program was completed to test the cement plant blend silica (SiO2) content and construction aggregate material. This drilling program was conducted with a sonic coring rig operated by Boart Longyear. The program consisted of 13 holes of which 1,200 feet were cored and 1,093 feet were recovered, resulting in a recovery of 91 percent.
The cores were sampled at 2-foot intervals and split. One set of samples was sent to the on-site laboratory, and the other set was stored for future use. The samples were tested for SiO2 content using a standard acid insolubility test.
8.1.2 2001 TESTING PROGRAM
This campaign was conducted by Titan. The stored samples from the 2000 drilling campaign were reevaluated using the following procedure.
Roughly 300 feet (40 core sections) were resampled to provide complete coverage of the dataset. During the resampling of cores, reconstructing the deposit strata geology was possible to better understand the raw materials lithologic character. The on-site laboratory prepared all sieve analyses under these instructions. Each sample was washed/screened and sieved in three sizes of recorded weights:
| | +10 mesh size |
| | -10 + 200 mesh size |
| | -200 mesh size |
The samples were prepared and shipped to the Kamari Cement Plant laboratory facility in Greece to undergo a full chemical analysis.
8.1.3 2024 DRILLING PROGRAM
Cascade Environmental provided three drills for 14 days during the 2024 drilling campaign. Titan personnel identified the drill hole locations and provided access to the drillers based on the design provided by CPI. The drilled cores were bagged and placed near the drill holes for CPI to log.
CPI conducted comprehensive field-core logging across 43 drill holes, equivalent to 3,830 feet of drilling activity. On site, the core samples were bisected using a saw. The prepared samples were then dispatched to CTL Group (CTL) and Universal Engineering Services (UES), independent construction materials laboratories, for core hole testing.
All samples were split, and the half samples were stored in a locked container at the site. CPI supervised the storage of the samples.
Both laboratories (CTL and UES) are accredited by AASHTO ISO/IEC 17025 and have a validated USACE laboratory status. Additionally, CTL has ISO 9001 certification.
27
Ten-foot limestone core specimens were transported for chemical analysis using X-ray fluorescence (XRF) techniques. One sample underwent specific gravity testing on rock and clay components for every 10 limestone samples. Sample preparation followed the procedures outlined in ASTM C50. Chemical analysis was performed according to the guidelines set by ASTM C1271, while specific gravity evaluations followed the standards of ASTM C127.
8.1.3.1 CTL LABORATORY PROTOCOL
CTL received 12 of 43 borings directly from CPI with an additional 161 crushed samples received from UES. CTL adhered to the following protocol on 359 samples prepared; 22 samples followed AASHTO T84, 24 samples followed AASHTO T85, and 359 samples were XRF analyzed.
| | Sample Labeling and Splitting: |
| | The received samples were logged in the CTL laboratory information management system, and all bags were labeled accurately. |
| | All samples were dried at 110 degrees Celsius overnight. The weight of the dried samples and the as-received sample were recorded. |
| | Depending on whether specific gravity testing was required, two procedures were employed. |
| | Specific Gravity Testing: |
| | All samples were sieved through a #4 mesh sieve. The entire original sample was sieved. |
| | Weights of the passing and retained sieve size fractions were determined and recorded for each sample. |
| | A composite sample for XRF analysis was obtained from passing and retained fractions and sent to the chemistry laboratory for crushing, pulverizing, and XRF testing. |
| | The coarse size fraction (retained on the #4-mesh sieve) was treated as a #57 stone for the T85 testing. |
| | The sample passing #4 mesh sieve was treated as T84 (when applicable). |
| | Any material not used in the T84/T85 testing was stored separately as plus #4 and minus #4 sieve sizes, and materials used in the T84/T85 were also stored separately. |
| | Chemical Testing Only Specified: |
| | The dried as-received sample was split into two halves. One sample half was submitted for chemical preparation/testing, and the other half was saved and stored on site. Any remnant sample material from laboratory testing was returned to the site and is securely stored. |
| | Chemistry Laboratory Sample Preparation and Testing: |
| | Samples submitted to the chemistry laboratory were crushed using a jaw crusher. This operation was performed on composite samples (from specific gravity testing) and half of the original samples for chemical analysis only. |
| | The crushed portion of each sample was subsampled (using a standard splitter), and 100-gram specimens were ground to a minus 100 sieve for XRF analysis. |
| | Pulverized minus 100 material was mixed with flux (lithium metaborate) and fused to prepare a bead for XRF analysis. |
| | XRF analysis was performed on the fused bead. |
28
8.1.3.2 UES LABORATORY PROTOCOL
Of the 534 samples processed, UES adhered to the following protocol: 373 samples were XRF tested by American Engineering Testing (AET) (UESs Subcontracted Laboratory), and 161 samples were XRF tested by CTL.
The laboratory tests performed were AASHTO T27 to determine percent of +/- #4 material, AASHTO T84 Fine and T85 Coarse Specific Gravity & Absorption, and (AET) performed the Chemical Analysis by XRF.
The following process was implemented after samples were received and logged:
| | Oven-dry the sample to constant weight. Record total oven-dry sample weight. |
| | Sieve entire sample over #4 sieve and record weight retained and passing to determine percent of each (AASHTO T27). |
| | Prepare a representative sample of a minimum of 25 grams for XRF based on percent of plus #4 and minus #4. |
| | Ship XRF samples overnight to AET for testing. |
| | Perform AASHTO T85 Specific Gravity & Absorption on the Coarse Aggregate (plus #4 material) |
| | Perform AASHTO T84 Specific Gravity & Absorption on the Fine Aggregate (minus #4 material) |
AET protocols for XRF testing were:
| | Subsample the crushed portion of each received sample (using a standard splitter), and grind specimens to a minus 100 sieve for XRF analysis. |
| | Mix pulverized minus 100 material with flux (lithium metaborate) and fuse to prepare a bead for XRF analysis. |
| | Performed XRF analysis on the fused bead. |
| | Follow ASTM C114-22. |
8.1.4 2024 GEOPHYSICAL DRILLING PROGRAM
Coring and drilling, combined with geophysical logging, were performed at two additional drill hole locations at the site. These two drill holes were contracted with Lapis Global Consulting (Lapis). Through subcontracts to Lapis, J&R Precision Drilling provided coring and drilling services, and Marshall Miller & Associates and RMBAKER LLC provided geophysical logging services. The outcome from this program was used to aid in the development of the in-situ density for the limestone body.
8.2 QUALITY ASSURANCE/QUALITY CONTROL
Numerous drilling campaigns have been conducted at the property. Nine of the holes drilled during these campaigns were used to validate the geology and assimilate older data.
Assays before 2020 were not used because of unknown testing methodology. Assays for the 2020 drilling were used after verification of the data from two twinned drill locations.
The QP additionally noted that many previous drilling locations have since been mined and using past mining records verified the geologic model. These mined areas produced both cement grade and construction aggregate limestone.
29
For verification of the 2024 campaign, a random selection of 12 percent of the samples tested by CTL and UES were sent to Bowser Morner in Dayton, Ohio. A total of 92 samples were sent for verification and results fell within the standard deviation for the major component oxides in the low silica limestone:
| | SiO2 Mean = 6.47%, S.D. = 1.23 |
| | CaO Mean = 50.34%, S.D. = 1.06 |
| | Al2O3 Mean = 0.50%, S.D. = 0.14 |
| | MgO Mean = 0.61%, S.D. = 0.08 |
Limited variogram or geostatistical validation was completed for the site because the mine has operated for more than 40 years and the geology and chemistry is not complicated, is well understood, and has little variation.
8.3 OPINION OF THE QUALIFIED PERSON ON ADEQUACY OF SAMPLE PREPARATION
The QP opines that additional data verification is not necessary at this site because of the extensive surface and subsurface data available.
30
9 DATA VERIFICATION
The 2024 drilling campaign served as data verification of the older drilling and sample testing performed by others over the history of the operation. The analytical procedures of the 2020 and newer campaigns are comparable with modern procedures, and four 2024 drill hole locations were twinned with drill holes from 2020, which allowed for strong matching between geologic units and chemical analyses.
Older drill data were examined, but data verification was much weaker. Data from these older drill holes were reviewed for any major anomalies and overall site history rather than solid geochemical data. Often the old material that was recovered had been completely mined through since the old holes were drilled. Additionally, analytical methods have evolved and improved over time as well, and direct comparisons would not be as exact as desired. Geologic interpretation was made possible based on the detailed core logs, which were completed by experienced geologists. For verification of geology, five pre-2000 holes were twinned.
The confidence in the pre-2024 drilling campaigns is high based on the historical mining and production of cement and construction aggregates.
9.1 OPINION OF THE QUALIFIED PERSON ON DATA ADEQUACY
The QP opines that the adequacy of the data for the purposes used in this TRS is accurate and sufficient. The QP has determined that all referenced data in this TRS and all subsequent modeling meets industry quality standards for the purposes used in the estimation of Resources and Reserves.
31
10 MINERAL PROCESSING AND METALLURGICAL TESTING
The aggregate and cement plants have operated successfully for 63 years. The original testing for the processing system is no longer available. The QPs opinion is that no additional testing is necessary to have confidence in the estimation of Resources or Reserves because the mine has been successfully producing cement products using the processing plant installed at the site which has undergone numerous upgrades under the current ownership. The QP also notes that adequate quality control procedures are established to ensure the production of quality products.
32
11 MINERAL RESOURCE ESTIMATES
11.1 DEFINITIONS
A Mineral Resource is an estimate of mineralization, considering relevant factors such as cut-off grade, likely mining dimensions, location, or continuity, that, with the assumed and justifiable technical and economic conditions, is likely to, in whole or in part, become economically extractable.
Mineral Resources are categorized based on the level of confidence in the geologic evidence. According to 17 CFR § 229.1301 (2021), the following definitions of Mineral Resource categories are included for reference:
An Inferred Mineral Resource is that part of a Mineral Resource for which quantity and grade or quality are estimated on the basis of limited geological evidence and sampling. An Inferred Mineral Resource has the lowest level of geological confidence of all Mineral Resources, which prevents the application of the modifying factors in a manner useful for evaluation of economic viability. An Inferred Mineral Resource, therefore, may not be converted to a Mineral Reserve.
An Indicated Mineral Resource is that part of a Mineral Resource for which quantity and grade or quality are estimated on the basis of adequate geological evidence and sampling. An Indicated Mineral Resource has a lower level of confidence than the level of confidence of a Measured Mineral Resource and may only be converted to a Probable Mineral Reserve. As used in this subpart, the term adequate geological evidence means evidence that is sufficient to establish geological and grade or quality continuity with reasonable certainty.
A Measured Mineral Resource is that part of a Mineral Resource for which quantity and grade or quality are estimated on the basis of conclusive geological evidence and sampling. As used in this subpart, the term conclusive geological evidence means evidence that is sufficient to test and confirm geological and grade or quality continuity.
11.2 KEY ASSUMPTIONS, PARAMETERS AND METHODS
11.2.1 RESOURCE CLASSIFICATION CRITERIA
Each drill hole data point within the model was defined with an influencing area or radius of influence (ROI) for Mineral Resource classification into either Inferred, Indicated, or Measured categories in increasing levels of confidence. The ROI for each category is listed as follows:
| | Inferred 5,280 feet |
| | Indicated 2,640 feet |
| | Measured 1,320 feet |
11.2.2 MARKET AND ECONOMIC ASSUMPTIONS
As an ongoing operation with decades of sales history, the market and economics is detailed in Section 17 and 19. The majority of the Resources are converted to Reserves, and details of the economic parameters are presented in Section 12.
33
11.2.3 CUT-OFF GRADE
The limestone material mined on site is suitable for both cement and construction aggregate production. As such, a true cut-off grade does not exist, but Titan has set a raw mix target of 12 percent SiO2 for cement plant usage. The low silica upper part of the deposit defined by geology and geochemistry has a mean of 6.47 percent with a standard deviation of 1.23 percent, and this material can be used to meet the targeted 12 percent SiO2. Figure 11-1 illustrates the SiO2 distribution of the deposit.
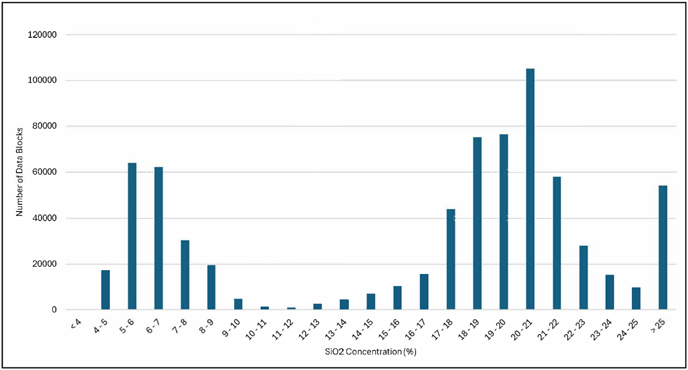
Figure 11-1. Silica distribution in the deposit.
No grade considerations exist for limestone use as construction aggregate. Economic cut-off is not a factor because all material has approximately the same strip ratio.
All Resources are converted to recoverable at the surge pile utilizing a 95% recovery. There is a 5% loss attributed to mining and primary crushing of the material.
34
11.2.4 SUMMARY OF RESOURCE MODEL PARAMETERS
Key assumptions and parameters applied to estimate Mineral Resources are included in Table 11-1.
Table 11-1. Parameter Assumptions
| Modifying Factor |
Parameter |
|
| Proximity to Sample Point or ROI - Inferred | 5,280 feet | |
| Proximity to Sample Point or ROI - Indicated | 2,640 feet | |
| Proximity to Sample Point or ROI - Measured | 1,320 feet | |
| Property Offset (include slopes if applicable) | Variable | |
| Infrastructure Protection Offset | 100-foot minimum | |
| Mineability | Reasonably expected to be feasible to mine | |
| Depth | Bottom of limestone or maximum -80 feet NGVD | |
| Recovery Loss to Surge Pile | 5% |
11.3 RESOURCE MODEL
11.3.1 GEODATABASE
The geodatabase was developed through the assimilation of all existing drill hole data including both geology and assays. The data were checked for completeness and accuracy through the twinning of older datasets. In all cases, the geology of the older datasets wa
s usable, but not all assays were used because of unknown testing methodology (i.e., wet chemistry versus XRF) or testing on large composite samples.
11.3.2 GEOLOGIC AND GEOCHEMICAL MODEL
From the database geologic three-dimensional surfaces and solids were created to define the ore body. These models were created through a combination of hand drawn data points, drill holes, and triangulated irregular network modeling. The units are defined as:
| | Overburden Black brown organic peat, waste material |
| | Low Silica Limestone Ore with SiO2 less than 12 percent suited for cement kiln feed, oolite zone comprising of the upper and middle facies of the Miami Limestone |
| | High Silica Limestone Ore with SiO2 greater than 12 percent suited for construction aggregates, bryozoan zone equivalent to the lower facies of the Miami Limestone |
| | Sand Unmined non-ore SiO2 sand |
A geochemical three-dimensional block model was created using assay data and the geology model. The block model built in SURPAC software encompassed the entire site with each block containing important geospatial and geochemical parameters. The block model measured 23,040 × 23,360 feet and 100 feet vertically.
35
Block sizes were variable in size with the largest blocks measuring 40 × 40 × 10 feet and the smallest 10 × 10 × 2.5 feet. The total block count is 30,650,856 blocks. The following parameters were modeled:
| | Lithology |
| | Al2O3 |
| | CaO |
| | Cr2O3 |
| | Fe2O3 |
| | K2O |
| | MgO |
| | Mn2O3 |
| | NaO2 |
| | SiO2 |
| | SO3 |
| | TiO2 |
| | ZnO |
| | LOI |
All parameters were modeled or interpolated through inverse distance square using a search ellipse with a 20H:1V.
11.3.3 RESOURCE AREA DESCRIPTION
The mine permits divide the allowed mining areas into quarries that will eventually become lakes. The quarries are mined based on permitted restrictions, offsets from easements and infrastructure, and public rights of way. Figure 11-2 illustrates the approved quarries that are the basis for all Reserve and Resource estimations. The depth of the quarries is governed through the permit and is set at the bottom of limestone or a maximum final depth of -80 feet NGVD.
36
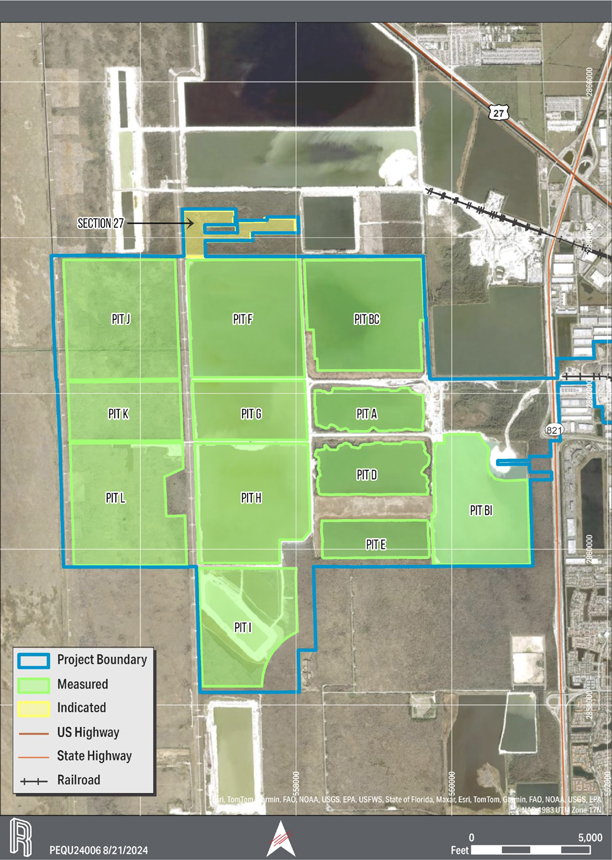
Figure 11-2. Resource Area.
37
11.4 MINERAL RESOURCES
11.4.1 ESTIMATE OF MINERAL RESOURCES
The estimates of Measured, Indicated, and Inferred Mineral Resources for limestone at the site (effective May 24, 2024) are estimated from the application of the Resource parameters to the geologic model and are listed in Table 11-2. The point of reference for the Resource estimate is the limestone surge pile storage for feeding either the cement or aggregates plants.
Table 11-2. Summary of Limestone Mineral Resources at the Effective Date of May 24, 2024
| Resource Category |
Limestone (k tons) |
Grade (%SiO2) |
Grade (%CaO) |
|||||||||
| Measured Mineral Resources |
27,235 | 24.7 | 38.3 | |||||||||
| Indicated Mineral Resources |
20,081 | 15.2 | 45.4 | |||||||||
| Total Measured and Indicated |
47,316 | 20.7 | 41.4 | |||||||||
| Inferred Mineral Resources |
| |||||||||||
| (1) Price is $136/ton of cement and $21.00 /ton of aggregates. U.S. dollars FOB plant site. (2) Mineral Resource point of reference is the limestone surge pile at the plant area. (3) There is a 95% recovery to the surge pile (4) Tons are rounded to the nearest thousand. (5) Sums may not be exact because of rounding. (6) A density factor of 1.55 t/ bank yd3 was applied. |
11.4.2 GEOLOGIC CONFIDENCE AND UNCERTAINTY
A high degree of confidence in the geologic formation exists based on drilling data, regional geologic mapping, and mining history. As such, all targeted extraction areas are considered to contain Measured Resources. Given the limited drilling data, the northern Resources in the north half of Section 27 were classified as Indicated.
11.5 OPINION OF THE QUALIFIED PERSON
The QP opines that the modeling of the Miami Limestone deposit at the site is adequate considering the quality and geologic characteristics of the ore body. Such interpretations were made based on the drilling campaigns, other exploration activities and the mining history at the site. The QP also opines that the Resource estimates have been developed following customary and industry standard practices in the construction materials mining industry. No proprietary methods, standards or software were used in the Resource estimate.
38
12 MINERAL RESERVE ESTIMATES
12.1 DEFINITIONS
The following text provides definitions of Mineral Reserve and the different Mineral Reserve categories according to 17 CFR § 229.1301 (2021):
A mineral reserve is an estimate of tonnage and grade or quality of indicated and measured mineral resources that, in the opinion of the Qualified Person, can be the basis of an economically viable project. More specifically, it is the economically mineable part of a measured or indicated mineral resource, which includes diluting materials and allowances for losses that may occur when the material is mined or extracted.
Probable mineral reserves comprise the economically mineable part of an indicated and, in some cases, a measured mineral resource. Proven mineral reserves represent the economically mineable part of a measured mineral resource and can only result from conversion of a measured mineral resource.
12.2 KEY ASSUMPTIONS, PARAMETERS AND METHODS
12.2.1 RESERVE CLASSIFICATION CRITERIA
Limestone for Pits I, J, K, and L are considered Proven Reserves based on current permitting with a 1,500-foot offset from the western boundary. Pits J, K, and L have additional Probable Reserves based on decreasing the offset to the current maximum allowed with the assumption that the 1,500-foot offset can be mitigated. The modifying factors applied to convert Resources to Reserves were:
| | Owned property |
| | Permit status with federal, state, and local government |
| | Detailed mine planning with well understood mining methodology |
| | Economic viability |
Remnant limestone materials left in previously mined pits (Pits A through H) are considered Probable Reserves. The remnant limestone is not geologically different from unmined areas of the deposit. These materials were left in place and can be recovered via different mining methods. These materials were quantified through detailed bathymetry surveys of the pits utilizing a Teledyne multibeam sensor. The bathymetry work was completed by a professional surveyor. The bathymetric data coupled with historical mining information, was used to define the dimensions of the remnant materials in the pits. The remnant materials are within the permitted pit boundaries and above the permitted pit floor. The modifying factors applied to convert Resources to Reserves were:
| | Owned property |
| | Permit status with federal, state, and local government |
| | Economic viability |
| | Engineering study of mining and economic feasibility of dredge mining |
12.2.2 CUT-OFF GRADE
Limestone is one of many raw materials used in the manufacturing of cement. In addition to limestone, materials high in aluminum and SiO2 are incorporated into the raw mix (feed to the cement plant) to adjust the final product chemistry. The amount of limestone required varies in the industry and depends on the plant design, geochemistry of the source limestone, and market demands. Based on this, no cut-off grade exists, and based on the SiO2 content of the limestone included in the raw mix, Titan has set a target of 12 percent SiO2. This is controlled at the plant via feeders at the surge pile equipped with online analyzing equipment.
39
All Reserves are converted to recoverable at the surge pile utilizing a 95% recovery. There is a 5% loss attributed to mining and primary crushing of the material.
Approximately 30 percent of the mined material per annum is used in the cement plant and the remainder is processed into construction aggregates. As the quality parameters of construction aggregates vary greatly depending on end use and product, no cut-off grades exist for the construction aggregates materials.
Economic cut-off is not a factor because all material has approximately the same strip ratio.
12.2.3 MARKET PRICE
Economic analysis uses commodity prices based on a 2025 cement price of $136 per ton and a blended aggregates price of $21.00 per ton. Both prices are FOB the plant. As stated in Sections 16.3.1 and 19.1.1, cement pricing is based on figures from the USGS and construction aggregates is based on the ASP for products at the site.
12.3 MINERAL RESERVES
The estimate of Proven and Probable Mineral Reserves for limestone (effective May 24, 2024) estimated from the application of the modifying factors and supported by economic analysis are listed in Table 12-1. The point of reference for the Resource estimate is the limestone surge pile storage for feeding either the cement or aggregates plants. Reserve estimates have the same point of reference, which includes a recovery loss of 5 percent. Figure 12-1 shows the Reserves map.
40
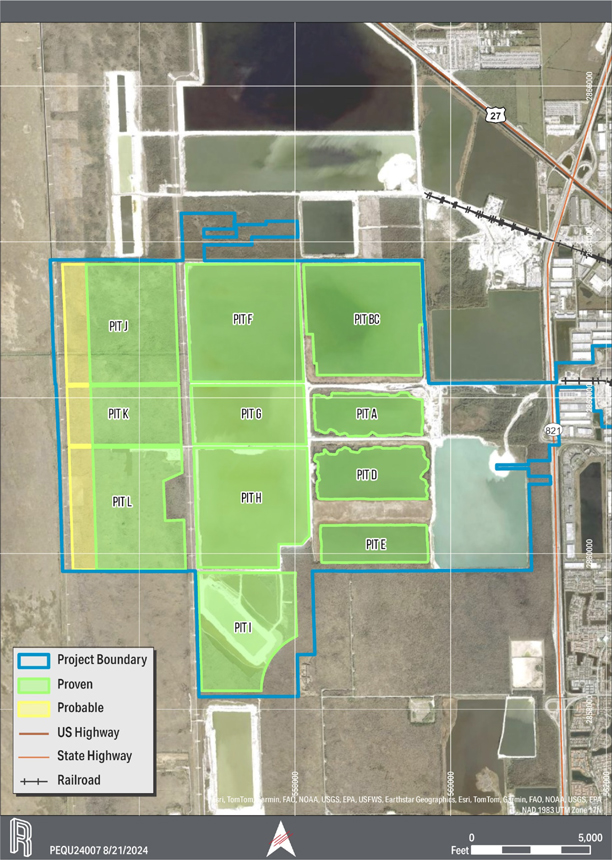
Figure 12-1 shows the Reserves map.
41
Table 12-1. Summary of Limestone Mineral Reserves Effective May 24, 2024 (Page 1 of 2)
| Reserve Category |
Limestone (K tons) |
SiO2 (%) |
CaO (%) |
|||||||||
| Pit A |
||||||||||||
| Proven |
||||||||||||
| Probable |
14,653 | 20.4 | 42.7 | |||||||||
| Total Proven and Probable |
14,653 | 20.4 | 42.7 | |||||||||
| Pit B&C |
||||||||||||
| Proven |
||||||||||||
| Probable |
32,904 | 20.6 | 43.2 | |||||||||
| Total Proven and Probable |
32,904 | 20.6 | 43.2 | |||||||||
| Pit D |
||||||||||||
| Proven |
||||||||||||
| Probable |
11,700 | 22.3 | 40.2 | |||||||||
| Total Proven and Probable |
11,700 | 22.3 | 40.2 | |||||||||
| Pit E |
||||||||||||
| Proven |
||||||||||||
| Probable |
9,388 | 22.9 | 40.2 | |||||||||
| Total Proven and Probable |
9,388 | 22.9 | 40.2 | |||||||||
| Pit F |
||||||||||||
| Proven |
||||||||||||
| Probable |
26,077 | 19.9 | 43.5 | |||||||||
| Total Proven and Probable |
26,077 | 19.9 | 43.5 | |||||||||
| Pit G |
||||||||||||
| Proven |
||||||||||||
| Probable |
12,550 | 18.1 | 43.1 | |||||||||
| Total Proven and Probable |
12,550 | 19.1 | 43.1 | |||||||||
| Pit H |
||||||||||||
| Proven |
||||||||||||
| Probable |
33,270 | 18.5 | 42.5 | |||||||||
| Total Proven and Probable |
33,270 | 18.5 | 42.5 | |||||||||
| Pit I |
||||||||||||
| Proven |
60,180 | 13.8 | 46.5 | |||||||||
| Probable |
||||||||||||
| Total Proven and Probable |
60,180 | 13.8 | 46.5 | |||||||||
| Pit J |
||||||||||||
| Proven |
69,693 | 13.3 | 46.5 | |||||||||
| Probable |
19,722 | 13.3 | 46.5 | |||||||||
| Total Proven and Probable |
89,415 | 13.3 | 46.5 | |||||||||
| Pit K |
||||||||||||
| Proven |
37,102 | 13.1 | 46.5 | |||||||||
| Probable |
9,899 | 13.0 | 46.6 | |||||||||
| Total Proven and Probable |
47,001 | 13.1 | 46.5 | |||||||||
| Pit L |
||||||||||||
| Proven |
73,911 | 14.4 | 46.1 | |||||||||
| Probable |
23,017 | 14.5 | 45.9 | |||||||||
| Total Proven and Probable |
96,928 | 14.4 | 46.1 | |||||||||
| Total |
||||||||||||
| Proven |
240,886 | 13.7 | 46.4 | |||||||||
| Probable |
193,180 | 18.3 | 43.6 | |||||||||
| Total Proven and Probable |
434,066 | 15.8 | 45.1 | |||||||||
Notes:
| (1) | Price is $136/ton of cement and $21.00 /ton of aggregates. U.S. dollars FOB plant site. |
| (2) | Mineral Reserves point of reference is the limestone surge pile at the plant area. |
| (3) | There is a 95% recovery to the surge pile |
| (4) | Tons are rounded to the nearest thousand. |
| (5) | Sums may not be exact because of rounding. |
| (6) | A density factor of 1.55 t/ bank yd3 was applied |
42
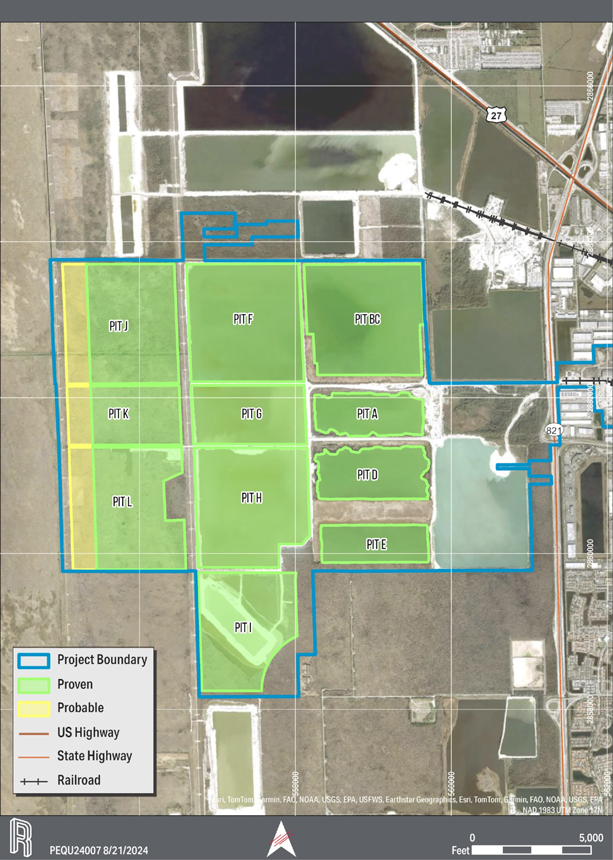
Figure 12-1. Reserves Map.
43
12.4 OPINION OF THE QUALIFIED PERSON
Given the extent of geologic information and mine planning activities at the site, the QP is confident that Reserves can be extracted and processed at the quantity and quality required to meet the sites production schedule and achieve or exceed the quality standards set forth by ASTM.
As part of the study, an economic analysis that included capital expenditure estimates for development, infrastructure relocations, fleet acquisitions, permitting needs, and plant upgrades was performed. Operating expenses were obtained from the cost tracking performed by Titan over its 20 plus year history of operating the site.
The site has a long history of mining and, therefore, the operational and technical feasibility of mining and processing the limestone is well understood.
The risk for permitting the probable reserves does exist for the Phase 3 permits, and this risk is minimal and shared with all operators in the Lake Belt.
The QP opines that the Reserve estimate has been developed following customary standards in the construction materials mining industry. The QP is of the opinion that all relevant technical and economic factors are not likely to be significantly influenced by further work and that any technical and economic issues are not material to the operation.
44
13 MINING METHODS
13.1 GEOTECHNICAL AND HYDROLOGIC CONSIDERATIONS
13.1.1 RESERVE CHARACTERISTICS
The mineral deposit at the site consists of layers that originated from a combination of depositional and erosional processes associated with sea-level fluctuation during the late Pleistocene era. The geology is composed of the following three major sedimentary formations, as discussed in Section 6.3:
| | Holocene Sediments. This portion consists of soil and vegetation. This layer is considered waste and has no economic value for the operation. |
| | Miami Limestone. This portion is divided into two different layersthe oolitic facies used for cement plant feed and the bryozoan facies, which is used for the aggregate plant feed. |
| | Pliocene Sediments. This portion consists of a sandy green to gray clay seam, which is considered the base of the mineable deposit. |
The total thickness of the combination of the Miami Limestone layers varies from 70 to 85 feet. The total remaining virgin mineable area of the site is 1,610 acres. The mineable area for remnant material extraction is an additional 2,400 acres.
Limestone layers are covered by 3 to 5 feet of overburden (primarily organic material, plants, roots, and wood). The overburden is loose and the top of limestone is hard, creating a sharp contact for overburden removal.
13.1.2 SLOPE STABILITY
No geotechnical evaluations have been undertaken by Titan, and no known studies by previous operators have been identified. However, the general mining method has been safely applied at the site for 63 years.
The draglines at the Pennsuco quarry only operate in areas that have been previously prepared and compacted with fill material, using dozers, trucks, and loaders. Also, the dragline keeps a minimum distance from the edge of the excavation (shoreline) of 90 feet from the center of the tub (dragline base).
After blasting and during pad preparation, the dozers knock the berms into the water, effectively extending the shore while compacting the limestone. Mobile equipment compacts the surface, making it stable ground for draglines.
The measured angle of repose for blasted limestone is approximately 32 degrees. When the dragline excavates, it does not create high walls but instead generates slopes as it pulls the material uphill from the bottom of the quarry to the shore. This generates another layer of stability because the shore is held in position by the slope toe generated by the draglines.
Finally, the pad level varies depending on the phreatic level (rain season versus dry season). The top of the pad must be kept at a minimum of 2 feet over the phreatic level to maintain the ground stability necessary to preserve the road and avoid soft ground.
45
13.1.3 HYDROLOGY
The average, typical water level elevation is 5 feet NGVD, but it seasonally varies from 3 feet NGVD to as high as 7 feet NGVD. Most of the time, it covers the overburden layer, giving the area the characteristics of a wetlands. Marine mining methods and equipment have proven successful over decades of operations at the site and many similar operations in Florida. Figure 13-1 shows the historic phreatic level at the site.
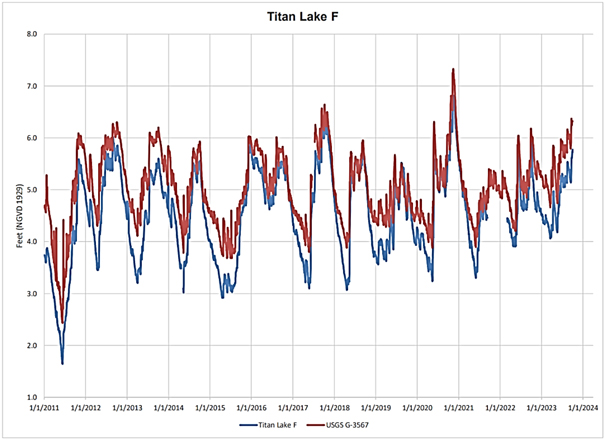
Figure 13-1. Historic Phreatic Water Level Elevation (Source: Annual Lake Belt Report).
13.2 MINE OPERATING PARAMETERS
The quarry currently averages an annual production rate of approximately 10 million tons of limestone to feed both the aggregate plant and the cement plant.
Mining is conducted using draglines for the excavation of the virgin Reserves. The quarries at the site typically cover 300 to 600 acres. The quarries are designed to the target depth of -80 feet NGVD or the contact with the underlying horizon, whichever is higher. Because of the nature of the dragline operation, some material remains on the quarry floor.
The amount of remnant material is a result of previous mining practices and especially the limitations of operating with one primary dragline. Future mining using dredge technology will allow the recovery of this material and any areas left by dragline operations. Also remaining in the quarries are fines that wash out of the dragline bucket during excavation.
Considering these reductions to the Reserve, an overall mining recovery of 95 percent is predicted. Historical yields are not indicative because of the quantity of remnant material.
46
The current quarry excavation extends over an area of approximately 3,045 acres and will increase over the life of the mine to 4,655 acres.
13.3 STRIPPING AND DEVELOPMENT
Removal of the overburden layer does not require blasting. Modified 25-ton front-end loaders excavate and 100-ton haul trucks remove the overburden. The overburden is transported and deposited at predetermined locations for mitigation/mine closure activities or placed inside mined-out quarries (using backhoe excavators for stockpiling and placement). These activities are performed by third-party contractors.
Following the overburden removal, the solid limestone deposit is exposed; however, it is submerged under the phreatic level (underwater). A 5 to 7 foot layer of mined limestone placed on top of the unmined rock is necessary to establish a working bench above the water and achieve the ground stability needed to operate the draglines and other mobile equipment (working surface elevation range of 10 to 12 feet NGVD).
Figure 13-2 shows the current final mine extraction outline.
47
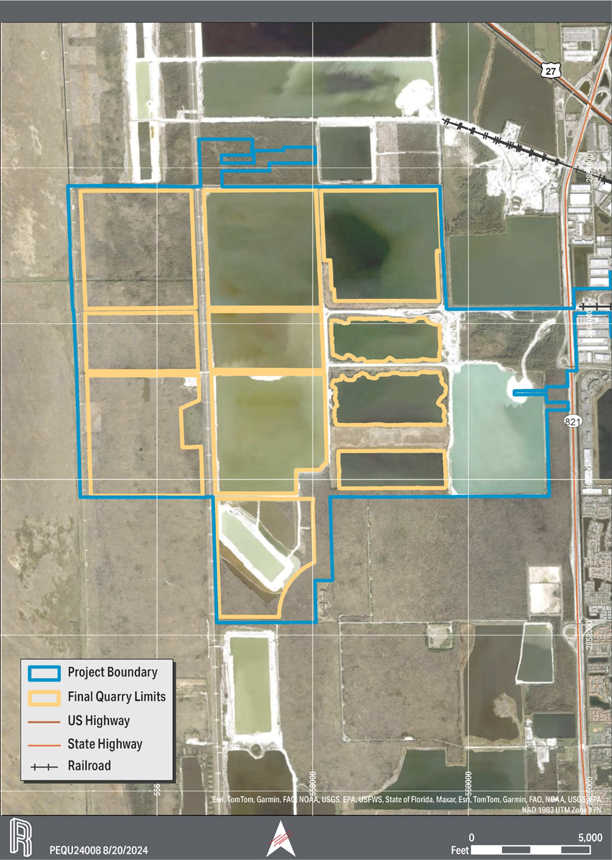
Figure 13-2. Final Quarry Limits.
48
| 13.4 | MINING PLAN |
13.4.1 DRAGLINE EXCAVATION
The quarry excavation averages 75 feet deep (from the surface), and the limestone is extracted from below water levels. Most mines in Lake Belt use draglines to excavate the material. Titan owns and operates three draglines to excavate the material: two Marion 7820 draglines and one Page 732 dragline. In addition, Titan contracts two 4600 draglines to perform remnant mining in areas where the 7820 draglines cannot efficiently mine.
The Marion 7820 draglines use 52 to 58-cubic-yard buckets, and the Page 732 uses 18 to 20-cubic-yard buckets. Overall, each Marion 7820 dragline has a capacity of approximately 7.8 million t/a, and the Page 732 dragline has a capacity of approximately 2.4 million t/a. Therefore, the total excavating capacity for the Pennsuco quarry is 18 million t/a. The Page 732 dragline is used as supporting equipment, and it excavates areas where the Marion 7820 draglines can no longer excavate efficiently (too narrow or at the end of a mining area).
As the limestone deposit has different SiO2 contents on the top and bottom horizons, the Marion 7820 draglines can excavate the layers separately, generating two distinct pile types (High Silica and Low Silica Materials). Load and haul equipment transports the excavated limestone to the primary crusher.
13.4.2 DREDGING
As detailed in Section 12, a portion of the Reserve cannot be recovered using the draglines and will be mined using the dredge mining method. The dredge will discharge the material directly to the shore stockpile using floating conveyors. This material will then be batch fed by loader to the main overland conveyor. No trucking will be required.
The dredge material is mostly from the base of the geologic section that is high in SiO2 and will only be used for aggregate plant feed.
Dredge production is projected at 2.5 million t/a, following the first years ramp up of 1.5 million tons, thus reducing the required dragline mining capacity to 7.4 million t/a. This will reduce dragline, trucking, and primary crusher operating hours.
| 13.5 | MINE PLANT, EQUIPMENT AND PERSONNEL |
The number of trucks allocated to a haul route depends on the hauling distance. The fleet varies from three to nine active trucks, depending on the location of the loading face. The mobile fleet consists of two dozers, a grader, three-wheel loaders, ten haul trucks, and two water trucks.
49
Currently, 105 hourly personnel are required to operate and maintain the mining and haulage operations at the site.
13.6 CONCLUSION
Based on the historical performance of both the aggregate and cement plants, including Title V air permit limitations, the annual production is 9.9 million t/a based on:
| | Cement plant feed 3.0 million t/a |
| | Aggregate plant feed 6.9 million t/a |
To achieve annual plant production the projected quarry production is:
| | Current operation |
| | Dragline 9.9 million t/a |
| | Proposed operation |
| | Dragline 7.4 million t/a |
| | Dredge 2.5 million t//a |
Based on these production levels, the mine life based on the current Reserves (as defined in Section 12) of:
| | The dragline Reserve life is through 2062 and is a 38-year life from January 2025 at a combined dragline and dredge production level of 9.9 million t/a. |
| | The dredge Reserve life is through 2083 and is a 56-year life from January 2028, 21 years beyond the dragline life with the additional years at a production level of 2.5 million t/a. |
50
14 PROCESSING AND RECOVERY METHODS
14.1 PRIMARY CRUSHING
The limestone extracted from the mining process is transported to a primary crusher by 100-ton haul trucks. After crushing, the material is transported via belt conveyors to the surge pile.
Two primary crusher systems (the East Primary and the West Primary) serve different areas of the mining operation, depending on the distance to the crusher. Both primary crushers reduce the limestone to an 8-inch minus material. The discharge material is conveyed 3.5 miles by an overland conveyor to the surge pile. The system uses a batch operation to transport, crush, and convey either high-silica or low-silica material.
14.2 OVERLAND CONVEYOR
The overland conveyor system connects the primary crushers to the surge pile. The conveyor from the East Primary and West Primary to the surge pile is a 48-inch belt and is rated at 1,650 t/h.
14.3 SURGE PILE
The primary system surge pile is divided into two material sections: High Silica (South Pile) and Low Silica (North Pile). Material from the surge pile can then be transferred to the aggregate plant or the cement plant.
14.4 AGGREGATE PLANT
14.4.1 SECONDARY AND TERTIARY CRUSHING
The secondary and tertiary crushing processes are the first stages in the production of construction aggregates as shown in Figure 14-1. The secondary crusher system receives materials from the surge pile. A series of crushers and screen decks are used to size the material to meet size gradations for various construction aggregate products. Through the crushing and screening process, any fine materials (less than 4 millimeters) generated are transferred as slurry to the sand plant where manufactured sand and cement mill material is recovered.
51
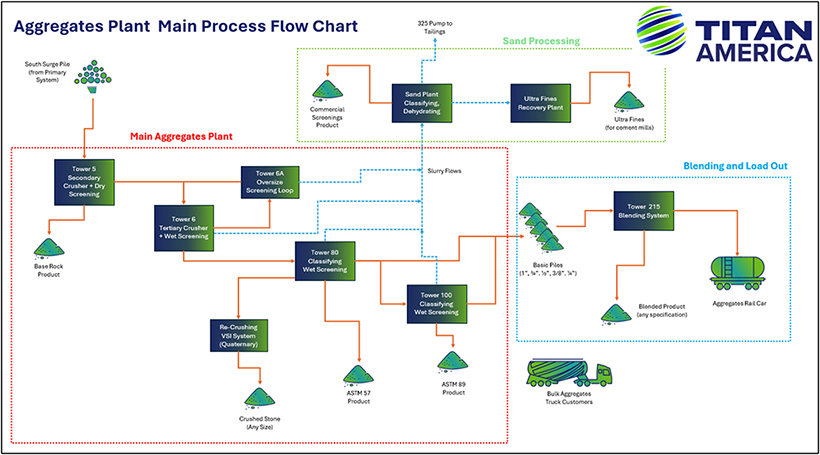
Figure 14-1. Aggregate Plant Main Process Flow Chart.
52
14.4.2 MANUFACTURED SAND PRODUCTION (SCREENINGS)
All slurry from aggregates production is pumped to the sand plant for further processing.
14.4.2.1 MANUFACTURED SAND
The slurry sources are combined into one homogenized stream and then split into four streams that enter separate classifying tanks. These tanks have two functions: to densify the slurry, and to separate sizes through gravity and decantation.
The dense slurry from the classifying tanks is discharged into three separate recovery equipment processes. Two of these processes are screw dehydrators. These screws recover the manufactured sand from the dense slurry, decrease the moisture content (<10 percent by volume), and deliver the product to a series of conveyors that generate product piles. The third process is for ultra-fines recovery (UFR).
14.4.2.2 ULTRA FINES RECOVERY
A portion of the classifying tank discharge is pumped to the UFR plant. The remaining classifying tank discharge is pumped directly to the sediment pond via the slurry pipeline.
This UFR plant consists of a system of hydrocyclones with a high-frequency dewatering screen. The slurry in this plant section contains fine sand (minus 50 mesh). The hydrocyclone densifies the slurry, and a high-frequency screen decreases the moisture to <8 percent content by volume.
The current production capacity of the hydrocyclone system is 150 kt/a. The material is stockpiled and then transported to the alternative raw materials system for feed to the cement mills. The cement mill operation requires approximately 400 kt/a of limestone; therefore, the target substitution is 37.5 percent. Because the hydrocyclone product has a SiO2 content of +30 percent (<70 percent calcium carbonate), substituting 100 percent of the limestone with hydrocyclone product is not possible and it must be mixed with raw limestone from the site. There is a calcium carbonate minimum content on the limestone for cement manufacturing (>70 percent according to ASTM C595).
14.4.3 FINISHED AGGREGATES
The stockpiles are located on top of a blending tunnel. Each pile has two gate feeders that direct the material to a main conveyor. The gates are calibrated to deliver different proportions of material quantities to blend the materials into various products.
Once the materials are placed onto the conveyor, the flow is directed to two inclined vibrating screens for a final wash and blending. The final products are loaded onto rail cars or directed to a product stockpile.
14.4.4 PLANT YIELD
Based on operating history and process flow analysis, the material recovery of the UFR plant is approximately 75 percent, with the waste typically minus 100 mesh.
53
14.5 CEMENT PROCESS PLANT DESCRIPTION
The material process for the cement operation is illustrated in Figure 14-2. The cement plant consists of the clinker plant, the grinding plant, and the packhouse.
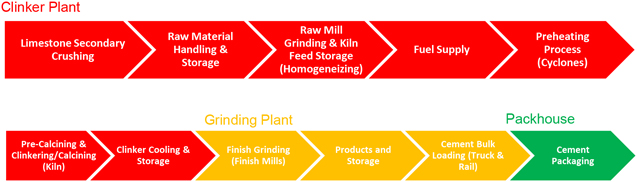
Figure 14-2. Cement Plant Process.
The plant components are typical of a dry process cement plant. The clinker section includes material blending, a vertical roller raw mill, a five-stage preheater tower, a calciner, a rotary kiln, and clinker cooling and storage. Cement grinding includes material handling for additional additives, three finish mills, and product silos. The overall process flow of the cement plant is presented in Figure 14-3.
54
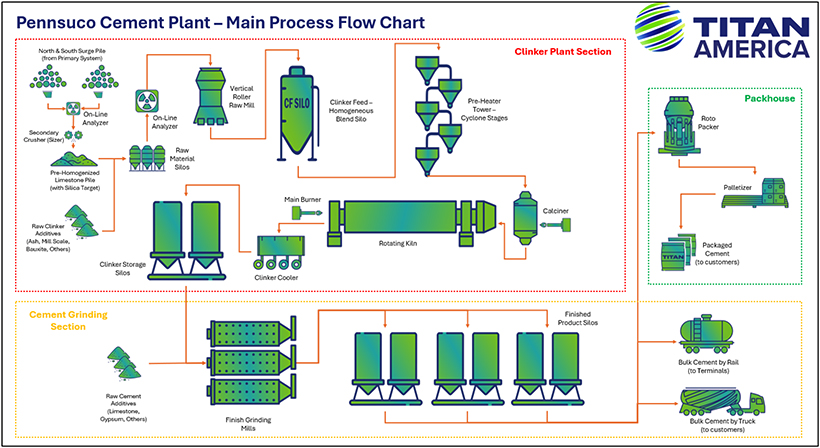
Figure 14-3. Cement Plant Process Flow Chart.
55
14.6 PLANT THROUGHPUT AND DESIGN
The construction aggregate plant feed averages 1,890 tons per hour (t/h). The product output is 1,400 t/h on average with approximately 400 t/h of tailings (limestone slurry) generated. For additional information about our pit to product limestone mass balance see item 14.7.3 below.
Cement plant throughput at key stages of the process is as follows:
| | Limestone feed to raw mill averages 339 t/h. |
| | Total kiln feed from raw mill averages 384 t/h. |
| | Clinker feed to the cement mills averages 240 t/h. |
| | Total feed to the cement mills averages 290 t/h. |
| | Average cement production is 290 t/h. |
14.7 PLANT OPERATIONAL REQUIREMENTS
14.7.1 ENERGY
The 5-year average annual energy consumption at the site is 256 million kilowatt-hours (kWh). Aggregate operations use 38 million kWh, and the cement operation uses 218 million kWh.
The plant relies on multiple sources of energy. The fuel for firing the kiln can be 100 percent gas, which is supplied by Florida City Gas. The use of natural gas is supplemented by AFs including TDF, PEF, and recycled oil. Currently, the target is to provide 30 to 35 percent of the fuel requirement from AFs. Electricity supply to the site is provided by FPL to a Titan 40 MW substation.
The total fuel consumption for cement operations is 4.3 million British thermal units (BTU) per ton of clinker. The fuel types that provide this fuel include natural gas, PEF, TDF, and used oil.
14.7.2 WATER
Process water used on site is withdrawn from a series of 37 active groundwater wells covered under the Consumptive Water Use Permit. Annual allocation of water does not exceed 9.4 billion gallons (25.75 million gallons per day [MGD]). Maximum monthly allocation does not exceed 1,041 MG. These wells are tracked with certified water meters at each withdrawal point.
14.7.3 PROCESS MATERIALS
Process materials consist primarily of the raw materials mined in quarry operations.
The limestone mined represents approximately 88.2 percent of the feed to the cement raw mill and a substantial amount of the additional material added in the cement finish mills. Other raw materials used in cement manufacturing include fly ash or bauxite (for aluminum) and various sources of iron and SiO2 to manufacture the clinker. Grinding aids and other additives are also used for the different types of cement manufacturing.
Limestone constitutes 100 percent of the feed to the aggregates plant and no other significant materials are required.
Figure 14-4 illustrates the annualized mass flows for each process stage and end products, including the percent recovery. The cement plant process recovery is 100%; the aggregate plant process recovery is 75%.
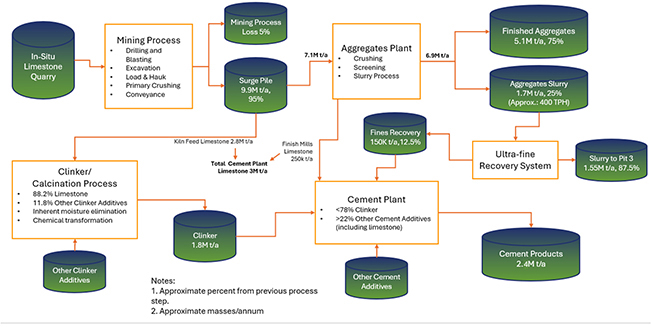
Figure 14-4. Pit to Product Mass Balance.
56
14.7.4 PERSONNEL
The cement plant personnel include 119 hourly employees and the aggregate plant personnel include 84 hourly employees (not including quarry personnel).
14.8 APPLICATION OF NOVEL OR UNPROVEN TECHNOLOGY
None of the processing is considered novel or unproven. Material handling, aggregate crushing and screening, and cement manufacturing plants are based on designs typical for the industry and have been operating successfully for decades at this site.
57
15 INFRASTRUCTURE
Figure 15-1 shows a plan view map of the operation and major infrastructure features. Plant area infrastructure detail is shown in Figure 15-2.
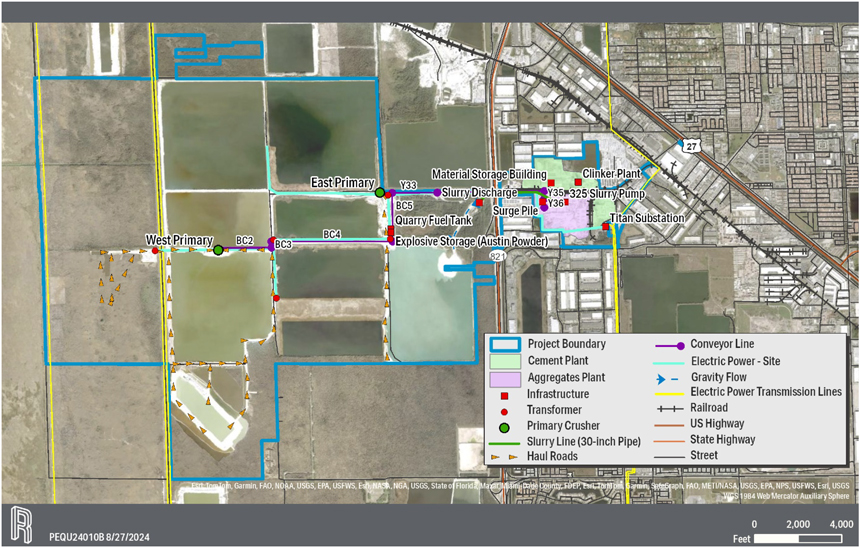
Figure 15-1. Site Infrastructure Features.
58
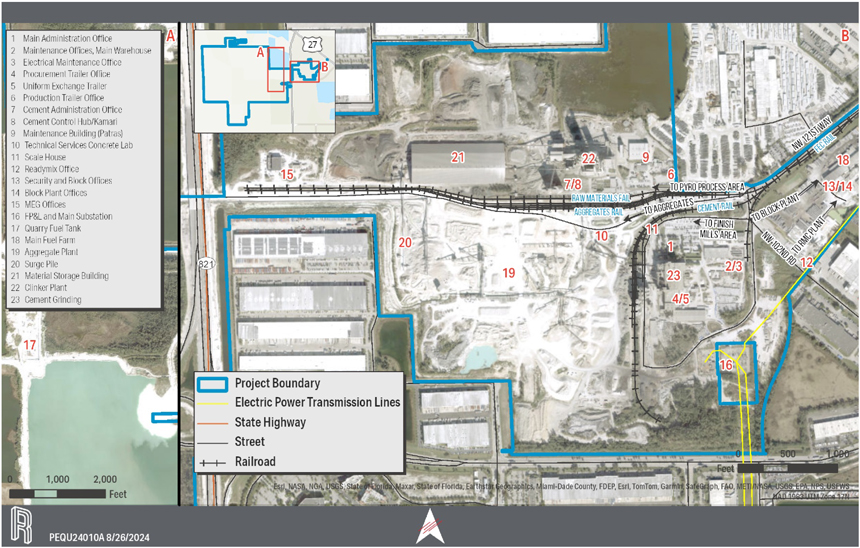
Figure 15-2. Plant Area Infrastructure.
59
| 15.1 | INTERNAL ROADS |
The main entrance roads for the facility and throughout the cement, ready mix, and block operations are two-lane, paved roads. All roads for the aggregate operation are unpaved; company-owned graders maintain these roads.
The roads around the plants, paved and unpaved, are two-way and approximately 30 feet wide, allowing standard commercial and personal vehicle traffic.
| 15.2 | RAIL |
The site has rail access to the FEC Railway, which runs between Miami and Jacksonville. The rail yard at the site is comprised of 21,000 feet of rail tracks and switches and accommodates 260 rail cars. The site has three locomotives and one trackmobile rail car mover to coordinate loading and delivery to the FEC locomotive. Titans terminal network is strategically located approximately every 50 miles on the FEC from Miami to Jacksonville, as shown in Figure 16-3. The FEC connects to other railways across the eastern United States, including CSX Corporation (CSX) and Norfolk Southern.
| 15.3 | NATURAL GAS |
Titan maintains a contract with Florida City Gas. Natural gas service to the site was established in 2019-2020. This project upgraded the Florida City Gas distribution system to serve the cement plant. A new regulation station at NE Hialeah Gate Station was built at the Florida Gas Transmission take-off point. The system was designed and tested to serve the cement plants full load (100 percent natural gas firing).
| 15.4 | ELECTRIC POWER |
FPL provides electric service to the site from the 165 MW capacity Pennsuco substation. This substation supplies transmission-level voltage (230 kilovolts [kV]) to the Titan-owned, 40 MW substation. During a transmission fault, the substation breakers trip, isolating the system, and Titans electrical feed is then received from other transmission sources within North and South Miami-Dade County.
The Titan owned substation supplies power to the cement, aggregate, and quarry operations. This substation has three step-down transformers (from 230 kV to two units for 13.8 kV and one for 4.16 kV). The emergency power supply is delivered to the main substation. The four generators (4160 V, 1650 kW, 286 A each) can support critical loads and lighting services during a primary utility failure.
| 15.5 | ALTERNATIVE FUELS INFRASTRUCTURE |
Natural gas is the primary fuel consumed by the cement operation; however, three AFs are available for consumption: TDF, PEF, and recycled-used oils for use in the cement plant kiln and preheat system.
The consumption of AFs is measured in terms of Thermal Substitution Rate (TSR) as compared to the consumption of the main fuel. In the future, a parallel feeding system to the kiln calciner will make it possible to reach a total of 40 percent TSR.
60
TDF and PEF are introduced into the calciner. Used oils derived from commercial off-road diesel are consumed as an AF during the preheating of the kiln and calciner system.
15.5.1 TIRE-DERIVED FUEL
Titan consumes shredded used tires as a TDF for the preheater. The TDF feed system was installed in 2015. Currently, the TDF feeder can feed up to 40,000 tons annually, equivalent to a TSR of 20 percent, the operational capacity is limited by availability of raw materials and feeder capacity to the calciner.
15.5.2 PROCESSED ENGINEERED FUEL
In 2020, Pennsuco commissioned a new PEF facility east of the preheater tower. This facility enabled Titan to receive commercial waste directly from waste management facilities. The PEF facility consists of a warehouse, where waste is received, processed, homogenized, and fed to the kiln and the calciner.
15.5.3 SUMMARY
The current infrastructure consumes various AFs, targeting up to 35 percent of the fuel requirement. The availability of raw materials is one of the restrictions for TSR. Titan has engaged suppliers on long-term contracts for AFs. The suppliers provide shredded tires and commercial waste to the facility for processing. Used oils use the same feed systems as diesel.
| 15.6 | FUEL STORAGE |
The following main fuel storage areas are on site (Figure 15-1):
| | Main Fuel Farm. This site is located near the block plant. All tanks at the fuel farm are located within a concrete containment with a roof and include two 10,000-gallon diesel tanks and one 2,000-gallon gasoline tank. |
| | Quarry Fuel Tank. The quarry fuel tank is a double-walled 10,000-gallon diesel tank with leak detection. |
| | Generator Fuel Storage. The backup generators at the site substation have self-contained fuel tanks. The Marathon mobile generators have four 1,000-gallon tanks, each with a secondary wall and leak detection. The 1,250-gallon tank Caterpillar generator is for the preheater tower and is in an enclosed concrete area. |
Titan contracts drilling and blasting activities. Titan personnel do not handle any explosives, agents, materials, or boosters.
The blasting contractor stores explosives on site in two 60-ton vertical storage bins. The electronic blasting caps and boosters are stored in Bureau of Alcohol, Tobacco, Firearms and Explosives (ATF) approved Type 2 magazines.
| 15.7 | DUMPS |
The organic overburden at the quarries is used to construct mitigation areas (littoral shelves) or placed within the quarry lakes. The aggregates processing plant produces fines as its sole by-product. This material consists of fine inert limestone material recovered from the washing stages in the aggregates process. The fines are transported as a water-based slurry via pipeline and are discharged to the same quarry lakes. As a result, there are no dedicated dump facilities.
61
| 16 | MARKET STUDIES |
| 16.1 | MARKET OUTLOOK AND PRICE FORECAST |
16.1.1 INTRODUCTION
The site is one of the five largest mines in the Lake Belt area in Miami-Dade County. The Lake Belt mines supply more than 50 million tons of limestone to the Florida market annually and 50 percent of the Florida Department of Transportation-grade construction aggregates.
Titan mines an average of 9.9 million tons per year, 30 percent to produce cement and the other 70 percent to produce finished construction aggregates.
16.1.2 MARKET PAST AND FUTURE IMPACTS
16.1.2.1 CEMENT
Since 2014, Floridas cement consumption has increased by a cumulative average growth rate of 5 percent through 2023. Cement consumption has grown from 6.5 million tons to 10.4 million tons, as shown in Total Florida Cement Consumption Actual and Forecast Figure 16-1. The 2024 Portland Cement Associations Spring Forecast for Florida (PCA, 2024) shows an additional 15 percent growth in cement consumption between 2024 and 2028, with overall volumes reaching 12 million tons. This growth in cement consumption in the state of Florida is powered by market fundamentals, such as population growth and large state-funded infrastructure spending.
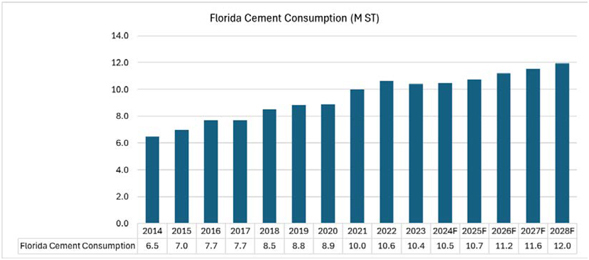
Figure 16-1. Total Florida Cement Consumption Actual and Forecast.
The cement plant is positioned to capture the growth of some of the countrys fastest-growing Metropolitan Statistical Areas (MSAs): Orlando, Tampa, Jacksonville, and Miami-Dade County, as shown in Figure 16-2.
62
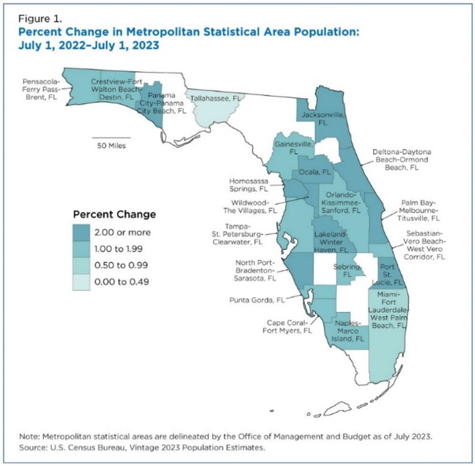
Figure 16-2. Year-Over-Year Florida Population Growth by County.
Titan pioneered low-carbon cement development in the United States, with the first Portland Limestone Cement approved by any Department of Transportation (DOT) in 2017. It was the first cement plant in the United States to convert 100 percent of its products to lower carbon cement in 2022.
16.1.2.2 CONSTRUCTION AGGREGATES
Floridas population growth dynamics have significantly influenced the demand for construction materials. The states population increased from 3 million in 1950 to 11 million in 1984 and 22 million in 2024. The residential growth in South Florida led to significant development of residential and infrastructure projects, which stimulated the construction aggregates market. The aggregate market will remain strong as the projected population grows. Other factors affecting aggregate demand are:
| | Increased public spending on infrastructure projects. The federal government passed the Infrastructure Investment and Jobs Act (IIJA), which allocates $550 billion for roads, bridges, transit, water, broadband, and shaping sectors over the next 5 years (USDOT, 2023). This creates more demand for aggregates nationwide, especially in states like Florida. |
| | Urbanization of the population. As more people move to urban areas, the demand for high-density construction will rise. This will require more aggregates for building taller and stronger structures, such as skyscrapers, apartment buildings, and parking garages. Urbanization will create more demand for aggregates to improve urban services, such as water, sewer, power, and communication networks. |
63
Florida faces frequent threats from hurricanes and other natural disasters that affect the aggregates market. These events can disrupt the supply and production of aggregates in the short term; however, they also create a surge in demand for rebuilding and repairing the damaged infrastructure and buildings.
16.1.2.3 COMPETITOR ANALYSIS CEMENT
The State of Florida has six active cement plants with a combined maximum cement production capacity of approximately 10 million tons annually (North American Cement Directory, 2023). Four companies own the six cement plants:
| | Titan owns and operates Pennsuco. |
| | Cemex owns and operates two plants - Miami and Brooksville. |
| | CRH owns and operates two plants - Sumterville and Branford. |
| | Summit owns and operates Newberry. |
These companies report their annual production capacities and publish them in the North American Cement Directory. Although the reported yearly production capacity in Florida is 10 million tons, the observed cement produced ranges between 7 and 8 million tons (Portland Cement Association, 2024).
| | Titans Pennsuco cement plant is the largest plant in the state (2.4 million t/a). This annual capacity is 400 thousand tons greater than the next largest cement plant in the state. |
| | Cemex serves the Florida market through its Miami (1.5 million t/a) and Brooksville (2 million t/a) plants; ocean terminals in Port Everglades, Pensacola, Tampa, and Palm Beach; and several rail terminals. |
| | CRH increased its market footprint after the acquisition of Sumterville (1.2 million t/a) and Branford (1 million t/a), which supply the central and northern parts of the state. CRH can import through its ocean terminal in Port Manatee, on the west coast of Florida. |
| | Summit (Argos) supplies the Florida market from its Newberry cement plant (1.9 million t/a). At the Tampa Port, it has import capabilities for cement and slag grinding units (0.7 million t/a). |
The gap between the domestic production and the total annual demand is serviced through cement imports to the state. In 2023, the state demand was 10.4 million tons, with imports supplementing the market with approximately 2.5 to 3 million tons. These tons are supplemented by imports through Floridas eight marine ports. Statewide imports have grown from 6 percent in 2014 of total cement in the market to nearly 30 percent in 2023. Cemex, Heidelberg Materials, and Titan are the largest cement importers in Florida. Heidelberg Materials imports cement to the South Florida market through the ocean terminal in Port Everglades. In 2023, Heidelberg imported 739,000 tons of cement.
16.1.2.4 COMPETITOR ANALYSIS AGGREGATES
The Lake Belt is the largest limestone source in Florida, which accounts for 55 million t/a of production, and includes the following operations:
| | Titan Pennsuco Quarry |
| | White Rock North Quarry |
| | Cemex FEC Quarry |
| | Cemex Krome Quarry |
| | Vulcan Miami Quarry |
64
These five mines all supply aggregates by truck, but some also have the advantage of rail. The Titan Pennsuco and Cemex FEC Quarries have rail capabilities on the FEC Railway, while the Cemex Krome and Vulcan Miami Quarries have access to the CSX Railway.
16.1.3 MARKET REVIEW CONCLUSIONS
The strong demand for construction materials, especially cement and construction aggregates, is influenced by the following:
| | Floridas economy surpassed $1.5 trillion (14th largest economy in the world) (Florida Commerce, 2024). According to the State of Floridas long-run estimate, it is expected to reach $2 trillion by 2030. |
| | The states $20 billion budget surplus supports continued investments in infrastructure and other projects. |
| | In 2022, tourism generated $125 billion in revenue on 134 million visitors (DeSantis, 2024). Tourism is expected to reach 179 million visitors by 2030 (Florida Office of Demographics and Economic Research, 2023). |
| | Florida registered an 86 percent net gain in new corporate headquarters in 2023, generating continued economic diversification and job growth. |
| | Population growth has averaged 820 new residents per day (US Census Bureau, 2024) with a projected total population surpassing 25 million by 2030 (Florida Office of Demographics and Economic Research, 2023). |
| | Eighty-one percent of population growth through 2030 will be concentrated in major metropolitan areas where Titan has a strong market presence. |
| | Infrastructure and climate resilience projects include: |
| | 5-year $83 billion DOT spend: $66 billion Moving Florida Forward Plan and $17 billion IIJA representing state historys most extensive DOT spending plan. |
| | 3-year +$6 billion environmental spend: Achieving More for Floridas Environment Now focused on water management infrastructure projects. |
| | Expansion of existing 20 airports, spaceports, and 15 deepwater seaports. |
| | Sea-level rise, hurricane mitigation, stormwater, and coastal defense spending will continue to generate billions in future projects. |
16.1.4 COMPETITIVE ADVANTAGES
The site has many advantages over competitors, including supply chain, business structure, and innovation. Both the cement and aggregates plants have inbound and outbound access to the FEC Railway, the only cement plant in Florida with this access. This allows for an expanded distribution reach, and the cement plant can receive large quantities of raw materials via rail.
Inbound and outbound access to deepwater Port Everglades allows for potential exports and importation of Titan raw materials for the cement plant.
65
| 16.2 | SALES AND DISTRIBUTION CHANNELS |
16.2.1 DISTRIBUTION CHANNELS
16.2.1.1 CEMENT
Titan can distribute cement directly to the local markets via truck or the unique ability to distribute by rail along the FEC Railway to one of its four distribution terminals along the East Coast that service MSAs of Cocoa Beach, Fort Pierce, Edgewater, and Jacksonville. Roughly 20 percent by volume of all cement sold by the site is packaged, and 80 percent is bulk.
16.2.1.2 AGGREGATES
The aggregates plant sells two main product types: coarse aggregates and screenings (manufactured sand). Coarse aggregates are produced in several sizes. Screenings are a finer limestone, almost sand-like product. Both product types are predominantly used together in concrete applications.
16.2.1.3 RAIL DISTRIBUTION
The aggregates plant has the advantage to distribute aggregates directly from the plant to markets either via truck or via rail along the FEC Railway to one of Titans four distribution terminals, and four ready mix plants, along the East Coast, as shown in Figure 16-3. FEC transports various Titan products, including finish aggregates, bulk cement, bagged cement, and block to major MSAs in the region.
66
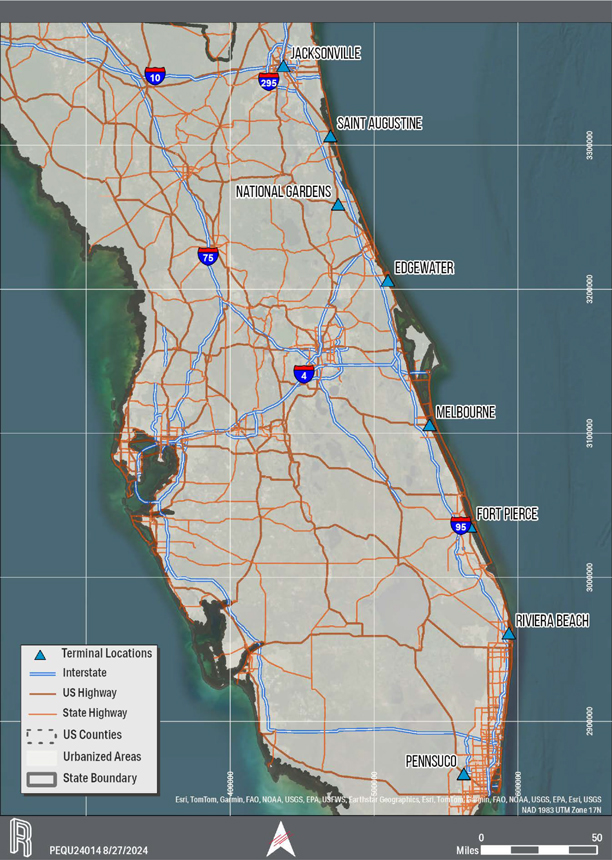
Figure 16-3. Titan Florida Cement & Aggregate Terminal Locations Along the FEC Railway.
67
| 16.3 | COMMODITY PRICES |
16.3.1 PRICE FORECASTS AND KEY INFLUENCING FACTORS (E.G., ECONOMIC CONDITIONS)
Cement pricing has steadily increased over the last decade and is expected to continue this trend based on the current demand for cement.
National figures to define the cement market are published annually by the United States Geologic Survey (USGS). The most recent Mineral Commodity Summary for cement was published in January 2024. The report includes annual data on cement price. The most recent figure is $150 per tonne, or $136.08 per ton. As the cement price data is estimated, the 2023 value is used for the 2025 cement price for this study is $136 per ton.
The COVID-19 pandemic supercharged an already growing Florida economy and accelerated migration, especially to South Florida (Meek, 2024). These conditions resulted in faster-than-average price increases, as shown in Figure 16-4.
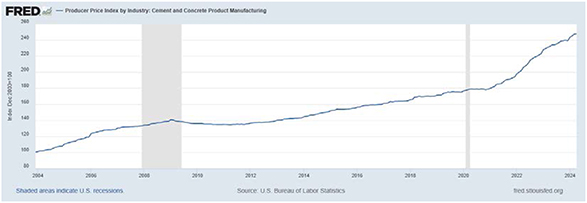
Figure 16-4. Producer Price Index by Industry: Cement and Concrete Product Manufacturing (U.S. Bureau of Labor Statistics, 2024).
| 16.4 | MATERIAL CONTRACTS |
16.4.1 DESCRIPTION OF DIFFERENT TYPES OF CONTRACTS INVOLVED
As part of Titans vertical integration model, much of its cement and aggregate production from the site supports the ready mix and block downstream businesses (40 percent of cement, 60 percent of aggregates). Titan also services other large independent ready-mix producers and contractors.
16.4.2 OVERVIEW OF CRITICAL TERMS AND CONDITIONS IN THE CONTRACTS
There are no special contracts or commitments (take or pay, multi-year agreement).
68
| 17 | ENVIRONMENTAL STUDIES, PERMITTING AND PLANS, NEGOTIATIONS, OR AGREEMENTS WITH LOCAL INDIVIDUALS OR GROUPS |
17.1 ENVIRONMENTAL STUDIES AND PERMITTING REQUIREMENTS
This section outlines the local, state, and federal requirements for permits and entitlements that apply to the site, which consists of an existing cement manufacturing plant and associated limestone quarries.
17.1.1 LAKE BELT AREA
The site is situated in the Lake Belt, which contains high-quality limestone and encompasses 51,000+/- acres of wetlands, as shown in Figure 17-1. The Lake Belt was recognized legislatively as a critical state resource. The Lake Belt is the subject of the Lake Belt Plan, which separated the Lake Belt into two areas-areas where rock mining would potentially be allowed, and the Pennsuco wetlands, a contiguous area that would be protected from mining and preserved, to the extent feasible as natural lands.
69
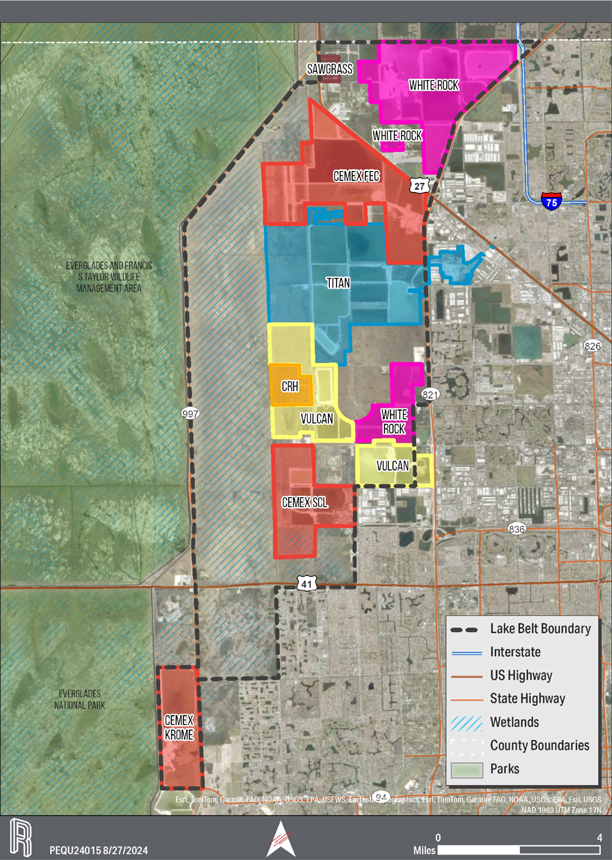
Figure 17-1. Lake Belt Area.
70
The Lake Belt Committee was established in 1992 by the Florida Legislature, which passed legislation creating Chapter 373.4149, Florida Statutes, and established the Northwest Dade Freshwater Lake Plan Implementation Committee (generally known as the Lake Belt Committee). One of the Lake Belt Committees key objectives is balancing mining activities with environmental preservation and enhancing water supply. Each producer in the Lake Belt is responsible for their own permits and site-specific impacts; however, each facility is subject to the overall Lake Belt Plan mine phase planning. Phases 1 and 2 of the Lake Belt Plan were subject to a NEPA EIS evaluation led by the USACE. Currently, producers in the Lake Belt are operating within the approved Phase 1 and Phase 2 areas, as shown in Figure 17-2.
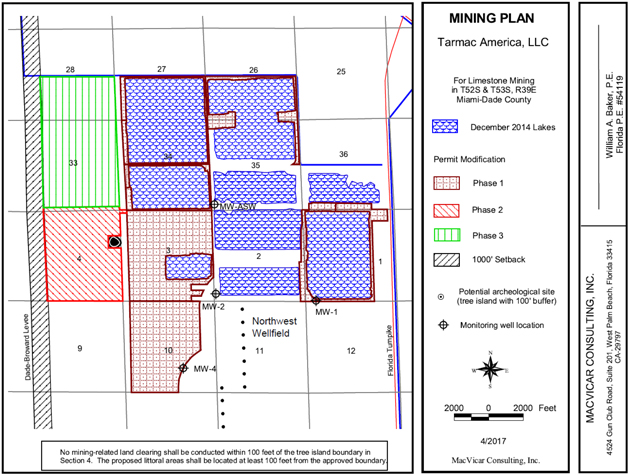
Figure 17-2. Lake Belt Phases (MacVicar Consulting, 2017).
The current permitting efforts for Phase 3 mining and associated wetlands impacts and mitigation will require modification to the sites existing FDEP ERP and USACE 404 Dredge and Fill Permit. The sites Phase 3 permitting effort will also require obtaining a Miami-Dade County Department of Regulatory and Economic Resources, Division of Environmental Resources Management (DERM) Class IV Wetlands Permit and a Miami-Dade County DERM Rock Mining Lake Excavation Permit. Phase 3 mine permit applications for the Lake Belt producers are planned to be submitted prior to December 31, 2024.
71
17.1.2 REQUIRED PERMITS
Table 17-1 lists the current permits at Pennsuco.
Table 17-1. Permit Status
| Issued By: |
Permit Name |
Status |
||
| Local (Miami-Dade County) |
||||
| Miami-Dade County, Zoning | Rock Overlay Zoning Area (ROZA) | Current | ||
| Miami-Dade County, Department of Regulatory and Economic Resources (RER) |
Class IV Wetlands Permit | Current (Pending for Phase 3 Lake Belt Mining Permits) | ||
| Rock Mining Lake Excavation Permit | Current (Pending for Phase 3 Lake Belt Mining Permits) | |||
| Surface Water Management Standard Permit | Current | |||
| 40 Year Building Recertifications | Current | |||
| Solid Waste Permit | Current | |||
| Industrial Waste Annual Operating Permit | Current | |||
| Private Sanitary Sewers Operating (PSO) Permit | Current | |||
| Waste Tire Permit | Current | |||
| State (State of Florida) |
||||
| Florida Department of Environmental Protection (FDEP) |
Environmental Resource Permit (ERP) | Current (Pending for Phase 3 Lake Belt Mining Permits) | ||
| Title V Federal Operating Permit | Current | |||
| Generic Permit for Discharges from Concrete Batch Plants | Current | |||
| South Florida Water Management District (SFWMD) | Consumptive Use Permit | Current | ||
| State Fire Marshall | Construction Mining Permit (Blasting Permit) | Current | ||
| Federal (United States) |
||||
| United States Army Corps of Engineers (USACE) | 404 Dredge and Fill Permit | Current (Pending for Phase 3 Lake Belt Mining Permits) | ||
| United State Fish and Wildlife Service (USFWS) | Consultation regarding Endangered Species (ESA) | Current (Pending for Phase 3 Lake Belt Mining Permits) | ||
72
| 17.2 | WASTE DISPOSAL, SITE MONITORING AND WATER MANAGEMENT |
The organic overburden at the quarries is used to construct mitigation areas (littoral shelves) or placed within the quarry lakes. The aggregates processing plant produces fines as its sole by-product. This material consists of fine inert limestone material recovered from the washing stages in the aggregates process. The fines are transported as a water-based slurry via pipeline and are discharged to the same quarry lakes.
The quarry ERP does not permit dewatering, and the site does not have a National Pollutant Discharge Elimination System (NPDES) permit because no storm or process water leaves the site boundary.
The cement plant does not produce process waste streams. All baghouse dust or cement kiln dust produced is returned to the system. Any spillage or rejected material from the operation is accumulated and re-processed through the limestone surge pile for pyro processing.
The sites stormwater management system is designed to keep all stormwater within the site boundary. The pyro process and finish mills produce a non-contact cooling water stream beneficially reused to wash aggregates.
17.2.1 LOCATION OF MINE WASTE AND WATER MANAGEMENT FACILITIES
The overburden removed during quarry development can be placed in the nearest quarry lake per the applicable permits. When necessary to facilitate reclamation activities, this material is stockpiled along the quarry benches for later use. Water management facilities associated with the quarry operation for dewatering or stormwater management consist of temporary berms around the quarry edge to redirect stormwater into the open quarry lakes.
| 17.3 | POST-MINING LAND USE AND RECLAMATION |
Reclamation of the quarries is regulated by the FDEP.
17.3.1 UPLAND RECLAMATION
Upland reclamation involves contouring and revegetation. Contouring activities are initiated as soon as practical and are completed no later than 1 year after the calendar year in which an area becomes available for reclamation and would not interfere with mining operations. Revegetation activities shall be initiated as soon as practical and completed no later than 1 year after the calendar year in which the final contours are established in an area, and revegetation activities would not interfere with mining operations. Upland revegetation shall at least meet the standards of Chapter 62C-36, F.A.C. Reclamation activities through revegetation shall be completed within 3 years of the final cessation of mining operations at the mine.
17.3.2 SHORELINE RECLAMATION
Shoreline reclamation also involves contouring and revegetation. The contouring for the treatment of final shorelines is initiated and completed no later than 1 year after the calendar year in which the length and final location of the shoreline is established and other mining operations have ceased in the area. Revegetation activities are initiated as soon as practicable and completed no later than 1 year after the calendar year in which the final contours are established in an area and other mining operations have ceased in the area. Littoral zone revegetation shall meet the standards of Chapter 62C-36, F.A.C.
73
Upland and shoreline reclamation activities will occur as portions of the site are mined out and no longer part of the overall operation. Reclamation cost estimates have been developed; however, no reclamation as stipulated above has been completed to date primarily because of continued mining and ancillary activities, including the potential to extract remnant material from the quarry floors.
17.3.3 MINE CLOSURE COSTS
Based upon the reclamation requirements given above mine closure costs have been calculated for the site. The mine closure costs are estimated at $8.3 million dollars. The costs are reviewed and updated on an annual basis by Titan. For accounting purposes, the costs are accrued on a percent completion basis and are subject to depreciation.
| 17.4 | LOCAL OR COMMUNITY ENGAGEMENT AND AGREEMENTS |
The Lake Belt region has well-defined and well-established legal and regulatory framework. The limestone resources present have been recognized as critical to the development and growth of the state of Florida.
Because of the proximity of the site to an important supply of drinking water for South Florida, extraction of the limestone resources at the site is at risk of being jeopardized if contamination were to be detected or if mining permits were to be successfully challenged.
| 17.5 | OPINION OF THE QUALIFIED PERSON |
The QP opines that the current plans are sufficient to address any issues related to environmental compliance and permitting.
74
| 18 | CAPITAL AND OPERATING COSTS |
18.1 SUMMARY AND ASSUMPTIONS
Capital costs (Capex) are primarily estimated using a combination of equipment quotes from recent projects, vendor quotes for mobile equipment, and based on recent experience with similar projects. Operating costs (Opex) are estimated based on historic trends and models to account for future operational changes. These estimates include annual inflation based on the Consumer Price Index percentage. Opex estimates are to a +/- 10% accuracy. Capex estimates are to a +/- 20% accuracy.
| 18.2 | MINING CAPITAL SUMMARY |
Total capital requirements for the operation are calculated at $425.6 million over the life of mine. A breakdown of this capital requirement is detailed in the following sections.
18.2.1 STRIPPING
The quarry performs stripping activities to prepare the mining area. These activities include removing overburden in advance of the blasting schedule. These expenses are capitalized in the period they are incurred and amortized based on production activity at the point of blasting the area.
The estimated costs for stripping are included in the sustaining capital is $130.2 million and are based on historical costs.
18.2.2 SUSTAINING CAPITAL
The capital associated with mining activities is based on 9.9 million tons of limestone extracted annually. These production rates are in line with historical capacity and include the following phases:
| | Sustaining capital for mobile equipment - replacement and refurbishment of haul trucks, loaders, and auxiliary equipment based on estimated hours needed for annual production. Estimated at $173.2 million. |
| | Sustaining capital for draglines - annual capitalizable maintenance, significant refurbishments, and major component replacement, as well as relocation of the Marion 7820 dragline to the Phase 2 mining area. Estimated at $6.2 million. |
| | Sustaining capital for new primary crusher and overland conveyor system: |
| | New primary crusher: 2036/2037 |
| | Replacement of overland conveyor belt: every ~50 million tons |
| | Estimated at $66.4 million |
18.2.3 MINING METHOD EXTENSION
A dredge is currently scheduled to be commissioned in 2028 to extract the remnant material. Based on the current engineering study, the capital cost will be incurred in 2026/2027 and is estimated to be $25.0 million. In addition, estimates for a mid-life cycle refurbishment of the dredge was included in the plan for an additional $24.6 million.
18.2.4 CONTINGENCY
A 10 percent allowance for contingency has been applied to the capital requirements. This is calculated at $29.1 million.
18.3 PROCESSING CAPITAL COSTS
Total aggregate processing capital investment over the evaluation period is estimated at $367 million. In addition, there is existing capital of $39 million to be depreciated over the next 10 years. These estimates include inflation based on Consumer Price Index projections and 10 percent contingency.
The cement processing capital investment over the evaluation period is estimated at $491 million, including growth projects of $17 million. In addition, there is existing capital of $110 million to be depreciated over the next 10 years. These estimates include an inflation based on Consumer Price Index projections and a 10 percent contingency.
75
18.4 MINING OPERATING COST
18.4.1 INTRODUCTION AND ESTIMATE RESULTS
The operating cost estimate for the mining, aggregates and cement processing costs were prepared using historical trends and detailed cost models, which were used during the 2024 annual budgetary planning process. The mining costs are for all activities up to delivery to the surge pile.
Table 18-1 illustrates the estimated mining, aggregate and cement processing costs over the life of mine of 59 years (starting in January of 2025).
Table 18-1. Summary of Mining and Cement Processing Operating Costs over LOM.
| Operating Costs |
(US$M) | |||
| Mining Costs |
$ | 2,596 | ||
| Aggregates Processing Costs |
$ | 11,745 | ||
| Cement Processing Costs |
$ | 4,402 | ||
| Total Costs |
$ | 18,743 | ||
Eighty-five percent of the mining costs are for blasting, repairs, labor, and fuel. In addition, the total mining cost includes:
| | Depreciation for the Sustaining Mining costs |
| | Depletion of the Reserve at $0.18 per ton |
| | Amortization of the capitalized stripping cost |
| | Allocation of SG&A |
The aggregate processing costs include:
| | Material movement, crushing, storage and shipping |
| | Allocation of SG&A |
The cement processing costs include:
| | Grinding, preheating and calcination |
| | Kiln, grinding and storage |
| | Allocation of SG&A |
18.4.2 DEPRECIATION AND AMORTIZATION
The total cost of material per ton to the primary surge pile is the total of the unit operating cost plus the applicable amortization and depreciation. The amortization and depreciation include allowance for previously incurred capital costs.
The existing capital costs of $46.1 million are assumed to be depreciated over a 10-year life. Hence the drop in depreciation in 2035.
Capital costs of $425.6 million are depreciated over 15 years from the date the asset is placed in service, and accelerated at the end of the life of the mine. Furthermore, the capital costs include depletion of $0.18 per ton mined.
76
18.4.3 SUMMARY
The projected total mining cost during the evaluation period is $5.09/ton in 2025 and increases over the evaluation period to reflect changes in depreciation, and annual inflation based on the Consumer Price Index adjustment. The mining cost does not include any contingency and will be addressed though the sensitivity analysis.
77
19 ECONOMIC ANALYSIS
19.1 KEY PARAMETERS AND ASSUMPTIONS
19.1.1 COMMODITY PRICES
The commodity prices utilized in the economic evaluation are determined using a blend of current market prices and long-term forecasts from both internal and external sources.
| | Bulk Cement Pricing. Bulk base cement pricing (for 2025) is set at $136.00 USD per ton. This price is derived from the USGS annual report (as detailed in Section 16) at the cement plant net of freight and distribution expenses. Escalations in price were added based on the SP Global 10-year forecast for cement sales through 2034 and the 2024-to-2034 average rate for the remainder of the evaluation period. |
| | Aggregate Pricing. The average selling price (ASP) for the aggregates is derived from the weighted average of the transfer price to the concrete block plant, the cement mills, the internal usage (Ready Mix plants), and external customers. The ASP in the models for 2025 is $21.00 per ton. This is a 1.9% increase over the 2024 forecast. Escalations in price in future prices are increasing at percent rates varying from 1.9% to 2.6% based on S&P Capital IQs USA Economic & Demographic Data. |
| | Natural Gas. Pennsuco current average price of natural gas is $5.86 per million BTU. Escalation for the evaluation period was based on EIAs Annual Energy Outlook 20231 Table 13. |
| | Diesel Fuel. The off-road fuel cost per gallon, $0.39 per ton of cement, is based on the current average cost. For the aggregate plant off-road fuel the cost per gallon based on $0.15 per ton of aggregate feed. The escalation price is based on EIAs Annual Energy Outlook 2023. |
| | Electricity. The electricity cost is $5.94 per ton of cement, based on current average rates. For the aggregate plant the electricity cost is based on $0.12 per ton of aggregate feed. The escalation price is based on EIAs Annual Energy Outlook 2023. |
19.1.2 INFLATION
The projections for Consumer Price Index Inflation percentages through 2054 were obtained from S&P Capital IQs USA Economic & Demographic Data. These projections were applied to escalate costs that were not directly covered by other basis of estimate methods within the economic model.
19.1.3 LABOR
Labor cost data was sourced from S&P Capital IQs USA Economic & Demographic Data. These data were used to derive and apply labor cost assumptions within the economic model.
19.1.4 PRODUCTION PARAMETERS
| Quarry annual production rate: |
9,900,000 tons per annum | |||
| Cement annual production rate: |
2,401,000 tons per annum | |||
| Aggregate annual production rate: |
5,090,000 tons per annum | |||
| Evaluation Period (from 2025): |
59 years |
19.1.5 OPERATIONAL COSTS
The base rates used in the model were projected over the evaluation period with selling price and cost escalations as defined in the Commodity Prices section.
| 1 | https://www.eia.gov/outlooks/aeo - Annual Energy Outlook 2023 Table13. Natural gas Supply, Disposition, and Prices |
78
Production mix for aggregates and cement remains constant over the Evaluation Period.
19.1.6 CAPITAL EXPENDITURES
Total capital investment over the evaluation period is estimated at $1,327 million.
Total mining investment over the evaluation period is estimated at $468 million. In addition, there is existing capital of $46 million to be depreciated over the next 10 years. These estimates include inflation based on Consumer Price Index projections2 and 10 percent contingency.
Total aggregate processing investment over the evaluation period is estimated at $367 million. In addition, there is existing capital of $39 million to be depreciated over the next 10 years These estimates include inflation based on Consumer Price Index projections3 and 10 percent contingency.
The cement processing capital investment over the evaluation period is estimated at $491 million, including growth projects of $17 million. In addition, there is existing capital of $110 million to be depreciated over the next 10 years. These estimates include an inflation based on Consumer Price Index projections4 and a 10 percent contingency.
19.1.7 TAX RATE
The corporate income tax is 25.5 percent.
19.2 ECONOMIC VIABILITY
19.2.1 ECONOMIC VIABILITY
The summary of the financial model for the combined cement and aggregate operations is detailed below. Due to the uncertainty of the timing of specific capital expenditures, except for the mining capital (as defined in Section 18), the analysis is presented with Depreciation and Amortization. There is no interest line item as the model is always cash positive and hence has no interest payments
The economic analysis for the combined cement and aggregates operations is shown in Table 19-1 assuming the product production rates over LOM as defined in section 19.1.4.
| 2 | S&P Capital IQ |
| 3 | S&P Capital IQ |
| 4 | S&P Capital IQ |
79
Table 19-1. Economic Analysis Model
| 2025F | 2026F | 2027F | 2028F | 2029F | 2030F | 2031F | 2032F | 2033F | 2034F | |||||||||||||||||||||||||||||||
| Net Revenue |
$ | 433 | $ | 450 | $ | 457 | $ | 467 | $ | 479 | $ | 490 | $ | 502 | $ | 514 | $ | 526 | $ | 538 | ||||||||||||||||||||
| Operating Expenses |
292 | 301 | 308 | 314 | 324 | 324 | 329 | 336 | 344 | 349 | ||||||||||||||||||||||||||||||
| Operating Income |
141 | 49 | 149 | 154 | 154 | 167 | 173 | 179 | 182 | 189 | ||||||||||||||||||||||||||||||
| Adjustments to Cash Flow* |
54 | 53 | 62 | 45 | 35 | 42 | 32 | 35 | 42 | 50 | ||||||||||||||||||||||||||||||
| Cash Flow |
$ | 87 | $ | 96 | $ | 87 | $ | 109 | $ | 119 | $ | 125 | $ | 141 | $ | 144 | $ | 140 | $ | 139 | ||||||||||||||||||||
| 2035F | 2036F | 2037F | 2038F | 2039F | 2040F | 2041F | 2042F | 2043F | 2044F | |||||||||||||||||||||||||||||||
| Net Revenue |
$ | 553 | $ | 567 | $ | 583 | $ | 598 | $ | 615 | $ | 631 | $ | 648 | $ | 666 | $ | 684 | $ | 702 | ||||||||||||||||||||
| Operating Expenses |
356 | 366 | 381 | 392 | 399 | 406 | 414 | 424 | 431 | 438 | ||||||||||||||||||||||||||||||
| Operating Income |
196 | 201 | 202 | 207 | 216 | 225 | 234 | 242 | 253 | 264 | ||||||||||||||||||||||||||||||
| Adjustments to Cash Flow* |
61 | 39 | 77 | 83 | 47 | 57 | 49 | 83 | 57 | 69 | ||||||||||||||||||||||||||||||
| Cash Flow |
$ | 135 | $ | 162 | $ | 125 | $ | 124 | $ | 169 | $ | 167 | $ | 185 | $ | 159 | $ | 196 | $ | 195 | ||||||||||||||||||||
| 2045F | 2046F | 2047F | 2048F | 2049F | 2050F | 2051F | 2052F | 2053F | 2054F | |||||||||||||||||||||||||||||||
| Net Revenue |
$ | 721 | $ | 741 | $ | 761 | $ | 781 | $ | 802 | $ | 824 | $ | 846 | $ | 869 | $ | 892 | $ | 916 | ||||||||||||||||||||
| Operating Expenses |
449 | 458 | 466 | 474 | 483 | 494 | 507 | 516 | 529 | 543 | ||||||||||||||||||||||||||||||
| Operating Income |
272 | 282 | 295 | 307 | 319 | 329 | 339 | 353 | 363 | 374 | ||||||||||||||||||||||||||||||
| Adjustments to Cash Flow* |
86 | 69 | 63 | 79 | 77 | 89 | 104 | 92 | 92 | 123 | ||||||||||||||||||||||||||||||
| Cash Flow |
$ | 186 | $ | 213 | $ | 232 | $ | 228 | $ | 241 | $ | 240 | $ | 235 | $ | 260 | $ | 271 | $ | 251 | ||||||||||||||||||||
| 2055F | 2056F | 2057F | 2058F | 2059F | 2060F | 2061F | 2062F | 2063F | 2064F | |||||||||||||||||||||||||||||||
| Net Revenue |
$ | 941 | $ | 966 | $ | 992 | $ | 1,019 | $ | 1,047 | $ | 1,075 | $ | 1,104 | $ | 1,134 | $ | 101 | $ | 103 | ||||||||||||||||||||
| Operating Expenses |
554 | 565 | 576 | 588 | 601 | 614 | 627 | 641 | 84 | 83 | ||||||||||||||||||||||||||||||
| Operating Income |
387 | 401 | 416 | 431 | 446 | 461 | 477 | 493 | 17 | 20 | ||||||||||||||||||||||||||||||
| Adjustments to Cash Flow* |
86 | 107 | 97 | 108 | 112 | 118 | 120 | 124 | -40 | -4 | ||||||||||||||||||||||||||||||
| Cash Flow |
$ | 302 | $ | 294 | $ | 320 | $ | 323 | $ | 334 | $ | 343 | $ | 357 | $ | 368 | $ | 56 | $ | 24 | ||||||||||||||||||||
| 2065F | 2066F | 2067F | 2068F | 2069F | 2070F | 2071F | 2072F | 2073F | 2074F | |||||||||||||||||||||||||||||||
| Net Revenue |
$ | 106 | $ | 109 | $ | 112 | $ | 115 | $ | 118 | $ | 121 | $ | 124 | $ | 127 | $ | 131 | $ | 134 | ||||||||||||||||||||
| Operating Expenses |
83 | 83 | 83 | 82 | 82 | 83 | 83 | 84 | 85 | 85 | ||||||||||||||||||||||||||||||
| Operating Income |
23 | 26 | 29 | 33 | 36 | 38 | 41 | 43 | 46 | 49 | ||||||||||||||||||||||||||||||
| Adjustments to Cash Flow* |
-2 | -1 | 4 | 3 | 4 | 11 | 8 | 8 | 10 | 10 | ||||||||||||||||||||||||||||||
| Cash Flow |
$ | 25 | $ | 27 | $ | 25 | $ | 30 | $ | 32 | $ | 27 | $ | 33 | $ | 36 | $ | 36 | $ | 39 | ||||||||||||||||||||
| 2075F | 2076F | 2077F | 2078F | 2079F | 2080F | 2081F | 2082F | 2083F | Total | |||||||||||||||||||||||||||||||
| Net Revenue |
$ | 138 | $ | 141 | $ | 145 | $ | 149 | $ | 153 | $ | 157 | $ | 161 | $ | 165 | $ | 170 | $ | 30,313 | ||||||||||||||||||||
| Operating Expenses |
86 | 87 | 88 | 90 | 91 | 93 | 95 | 97 | 101 | 18,743 | ||||||||||||||||||||||||||||||
| Operating Income |
51 | 54 | 57 | 59 | 61 | 64 | 66 | 68 | 68 | 11,571 | ||||||||||||||||||||||||||||||
| Adjustments to Cash Flow* |
12 | 12 | 13 | 14 | 15 | 16 | 16 | 17 | 18 | 2,965 | ||||||||||||||||||||||||||||||
| Cash Flow |
$ | 39 | $ | 42 | $ | 43 | $ | 46 | $ | 47 | $ | 47 | $ | 50 | $ | 51 | $ | 50 | $ | 8,605 | ||||||||||||||||||||
Note:
All Figures in USD Millions unless otherwise noted
Annual production is constant through 2062 at 9.9 Million, and at 2.5 Million per year thereafter
*Adjustments to Cash Flow includes change in Working Capital, Capital Expense, Income Tax, less Depreciation, Depletion & Amortization (DD&A)
19.2.2 MEASURES OF ECONOMIC VIABILITY
Based on the analysis of the cement plant operation and aggregates plant operations, both had positive annual income and earnings before interest, taxes, depreciation and amortization over the evaluation period, confirming the end users of the product from the mining operation are both viable, profitable businesses and will be able to use the mined product.
Net Present Value (NPV) is also used to evaluate the economic viability of the ongoing mining and processing of material to manufacture cement and aggregates. Based on the evaluation period and the assumed discount rate of 9.6 percent, the NPV of the operation (cement plant and quarry combined), after tax, is $1.46 billion.
19.3 SENSITIVITY ANALYSIS
Based on the analysis of the cement plant operation and the aggregate plant operation, both had positive annual net income and positive earnings before interest, taxes, depreciation, and amortization over the evaluation period, confirming that the end users of the product from the mining operation are both viable, profitable businesses and will be able to use the mined product.
Sensitivity analysis is presented below for changes in:
| | Capital Expenditures |
| | Sales Price (Cement / Aggregates) |
| | Mining Costs |
| | Aggregate Processing Costs |
| | Cement Processing Costs |
These are detailed in the Table 19-2.
80
Table 19-2. Sensitivity Analysis
| Sensitivity Parameter |
Variance to Expected Case (%) |
After-Tax NPV (US$ 000) |
||||
| Operating Costs |
-10% | 1,541,506 | ||||
| +10% | 1,146,346 | |||||
| Capital Costs |
-20% | 1,408,058 | ||||
| +20% | 1,279,794 | |||||
| Sales Price (Cem / Agg) ($/ton) |
+$5 /+$1 | 1,501,791 | ||||
| -$5 /-$1 | 1,186,061 | |||||
| Mining Cost ($/ton) |
-$1 | 1,439,209 | ||||
| +$1 | 1,248,643 | |||||
19.4 CONCLUSION
The analysis of the cement plant operation, demonstrated a positive annual net income over the evaluation period, confirming that the end user of the product from the mining operation is a viable, profitable businesses and will be able to use the mined product.
Sensitivity to increases in the mining cost indicates that these increases do not materially impact the profitability of the combined cement and aggregate financial performance.
The effect of a $1 increase in the mining cost was evaluated for the sensitivity of increases in the mining cost. With $1 increase in mining cost, the NPV (after tax) is reduced from $1.46 billion to $1.36 billion or 7.0%.
81
20 ADJACENT PROPERTIES
There are no adjacent properties from which relevant information material to the Resource and Reserves estimates was available or considered.
82
21 OTHER RELEVANT DATA AND INFORMATION
21.1 LAND OWNERSHIP IN SECTION 27
The site has 113 acres of potentially mineable land in Section 27 (the southern half of the Section in Miami-Dade County). Some of the parcels owned are not contiguous, as shown in Figure 21-1; therefore, it is establishing a productive, efficient mining face (pit) is not possible. These parcels will be permitted under Phase 3 of the Lake Belt permits. The QP has, after reasonable investigation, not identified any obstacle to obtaining the required permits.
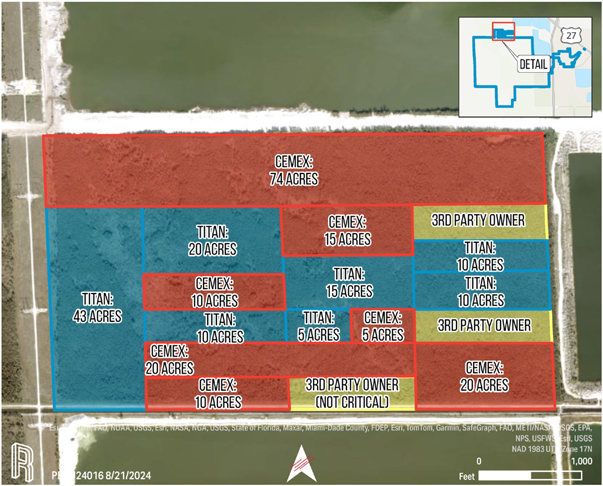
Figure 21-1. Section 27 with Titans Parcels shown in blue.
21.2 AGGREGATES TAILINGS RECOVERY FOR CLINKER MANUFACTURING
The aggregate plant slurry is pumped to Pit 3. In 2008, Titan performed a drilling campaign in Pit 3, to determine if the material could be used for clinker production. A barge mounted drill, as shown in Figure 21-2, was used to drill ten holes. Samples were obtained approximately every 5 feet. These samples underwent a comprehensive testing process, including evaluation of the particle distribution below 170 mesh, evaluation of all typical oxides for clinker manufacturing, as well as LOI. The conclusion was that the material is chemically suitable for manufacturing clinker.
83
The opportunity exists to use dredge technology to recover the material and to install a processing and drying facility. It is estimated that 16 million tons of material suitable for clinker manufacturing is in Pit 3, which provides 5 years of material for the cement plant.
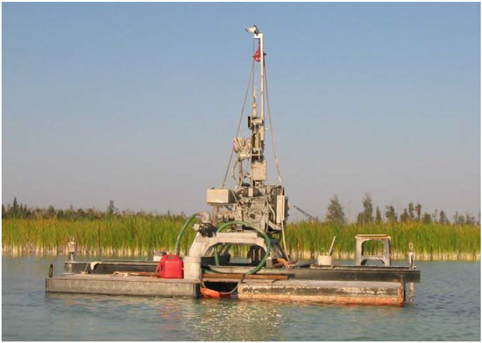
Figure 21-2. Drill and Barge Used for 2008 Fines Drilling Campaign.
21.3 CONSUMPTION OF QUARRY TAILINGS FOR RAW MILL PRODUCTION
An internal study was performed in 2023 to quantify the benefits of recovering ultra-fine material from construction aggregates production for use in finish mill grinding. After implementing the UFR hydrocyclone system, the recovered material was deemed also suitable for clinker manufacturing. The installed UFR system was designed to produce 150,000 t/a as feed to the finish mills.
Due to the limestone replacement benefits for clinker production, the opportunity exists to install a similar UFR system at a capacity of 250,000 t/afor clinker manufacturing.
The expanded recovery system will also require a feeder to introduce the ultra-fine limestone materials to the raw clinker feed. The feeder will be sized to handle an 8 percent limestone substitution rate.
From an economic perspective, every ton of recovered material that replaces raw limestone extends the Reserves or increases the production capacity for finished aggregates by an equivalent ton.
84
22 INTERPRETATION AND CONCLUSIONS
22.1 INTERPRETATIONS AND CONCLUSIONS
The following is a summary of the for the Resource and Reserve estimates for Pennsuco:
| | Geology is well known and understood and proven to supply suitable stone both for cement raw material and construction aggregates. |
| | Mining operations and practices have been well established over many decades. Addition of dredge mining to maximize the recovery of the Resource is a well-established and proven mining practice. |
| | The processing of raw materials and manufacture of cement has been in place for many decades and upgraded to be a low emissions cement facility. |
| | All necessary infrastructure is in place and has served the operation for many decades. |
| | All necessary permits are in place and future permitting is expected to enable extraction of all Reserves included in the estimate. |
| | Costs are well understood and predictable with the operations having been economic for decades and reasonably expected to be so for the life of mine projected. |
The QP opines that no issues are unresolved with the technical or economic factors considered in determining RPEE that supports the Resource estimate and that the risk of material impacts on the Reserve estimate is low.
22.2 RISKS AND UNCERTAINTIES
The QP opines that the exploration and Mineral Resource uncertainties offer minimal risk to the operation. The only risk is the Probable Reserve associated with Pits J, K, and L. A 1,500-foot setback is adjacent to Dade-Broward Levee along western boundary of Pits J, K, and L. The setback is divided into two individual setbacks1,000 feet (furthest west) and 500 feet adjacent to the east. This setback is currently required by USACE to minimize potential impacts to the Everglades wetlands. Any proposed mining activities within this setback would require approval from USACE and would potentially require environmental study and monitoring and/or controls to minimize potential impacts to adjacent wetlands. This would all take place as part of Phase 3 permitting and cost and risk would be shared with all mine operators in the Lake Belt. It is the QPs opinion after investigation that there are no obstacles to obtaining these permits.
85
23 RECOMMENDATIONS
The following actions are recommended for the site:
| | Advance Phase 3 permitting in conjunction with the other Lake Belt operations. Potential delays associated with receiving the necessary permits are associated with the uncertainties related to the USACE requiring additional environmental studies. Cost for permitting and the additional studies is estimated to be $500,000 |
| | Perform additional engineering studies that could provide significant impact to increase the LOM. Costs for the studies are considered minimal. |
| | Evaluate the fines recovery from Pit 3 for use in the cement process. |
| | Add a second ultra fines handling system to recover material from tailings for use in the cement process. |
| | Evaluate the use of bauxite for alumina control in place of fly ash to allow use of higher silica limestone in the cement process. |
86
24 REFERENCES
Cunningham, K., Wacker, M., Robinson, E., Dixon, J., & Wingard, G. (2006). A Cyclostratigraphic and Borehole-Geophysical Approach to Development of a Three-Dimensional Conceptual Hydrogeologic Model of the Karstic Biscayne Aquifer, Southeastern Florida. U.S. Geological Survey.
Datamyne. (2024). Datamyne. Retrieved from https://www.datamyne.com
DeSantis, R. (2024, January 12). Travelers to Florida Continue to Outpace the Nation. Retrieved from Ron Desantis- 46th governor of Florida: https://www.flgov.com/2024/01/12/travelers-to-florida-continue-to-outpace-the-nation/
Draper, G., Maurrasse, F., Gross, M., & Gutierrez-Alonso, G. (2006). Overview of South Florida Geology. Miami: Florida International University.
Florida Commerce. (2024, January 22). FloridaCommerce Press Releases. Retrieved from FloridaCommerce: https://www.floridajobs.org/news-center/DEO-Press/2024/01/22/floridacommerce-recognizes-florida-s-economic-achievements-in-celebration-of- florida-economic-development-week
Florida Office of Demographics and Economic Research. (2023, December 19). Florida Office of Demographics and Economic Research. Retrieved from http://edr.state.fl.us/Content/conferences/population/index.cfm
Hatfield, A. (2024). Mineral Commodities Summary- Cement. USGS.
MacVicar Consulting. (2017). Mining Plan. MacVicar Consulting.
M-DLPA. (2024). Understanding The Miami-Dade Lake Belt: How this 78-Acre Region Became the Backbone of Floridas Construction Aggregate Supply. Retrieved from M-DLPA: https://mdlpa.org/understanding-the-miami-dade-lake-belt/#:~:text=Floridas%20construction%20industry%20thrives%20on,demand%20on%20the%20east %20coast
Means, G. (2022, April). Limestone along the Suwanee river. Retrieved from Florida Geological Survey News and Research: https://content.govdelivery.com/accounts/FLDEP/bulletins/3149594
Meek, S. (2024, January 31). Breaking Down Migration In and Out of Florida. Retrieved from Florida Chamber of Commerce: https://www.flchamber.com/breaking-down-migration-in-and-out-of-florida/
Missimer, T. (1984). The Geology of South Florida: A summary. Cape Coral: Missimer and Associates, Inc.
Morse, P. (1997). Pennsuco Quarry Report on Geology and Reserves. Tarmac.
North American Cement Directory, N. (2023). Cement Products. Retrieved from Cement Products: https://cementproducts.com/
NWS. (2005). National Weather Service.
PCA, 2. (2024). PCA 2024 Spring Forecast. Retrieved from Current Forecasts: https://www.cement.org/economics/forecasts
Portland Cement Association. (2024, March). The Monitor. Retrieved from Portland Cement Association.
Scott, T. (2001). Text to accompany the geologic map of Florida, Open File report 80. Tallahassee: Florida Geological Survey.
U.S. Bureau of Labor Statistics. (2024, August). Producer Price Index by Industry: Cement and Concrete Product Manufacturing [PCU32733273], retrieved from FRED, Federal Reserve Bank of St. Louis. Retrieved from https://fred.stlouisfed.org/series/PCU32733273
US Census Bureau. (2023, July). Percent Change in Metropolitan Statistical Area Population: July 1, 2022- July 1, 2023.
US Census Bureau. (2024). Retrieved from https://data.census.gov/profile/Florida?g=040XX00US12
USACE. (2009). Final Supplemental Environmental Impact Statement on Rock Mining in the Lake Belt Region of Miami-Dade County, Florida. Palm Beach Gardens: U.S. Army Corps of Engineers, Jacksonville District.
87
USDOT. (2023, February 16). Bipartisan Infrastructure Law (BIL) / Infrastructure Investment and Jobs Act (IIJA). Retrieved from US Department of Transportation- Pipeline and Hazardous Materials Safety Administration: https://www.phmsa.dot.gov/legislative-mandates/bipartisan-infrastructure-law-bil-infrastructure-investment-and-jobs-act-iija#:~:text= The%20Infrastructure%20Investment%20and%20Jobs,%22new%22%20investments%20a nd%20programs.
88
25 RELIANCE ON INFORMATION PROVIDED BY THE REGISTRANT
In the development of this report, various information and data were provided by Titan. The information and data that were presented to Qualified Person were used to substantiate the content and findings of this report. It is the Qualified Persons opinion based on evaluation of other similar operations that the information is valid and represents similar expected information for the mining of limestone and the production of cement. The information that was provided by the registrant for the development of this report are listed below.
| | Macroeconomic trends and data Sections 18 & 19 |
| | Marketing Section 16 |
| | Environmental Section 17 |
| | Accommodations to local groups Section 17 |
89
26 DATE AND SIGNATURE PAGE
This report titled, Technical Report Summary on the Pennsuco Quarry, Miami-Dade, Florida with an effective date of May 24, 2024, was prepared and signed by:
Signed by Continental Placer Inc.
Continental Placer Inc.
Dated at Lutz, FL
August 30, 2024
90