Published on December 3, 2024
Exhibit 96.2
TECHNICAL REPORT SUMMARY FOR ROANOKE QUARRY, BOTETOURT COUNTY, VIRGINIA
REPORT CPI-18-6717F-A
| PREPARED BY | ||
| Continental Placer Inc. 17945 Hunting Bow Circle, Suite 101 |

|
|
| Lutz, Florida 33558 | ||
| PREPARED FOR | ||
| Titan America LLC 5700 Lake Wright Drive, Suite 300 Norfolk, Virginia 23502 |

|
|
SIGNATURE DATE: AUGUST 30, 2024
EFFECTIVE DATE: MAY 1, 2024
TABLE OF CONTENTS
| 1. | EXECUTIVE SUMMARY |
1 | ||||
| 1.1 | INTRODUCTION | 1 | ||||
| 1.2 | PROPERTY DESCRIPTION | 1 | ||||
| 1.3 | GEOLOGY AND MINERALIZATION | 1 | ||||
| 1.4 | STATUS OF EXPLORATION | 1 | ||||
| 1.5 | MINERAL RESOURCE AND RESERVE ESTIMATES | 1 | ||||
| 1.6 | DEVELOPMENT AND OPERATIONS | 5 | ||||
| 1.7 | CAPITAL AND OPERATING COST ESTIMATES | 6 | ||||
| 1.7.1 | Capital Costs |
6 | ||||
| 1.7.2 | Operating Costs |
6 | ||||
| 1.8 | PERMITTING REQUIREMENTS | 7 | ||||
| 1.9 | QUALIFIED PERSONS CONCLUSIONS AND RECOMMENDATIONS | 8 | ||||
| 2. | INTRODUCTION |
9 | ||||
| 2.1 | ISSUER OF REPORT | 9 | ||||
| 2.2 | TERMS OF REFERENCE AND PURPOSE | 9 | ||||
| 2.3 | SOURCES OF INFORMATION | 9 | ||||
| 2.4 | QUALIFIED PERSONS | 10 | ||||
| 2.5 | PERSONAL INSPECTION | 10 | ||||
| 2.6 | REPORT VERSION | 10 | ||||
| 3. | PROPERTY DESCRIPTION |
11 | ||||
| 3.1 | PROPERTY DESCRIPTION AND LOCATION | 11 | ||||
| 3.2 | MINERAL RIGHTS | 11 | ||||
| 3.3 | SIGNIFICANT ENCUMBRANCES OR RISKS TO PERFORM WORK ON PROPERTY | 11 | ||||
| 3.4 | LEASE AGREEMENTS OR ROYALTIES | 11 | ||||
| 4. | ACCESSIBILITY, CLIMATE, LOCAL RESOURCES, INFRASTRUCTURE AND PHYSIOGRAPHY |
13 | ||||
| 4.1 | TOPOGRAPHY AND VEGETATION | 13 | ||||
| 4.2 | ACCESSIBILITY AND LOCAL RESOURCES | 13 | ||||
| 4.3 | CLIMATE | 13 | ||||
| 4.4 | INFRASTRUCTURE | 14 | ||||
| 4.4.1 | Water |
16 | ||||
| 4.4.2 | Energy Supply |
16 | ||||
| 4.4.3 | Personnel |
16 | ||||
| 4.4.4 | Supplies |
16 | ||||
| 5. | HISTORY |
17 | ||||
| 5.1 | PRIOR OWNERSHIP | 17 | ||||
| 5.2 | EXPLORATION AND DEVELOPMENT HISTORY | 17 | ||||
| 6. | GEOLOGICAL SETTING, MINERALIZATION AND DEPOSIT | 18 | ||||
| 6.1 | REGIONAL GEOLOGY | 18 | ||||
i
| 6.2 | LOCAL GEOLOGY |
18 | ||||
| 6.3 | PROPERTY GEOLOGY |
18 | ||||
| 6.3.1 | Lone Star East Quarry |
18 | ||||
| 6.3.2 | High Grade Shale Quarry |
18 | ||||
| 6.3.3 | Catawba Farm Quarry |
18 | ||||
| 6.4 | STRATIGRAPHY AND MINERALOGY |
20 | ||||
| 6.4.1 | The Bays Formation |
21 | ||||
| 6.4.2 | The Edinburg Formation (Liberty Hall) |
21 | ||||
| 6.4.3 | Middle Ordovician Limestones |
21 | ||||
| 6.4.4 | The Beekmantown Formation |
22 | ||||
| 6.4.5 | Stratigraphy Lone Star East Quarry & Catawba Farm Quarry |
22 | ||||
| 6.4.6 | Stratigraphy High Grade Shale Quarry |
22 | ||||
| 6.5 | MINERALIZATION |
22 | ||||
| 7. | EXPLORATION | 23 | ||||
| 7.1 | DRILLING PROGRAMS |
23 | ||||
| 7.2 | HYDROGEOLOGY INFORMATION |
26 | ||||
| 7.3 | GEOTECHNICAL INFORMATION |
26 | ||||
| 7.4 | EXPLORATION OTHER THAN DRILLING |
26 | ||||
| 8. | SAMPLE PREPARATION, ANALYSES AND SECURITY | 27 | ||||
| 8.1 | SAMPLE PREPARATION AND ANALYSIS |
27 | ||||
| 8.1.1 | 2005-2007 Drilling Programs |
27 | ||||
| 8.1.2 | 2013-2022 Drilling Programs |
27 | ||||
| 8.1.3 | 2023-2024 Drilling Programs |
27 | ||||
| 8.2 | SAMPLE SECURITY |
28 | ||||
| 8.3 | QUALITY ASSURANCE/QUALITY CONTROL |
28 | ||||
| 8.4 | OPINION OF THE QUALIFIED PERSON ON ADEQUACY OF SAMPLE PREPARATION |
28 | ||||
| 9. | DATA VERIFICATION | 29 | ||||
| 9.1 | SOURCE MATERIAL |
29 | ||||
| 9.2 | OPINION OF THE QUALIFIED PERSON ON DATA ADEQUACY |
29 | ||||
| 10. | MINERAL PROCESSING AND MINERALOGICAL TESTING | 30 | ||||
| 11. | MINERAL RESOURCE ESTIMATES | 31 | ||||
| 11.1 | DEFINITIONS |
31 | ||||
| 11.2 | KEY ASSUMPTIONS, PARAMETERS AND METHODS |
31 | ||||
| 11.2.1 | Density Determinations |
33 | ||||
| 11.2.2 | Resource Classification Criteria |
33 | ||||
| 11.2.2.1 | Limestone Resource Areas |
33 | ||||
| 11.2.2.2 | Non-Limestone Resource Areas |
33 | ||||
| 11.2.3 | Market Price |
33 | ||||
| 11.2.4 | Cut-Off Grade |
33 | ||||
| 11.2.5 | Summary of Parameters |
34 | ||||
ii
| 11.3 |
RESOURCE MODEL |
34 | ||||
| 11.4 | MINERAL RESOURCES |
35 | ||||
| 11.4.1 |
Estimate of Mineral Resources |
35 | ||||
| 11.4.2 |
Geologic Confidence and Uncertainty |
37 | ||||
| 11.5 |
OPINION OF THE QUALIFIED PERSON |
37 | ||||
| 12. |
MINERAL RESERVE ESTIMATES |
38 | ||||
| 12.1 |
DEFINITIONS |
38 | ||||
| 12.2 |
KEY ASSUMPTIONS, PARAMETERS AND METHODS |
38 | ||||
| 12.2.1 |
Reserve Classification Criteria |
38 | ||||
| 12.2.2 |
Cut-Off Grade |
38 | ||||
| 12.2.3 |
Market Price |
39 | ||||
| 12.3 |
MINERAL RESERVES |
39 | ||||
| 12.4 |
OPINION OF THE QUALIFIED PERSON |
41 | ||||
| 13. |
MINING METHODS |
42 | ||||
| 13.1 |
GEOTECHNICAL AND HYDROLOGIC CONSIDERATIONS |
42 | ||||
| 13.2 |
MINE OPERATING PARAMETERS |
42 | ||||
| 13.3 |
MINING OPERATIONS |
45 | ||||
| 13.4 |
MINE PLANT, EQUIPMENT AND PERSONNEL |
46 | ||||
| 14. |
PROCESSING AND RECOVERY METHODS |
47 | ||||
| 14.1 |
PROCESS PLANT DESCRIPTION |
47 | ||||
| 14.2 |
PLANT THROUGHPUT AND DESIGN |
49 | ||||
| 14.3 |
PLANT OPERATIONAL REQUIREMENTS |
49 | ||||
| 14.3.1 |
Energy |
49 | ||||
| 14.3.2 |
Water |
49 | ||||
| 14.3.3 |
Process Materials |
49 | ||||
| 14.3.4 |
Personnel |
49 | ||||
| 14.4 |
APPLICATION OF NOVEL OR UNPROVEN TECHNOLOGY |
49 | ||||
| 15. |
INFRASTRUCTURE |
50 | ||||
| 15.1 |
ACCESS ROAD AND RAIL | 52 | ||||
| 15.2 |
WAREHOUSES AND MAINTENANCE FACILITIES | 52 | ||||
| 15.3 |
NATURAL GAS | 52 | ||||
| 15.4 |
ELECTRIC POWER | 52 | ||||
| 15.5 |
FUEL STORAGE | 52 | ||||
| 15.6 |
EXPLOSIVES STORAGE | 52 | ||||
| 15.7 |
WATER SUPPLY | 52 | ||||
| 15.8 |
ALTERNATIVE FUELS | 53 | ||||
| 15.9 |
MINE AND PLANT WASTE | 53 | ||||
| 16. |
MARKET STUDIES |
54 | ||||
| 16.1 |
MARKETS |
54 | ||||
| 16.1.1 |
Introduction |
54 | ||||
iii
| 16.1.2 |
Market Review Conclusions |
54 | ||||
| 16.1.3 |
Competitor Analysis (Competitive Landscape) |
54 | ||||
| 16.2 |
KEY DRIVERS AND TRENDS AFFECTING THE MARKET |
54 | ||||
| 16.3 |
GEOGRAPHIC MARKETS |
55 | ||||
| 16.3.1 | Virginia |
55 | ||||
| 16.3.2 | North Carolina |
57 | ||||
| 16.4 |
SALES AND DISTRIBUTION CHANNELS | 57 | ||||
| 16.5 |
COMMODITY PRICES | 59 | ||||
| 16.6 |
PRODUCTS | 59 | ||||
| 16.6.1 | Cement |
59 | ||||
| 16.6.2 | Bulk |
59 | ||||
| 16.6.3 | Package |
59 | ||||
| 16.7 |
MATERIAL CONTRACTS | 59 | ||||
| 17. | ENVIRONMENTAL STUDIES, PERMITTING AND PLANS, NEGOTIATIONS, OR AGREEMENTS WITH LOCAL INDIVIDUALS OR GROUPS |
60 | ||||
| 17.1 |
ENVIRONMENTAL STUDIES AND PERMITTING REQUIREMENTS | 60 | ||||
| 17.1.1 | Environmental Studies |
60 | ||||
| 17.1.2 | Endangered and Threatened Species Study |
61 | ||||
| 17.1.3 | Permitting Requirements. |
61 | ||||
| 17.2 |
WASTE DISPOSAL, SITE MONITORING AND WATER MANAGEMENT | 63 | ||||
| 17.2.1 | Mine Waste |
63 | ||||
| 17.2.2 | Plant Waste |
63 | ||||
| 17.2.3 | Water Management |
64 | ||||
| 17.2.3.1 | Stormwater |
64 | ||||
| 17.2.3.2 | Process Water |
64 | ||||
| 17.2.3.3 | Groundwater |
64 | ||||
| 17.3 |
POST-MINING LAND USE AND RECLAMATION | 65 | ||||
| 17.4 |
LOCAL OR COMMUNITY ENGAGEMENT AND AGREEMENTS | 65 | ||||
| 17.5 |
OPINION OF THE QUALIFIED PERSON | 66 | ||||
| 18. | CAPITAL AND OPERATING COSTS |
67 | ||||
| 18.1 |
SUMMARY AND ASSUMPTIONS | 67 | ||||
| 18.2 |
MINING CAPITAL SUMMARY | 67 | ||||
| 18.2.1 | Stripping |
67 | ||||
| 18.2.2 | Catawba Farm Development |
67 | ||||
| 18.2.3 | Sustaining Capital |
68 | ||||
| 18.2.4 | Summary |
68 | ||||
| 18.3 |
CEMENT PROCESSING CAPITAL COSTS | 69 | ||||
| 18.4 |
OPERATING COST ESTIMATE | 69 | ||||
| 18.4.1 | Introduction and Estimate Results |
69 | ||||
| 18.4.2 | Production |
69 | ||||
| 18.4.3 | Costs |
70 | ||||
| 18.4.4 |
Mining Operating Cost Summary |
71 | ||||
iv
| 19. | ECONOMIC ANALYSIS |
72 | ||||
| 19.1 |
KEY PARAMETERS AND ASSUMPTIONS | 72 | ||||
| 19.1.1 | Discount Rates |
72 | ||||
| 19.1.2 | Commodity Prices |
72 | ||||
| 19.1.3 | Inflation |
72 | ||||
| 19.1.4 | Labor |
72 | ||||
| 19.1.5 | Production Parameters |
72 | ||||
| 19.1.6 |
Capital Expenditures |
73 | ||||
| 19.1.7 |
Taxes |
73 | ||||
| 19.2 |
RESULTS OF ECONOMIC ANALYSIS |
73 | ||||
| 19.2.1 |
Economic Analysis |
73 | ||||
| 19.2.2 |
Measures of Economic Viability |
74 | ||||
| 19.3 |
SENSITIVITY ANALYSIS |
74 | ||||
| 19.4 |
CONCLUSION |
75 | ||||
| 20. |
ADJACENT PROPERTIES |
76 | ||||
| 21. |
OTHER RELEVANT DATA AND INFORMATION |
77 | ||||
| 21.1 |
CATAWBA ROAD RELOCATION |
77 | ||||
| 21.2 |
AGGREGATES PRODUCTION |
77 | ||||
| 21.3 |
LONE STAR WEST RECOVERY |
77 | ||||
| 21.4 |
UNDERGROUND EXPANSION |
77 | ||||
| 22. |
INTERPRETATION AND CONCLUSIONS |
78 | ||||
| 22.1 |
INTERPRETATIONS AND CONCLUSIONS |
78 | ||||
| 22.2 |
RISKS AND UNCERTAINTIES |
78 | ||||
| 23. |
RECOMMENDATIONS |
79 | ||||
| 24. |
REFERENCES |
80 | ||||
| 25. |
RELIANCE ON INFORMATION PROVIDED BY THE REGISTRANT |
81 | ||||
| 26. |
DATE AND SIGNATURE PAGE |
82 | ||||
v
LIST OF TABLES
| Table 1-1. Summary of Mineral Resources (exclusive of Mineral Reserves) as of May 1, 2024 |
2 | |||
| Table 1-2. Summary of Mineral Reserves as of May 1, 2024 |
4 | |||
| Table 1-3. Permit Status |
7 | |||
| Table 5-1. Ownership History |
17 | |||
| Table 5-2. Summary of Historical Exploration Programs up to 1986 |
17 | |||
| Table 7-1. Drillholes by Year |
24 | |||
| Table 11-1. Summary of Geologic Confidence Classification Criteria (Limestone) |
33 | |||
| Table 11-2. Parameter Assumptions |
34 | |||
| Table 11-3. Roanoke Cement Company Summary of Mineral Resources (exclusive of Mineral Reserves) as of May 1, 2024 |
36 | |||
| Table 12-1. Roanoke Cement Company Summary of Mineral Reserves as of May 1, 2024 |
40 | |||
| Table 13-1. High Grade Shale Quarry Design Parameters |
42 | |||
| Table 13-2. Catawba Farm Quarry Design Parameters |
42 | |||
| Table 17-1. Permit Regime |
62 | |||
| Table 18-1. Catawba Farm Development |
68 | |||
| Table 18-2. Summary of Historic and Estimated Mining Operating Costs |
70 | |||
| Table 19-1. Economic Analysis Model |
74 | |||
| Table 19-2.19-3. Sensitivity Analysis |
75 | |||
vi
LIST OF FIGURES
| Figure 3-1. General Location Map |
12 | |||
| Figure 4-1. Roanoke, Virginia, Temperature and Precipitation Data Recorded from 1981-2010 (US Climate Data, 2024) |
14 | |||
| Figure 4-2. Regional Infrastructure |
15 | |||
| Figure 6-1. Local Geology Setting |
19 | |||
| Figure 6-2. Typical Stratigraphic Column |
20 | |||
| Figure 6-3. Cross Section of the Catawba Quadrangle [after (Prince & Henika, 2018)] |
21 | |||
| Figure 7-1. Drillhole Locations |
25 | |||
| Figure 11-1. Roanoke Cement Company - Resource Areas |
32 | |||
| Figure 13-1. Final Quarry Limit. |
44 | |||
| Figure 13-2. Annual Mine Production Schedule |
45 | |||
| Figure 14-1. Cement Plant Process |
47 | |||
| Figure 14-2. Flowsheet of the Roanoke Cement Plant |
48 | |||
| Figure 14-3. Pit to Product Mass Balance |
49 | |||
| Figure 15-1. Site Infrastructure Features |
50 | |||
| Figure 15-2. Plant Area Infrastructure |
51 | |||
| Figure 16-1. Virginia/North Carolina MSA Population Growth |
56 | |||
| Figure 16-2. Titan Distribution Network |
58 | |||
| Figure 16-3. PPI for Cement and Concrete Product Manufacturing (U.S. Bureau of Labor Statistics, 2024) |
59 | |||
| Figure 17-1. Mine Waste Location |
63 | |||
| Figure 17-2. CKD Landfill Locations |
64 | |||
| Figure 17-3. Reclamation Plan Highlighting Earthwork |
65 | |||
| Figure 18-1. Annual Capital Expenditures |
69 | |||
vii
GLOSSARY OF TERMS AND ABBREVIATIONS
| Symbol / Abbreviation |
Description |
|
| AEP | American Electric Power | |
| AF | Alternative Fuel | |
| Al2O3 | aluminum oxide | |
| ALT | Andy Layne Trail | |
| APC | Appalachian Power Company | |
| ASL | above sea level | |
| ATF | Bureau of Alcohol, Tobacco, Firearms, and Explosives | |
| ATS | Appalachian Technical Services Inc. | |
| BM | Bowser-Morner | |
| BTU | British thermal unit | |
| CaO | calcium oxide | |
| Capex | capital expenses | |
| CKD | cement kiln dust | |
| CPI | Continental Placer Inc. | |
| CTL | Chicago Testing Laboratories | |
| DEQ | Department of Environmental Quality | |
| DMME | Department of Mines, Minerals and Energy | |
| EBITDA | Earnings before interest, taxes, depreciation, and amortization | |
| EIA | Energy Information Administration | |
| FOB | Free on Board | |
| FRED | Federal Reserve Economic Data | |
| IIJA | Infrastructure Investment and Jobs Act | |
| IL | Type one limestone cement | |
| JPA | Joint Permit Application | |
| JRIA | James River Institute for Archaeology, Inc. | |
| kV | kilovolt | |
| kt/a | thousand tons per annum | |
| k tons | one thousand tons | |
| KBJW | Koontz Byrant Johnson Williams, Inc. | |
| LOI | Loss on ignition | |
| LOM | life of mine | |
| LSC | Lone Star Cement Corporation | |
| MMBTU | million BTU | |
| MSA | Metropolitan Statistical Area | |
viii
| Norfolk Southern | Norfolk Southern Railway | |
| NPV | Net Present Value | |
| Opex | operating expenses | |
| PCA | Portland Cement Association | |
| PJD | Preliminary Jurisdictional Determination | |
| PLC | Portland limestone cement | |
| PD | pressure differential | |
| QP | Qualified Person | |
| RCC | Roanoke Cement Company | |
| RGC | Roanoke Gas Company | |
| ROI | radius of influence | |
| ROW | right of way | |
| RPEE | Reasonable Prospect For Economic Extraction | |
| SG | specific gravity | |
| SiO2 | silica oxide | |
| S&P | Standard and Poors | |
| TDF | Tire-Derived Fuel | |
| Tonne | metric ton | |
| t/h | tons per hour | |
| Titan | Titan America LLC | |
| TRS | Technical Report Summary | |
| USACE | United States Army Corps of Engineers | |
| USFWS | United States Fish and Wildlife Service | |
| USGS | United States Geological Survey | |
| VDEQ | Virginia Department of Environmental Quality | |
| VDWR | Virginia Department of Wildlife Resources | |
| VMRC | Virginia Marine Resources Commission | |
| VWP | Individual Water Protection Permit | |
| XRF | X-ray fluorescence | |
ix
| 1. | EXECUTIVE SUMMARY |
| 1.1 | INTRODUCTION |
Titan America LLC (Titan) is a leading U.S. manufacturer of construction materials used in residential, commercial, industrial, infrastructure, and energy applications. Titan has retained Continental Placer Inc. (CPI) to prepare this Technical Report Summary (TRS) for the Roanoke Cement Company LLC (RCC) site located in the Commonwealth of Virginia, USA.
The purpose of this TRS is to support the disclosure of Mineral Resource and Mineral Reserve estimates for the site as of May 1, 2024. This TRS is intended to fulfill 17 Code of Federal Regulations (CFR) §229, Standard Instructions for Filing Forms Under Securities Act of 1933, Securities Exchange Act of 1934 and Energy Policy and Conservation Act of 1975 Regulation S-K, subsection 1300, Disclosure by Registrants Engaged in Mining Operations. The Mineral Resource and Mineral Reserve estimates presented herein are classified according to 17 CFR §229.1300 (Item 1300) Definitions.
The Mineral Reserves are mined to support the on-site cement plant.
Lapis Consulting (Lapis) supported the Resource and Reserve modelling, assessment of the assay results and mine planning under the supervision of the QP, CPI for the TRS.
This TRS was prepared by CPI. No prior TRS has been filed with respect to the site.
| 1.2 | PROPERTY DESCRIPTION |
The site (37°2743 N, 79°5942 W) is in Botetourt County, Virginia, and consists of approximately 2,567 acres controlled by Titan. The nearest major city is Roanoke, Virginia, 13.5 miles south from the site.
| 1.3 | GEOLOGY AND MINERALIZATION |
The operations are situated within the apex, or hinge zone, of the Catawba Syncline among outcrops of limestone, dolomite, shale, and sandstone. The complex geology is well understood based upon mining history, exploration, and numerous state geologic reports and mapping. The main ore body targeted is Lincolnshire-New Market-Effna grouping of Ordovician aged limestones. The Bays Sandstone, Edinburg Shale, and Beekmantown Dolomite provide additional raw materials for the manufacture of cement.
| 1.4 | STATUS OF EXPLORATION |
The limestone and carbonaceous shale deposits at the site are well-defined by exploration drilling. Various drilling campaigns and geological investigations have been completed throughout the sites history; little is recorded for exploration activities before 1979. Two reports from 1979 and 1986 describe historical exploration campaigns and the resulting Resources and Reserves. Numerous exploration campaigns have been conducted since 1992 when Titan acquired a majority interest in the site. These campaigns include more than 200 drillholes and two electrical resistivity surveys. Chemistry is available for campaigns in 2005 through 2024. Core logs are available for campaigns in 2007 through 2024. Core photographs are available for campaigns in 2013 through 2024.
| 1.5 | MINERAL RESOURCE AND RESERVE ESTIMATES |
The effective date of the Mineral Resource and Reserves estimates is May 1, 2024.
1
Resource estimates are shown in Table 1-1 and are exclusive of tons to be converted to Reserves.
Table 1-1. Summary of Mineral Resources (exclusive of Mineral Reserves) as of May 1, 2024
| Resource Category |
k tons | SiO2 (%) | Al2O3 (%) | CaO (%) | ||||||||||||
| Catawba Farm Quarry Dolostone |
||||||||||||||||
| Inferred |
48 | 18.3 | 1.2 | 30.8 | ||||||||||||
| Catawba Farm Extension Limestone |
||||||||||||||||
| Measured |
30,000 | 10.8 | 2.3 | 46.5 | ||||||||||||
| Measured + Indicated |
30,000 | | | | ||||||||||||
| Catawba Farm Extension Dolostone |
||||||||||||||||
| Measured |
4,600 | 12.9 | 1.4 | 31.2 | ||||||||||||
| Indicated |
190 | 12.9 | 1.4 | 31.2 | ||||||||||||
| Measured + Indicated |
4,790 | 12.9 | 1.4 | 31.2 | ||||||||||||
| Inferred |
48 | 12.9 | 1.4 | 31.2 | ||||||||||||
| Lone Star East Quarry Dolostone |
||||||||||||||||
| Measured |
1,500 | 13.3 | 1.7 | 32.0 | ||||||||||||
| Measured + Indicated |
1,500 | 1.7 | 32.0 | 1.1 | ||||||||||||
| Lone Star East Extension Limestone |
||||||||||||||||
| Measured |
54,000 | 7.9 | 1.5 | 48.3 | ||||||||||||
| Measured + Indicated |
54,000 | 7.9 | 1.5 | 48.3 | ||||||||||||
| Lone Star East Extension Dolostone |
||||||||||||||||
| Measured |
22,000 | 10.4 | 1.7 | 33.5 | ||||||||||||
| Measured + Indicated |
22,000 | 10.4 | 1.7 | 33.5 | ||||||||||||
| Roanoke Site Totals - Limestone |
||||||||||||||||
| Measured |
84,000 | 8.9 | 1.8 | 47.7 | ||||||||||||
| Indicated |
0 | 0.0 | 0.0 | 0.0 | ||||||||||||
| Measured + Indicated |
84,000 | 8.9 | 1.8 | 47.7 | ||||||||||||
| Inferred |
0 | | | | ||||||||||||
| Roanoke Site Totals - Dolostone |
||||||||||||||||
| Measured |
28,100 | 11.0 | 1.6 | 33.0 | ||||||||||||
| Indicated |
190 | 12.9 | 1.4 | 31.2 | ||||||||||||
| Measured + Indicated |
28,290 | 11.0 | 1.6 | 33.0 | ||||||||||||
| Inferred |
96 | 15.6 | 1.3 | 31.0 | ||||||||||||
Notes:
| (1) | Mineral Resources are not Mineral Reserves and do not have demonstrated economic viability. |
| (2) | Mineral Resources are exclusive of Mineral Reserves. |
| (3) | Mineral Resources point of reference is the raw material stack at the plant area. |
| (4) | Mineral Resources Reasonable Prospect for Economic Extraction (RPEE) commodity price is based on a 2025 cement price of $136 per ton, Free on Board (FOB) the plant. |
| (5) | Tons are rounded to the nearest thousand. |
| (6) | Sums may not be exact because of rounding. |
| (7) | There is no certainty that all or any part of the Mineral Resources estimated will be converted into Mineral Reserves. |
2
The Qualified Person (QP) opines that the carbonate deposits at the site are modeled adequately considering the quality and geologic characteristics of the ore body. Such interpretations were made based on the drilling campaigns, other exploration activities, and mining history at the site. The QP also opines that the Resource estimates have been developed following customary and industry standard practices in the construction materials mining industry. No proprietary methods, standards, or software were used in the Resource estimate.
Table 1-2 shows the Reserve estimate for all Resource areas at the site. Values are stated in short tons.
3
Table 1-2. Summary of Mineral Reserves as of May 1, 2024
| Quarry/Reserve Category |
Tons (k ton) |
SiO2 (%) |
Al2O3 (%) |
CaO (%) |
||||||||||||
| Catawba Farm Quarry Limestone |
||||||||||||||||
| Proven |
23,000 | 8.91 | 1.92 | 48 | ||||||||||||
| Probable |
0 | | | | ||||||||||||
| Total: |
23,000 | 8.91 | 1.92 | 48 | ||||||||||||
| Catawba Farm Quarry Dolostone |
||||||||||||||||
| Proven |
1,600 | 18.3 | 1.16 | 30.8 | ||||||||||||
| Probable |
68 | 18.3 | 1.16 | 30.8 | ||||||||||||
| Total: |
1,700 | 18.3 | 1.16 | 30.8 | ||||||||||||
| Lone Star East Quarry Limestone |
||||||||||||||||
| Proven |
13,000 | 5.7 | 1.3 | 49.4 | ||||||||||||
| Probable |
4,100 | 7.6 | 1.2 | 47.9 | ||||||||||||
| Total: |
17,100 | 6.16 | 1.28 | 49 | ||||||||||||
| Lone Star East Quarry Dolostone |
||||||||||||||||
| Proven |
1,600 | 13.3 | 1.7 | 32 | ||||||||||||
| Probable |
0 | | | | ||||||||||||
| Total: |
1,600 | 13.3 | 1.7 | 32 | ||||||||||||
| High Grade Shale Quarry |
||||||||||||||||
| Proven |
12,000 | 19.7 | 4.4 | 38.7 | ||||||||||||
| Probable |
0 | | | | ||||||||||||
| Total: |
12,000 | 19.7 | 4.4 | 38.7 | ||||||||||||
| Roanoke Site Totals - Limestone |
||||||||||||||||
| Proven |
36,000 | 7.8 | 1.7 | 48.5 | ||||||||||||
| Probable |
4,100 | 7.6 | 1.2 | 47.9 | ||||||||||||
| Proven + Probable |
40,100 | 7.7 | 1.6 | 48.4 | ||||||||||||
| Roanoke Site Totals - Dolostone |
||||||||||||||||
| Proven |
3,200 | 15.8 | 1.4 | 31.4 | ||||||||||||
| Probable |
68 | 18.3 | 1.16 | 30.8 | ||||||||||||
| Proven + Probable |
3,268 | 15.9 | 1.4 | 31.4 | ||||||||||||
| Roanoke Site Totals - Shale |
||||||||||||||||
| Proven |
12,000 | 19.7 | 4.4 | 38.7 | ||||||||||||
| Probable |
0 | | | | ||||||||||||
| Proven + Probable |
12,000 | 19.7 | 4.4 | 38.7 | ||||||||||||
Notes:
| (1) | Mineral Resources RPEE commodity price is based on a 2025 cement price of $136 per ton, FOB the plant. |
| (2) | Limestone Mineral Reserves are stated on a Life of Mine basis. |
| (3) | Shale and dolostone Mineral Reserves represent the tons that will be consumed during the Life of Mine production schedule. |
| (4) | No cut-off grades are applied. |
| (5) | The point of reference for the Reserves is the raw material stack, located after the primary crusher and includes mining recovery of 95%. |
| (6) | Tons are rounded to nearest 1,000s, which could cause apparent summation errors. |
| (7) | Catawba Farm Extension dolostone Resource quantity based on production requirements. |
| (8) | Dolostone blocks of Indicated and Inferred Resources are interspersed within the deposit. It is not reasonable to report separate chemistry statistics for these categories. |
4
Given the extent of geologic information, mine planning activities, and operating history at the site, the QP is confident that Reserves can be extracted and processed at the quantity and quality required to meet the sites production schedule to produce Portland cement.
There is no cut-off grade for the limestone feed for the cement plant and all limestone reserves can be utilized in the cement process demonstrated through operations for the past 73 years. The lithology of the feed material determines its use in the cement process.
As part of the study, an economic analysis that included capital costs (Capex) estimates for development, infrastructure relocations, fleet acquisitions, permitting needs, and plant upgrades was performed. Operating costs (Opex) were obtained from the cost tracking performed by Titan over its thirty plus year history of operating the site.
The QP opines that the Reserve estimate has been developed following customary standards in the construction materials mining industry. The QP is of the opinion that all relevant technical and economic factors are not likely to be significantly influenced by further work and that any technical and economic issues are not material to the site.
| 1.6 | DEVELOPMENT AND OPERATIONS |
The Lone Star East Quarry and High Grade Shale Quarry are fully developed multi-bench quarries. Future development in these quarries will continue with little change to development strategy. The Catawba Farm Quarry has not yet been developed. Development of this site will begin with a starter pit and progress in such a way that multiple benches will be accessible as quickly as possible.
Development of the Catawba Farm Quarry will require construction of a haul road and bridge capable of supporting 100-ton rigid-frame haul trucks constructed over Catawba Creek to connect the quarry to the cement plant.
The development of the Catawba Farm Quarry will begin in 2025. This development will proceed in three phases: initial, limited, and total production. The initial phase will involve site preparation and removal of overburden and shale from a starter pit to expose the limestone. The limited production phase will include developing the first two production benches to allow production activities to commence and open enough area and production faces to accommodate full-scale production. Any production rock will be stockpiled during this phase before the haul bridge is constructed, which is currently scheduled for completion in 2026.
Existing operations are performed with conventional loaders and haul trucks. Overburden removal is performed by contractors typically using excavators, bulldozers, and articulated trucks. Drilling and blasting of the limestone, shale, and dolostone is also performed by an independent contractor. A 16-cubic-yard front-end wheeled loader (face loader) is used to muck the fragmented rock and load it into 100-ton class rigid-frame offroad trucks for hauling to the primary station where it is stockpiled for blending. The mine design is a typical multi-bench quarry. Having multiple benches available is key to managing the raw material blend for the cement plant.
The projected production from the quarry as delivered to the primary crusher or the cement mills is projected to be:
| | Raw Mill |
| Limestone |
1,325 ktons/annum (kt/a) |
5
| Shale |
350 kt/a | |||||
| Sandstone |
50 kt/a | |||||
| Dolostone |
50 kt/a | |||||
| Other |
25 kt/a | |||||
| | Cement Mill |
| Limestone |
100 kt/a | |||||
| Dolostone |
100 kt/a | |||||
Based on the Reserves and the production profile, the mine life is 27.6 years from May 1, 2024.
| 1.7 | CAPITAL AND OPERATING COST ESTIMATES |
Capital and operating costs are primarily estimated using a combination of equipment quotes from recent projects and vendor quotes for mobile equipment, and recent experience with similar projects. These estimates include annual inflation based on the Consumer Price Index projections.
| 1.7.1 | CAPITAL COSTS |
The following categories are costs identified for the site:
| | Stripping. The total projected stripping costs for both the new Catawba Farm Quarry and the existing Lone Star East Quarry, after adjusting for the Consumer Price Index inflation projection, is $101.0 million. |
| | Catawba Farm Development. The Catawba Farm site has been in capital development since 2021, with the completion of a scoping study, a prefeasibility study, and the ongoing permit and engineering phases. During each of these phases, the scope of the project has been refined and major portions of the work have gone through the procurement process. After adjusting for the Consumer Price Index inflation projection and including existing accrued, the total cost is $17.7 million. |
| | Sustaining. Sustaining capital encompasses all projected investments required to maintain current operations and the specified growth investments of the mining operation over the projected 27-year life of mine (LOM) period. These projections are derived from historical investment data, as well as current and past quotes for refurbishing or acquiring equipment. After adjusting for the Consumer Price Index inflation projection and including existing accrued, the total cost is $132.0 million. |
| 1.7.2 | OPERATING COSTS |
The operating cost estimate for the mining operation was prepared using historical trends and detailed cost models, which were used during the 2024 annual budgetary planning process. The costs are for all activity up to delivery to the surge pile. The 2024 fixed and variable cost for the sites mining activity is estimated at $5.96 per ton delivered to the primary crusher. The total mining cost also includes the following:
| | Depreciation for the Catawba Farm Development |
| | Sustaining mining costs, depletion of the Reserve at $0.25 per ton |
| | Amortization of the capitalized stripping cost |
The projected total mining cost is $8.27 per ton in 2025 and increases over the evaluation period to reflect changes in the depreciation and Consumer Price Index adjustment.
6
| 1.8 | PERMITTING REQUIREMENTS |
Many studies were completed as part of permitting efforts for the existing site, including the Lone Star East Quarry. The following environmental and technical studies for permitting efforts for the proposed Catawba Farm Quarry project were completed between 2023 and 2024:
| | Archaeological study (Cultural Resources) |
| | Hydrology and drainage studies |
| | Hydrogeological study |
| | Wetlands studies |
| | Endangered and Threatened Species study |
All permits necessary to conduct quarry operations on the current site are in place and in good standing. The development of the new Catawba Farm Quarry requires various permit modifications or the issuance of new permits. Key permits that apply to the Catawba Farm Quarry and their status are listed in Table 1-3. Permitting is in progress and anticipating that all permits can be acquired is reasonable. The development of the Catawba Farm Quarry is scheduled for 2025, which should allow sufficient time to complete the permitting process.
Table 1-3. Permit Status
| Agency |
Reviewed and Issued By |
Permit Name |
Proposed Catawba Farm Quarry |
|||
| Local (Botetourt County) |
||||||
| Building Development Services | Site Plan Review | Submitted June 2024 | ||||
| Building Permit Review | Anticipated to follow Site plan review | |||||
| State (Commonwealth of Virginia) |
||||||
| Department of Environmental Quality (DEQ) | General Permit for Nonmetallic Mineral Mining (VAG84) | Submitted May 2024 | ||||
| Individual Water Protection Permit (VWP Permit) | Submitted May 2024 | |||||
| Virginia Marine Resources Commission (VMRC) | Subaqueous Permit | Submitted May 2024 #23-1360 | ||||
| Department of Mines, Minerals and Energy (DMME) | Mining Permit | Current mine permit modification required; Submitted June 2024 | ||||
| Department of Transportation | Land Use Permit | Submitted June 2024 | ||||
| Federal (United States) |
||||||
| United States Army Corps of Engineers (USACE) | Individual 404 Dredge and Fill Permit | Submitted May 2024 | ||||
| United States Fish and Wildlife Service (USFWS) | Consultation regarding Endangered Species | Concurrent with USACE Permit process | ||||
7
| 1.9 | QUALIFIED PERSONS CONCLUSIONS AND RECOMMENDATIONS |
The following is a summary of the Resource and Reserve estimates for the site:
| | Geology is well known and understood and proven to supply suitable stone both for cement raw material. |
| | Mining operations and practices have been well established over many decades. |
| | The processing of raw materials and manufacture of cement has been in place for many decades and upgraded to be a low emissions facility. |
| | All necessary off-site infrastructure is in place and has served the operation for many decades. |
| | Additional infrastructure will be required to develop the Catawba Farm Quarry and planning and design for this is adequate. |
| | All necessary permits are in place and future permitting is expected to enable extraction of all Reserves included in the estimate. |
| | Costs are well understood and predictable with the operations having been economic for many years and reasonably expected to be so for the projected LOM. |
The QP opines that no issues are unresolved with the technical or economic factors considered in determining Reasonable Prospect For Eventual Economic Extraction (RPEE) that supports the Resource estimate and that the risk of material impacts on the Reserve estimate is low.
The following actions are recommended for the site:
| | Dedicate Resources and effort to securing the Catawba Farm Quarry permits and advancing the necessary infrastructure for mining. |
| | Advance the approval process for the Catawba Farm Quarry Extension. |
| | Continue to evaluate the development of the Lone Star East Quarry Extension. |
| | Evaluate the development of the dolostone deposit for use as a construction aggregates source. |
8
| 2. | INTRODUCTION |
| 2.1 | ISSUER OF REPORT |
Titan is a leading U.S. manufacturer of construction materials that are used in residential, commercial, industrial, infrastructure, and energy applications. Titan has retained CPI to prepare this TRS for the site located in the Commonwealth of Virginia, USA.
| 2.2 | TERMS OF REFERENCE AND PURPOSE |
The purpose of this TRS is to support the disclosure of Mineral Resource and Mineral Reserve estimates for the site as of August 15, 2024. This TRS is intended to fulfill 17 CFR §229, Standard Instructions for Filing Forms Under Securities Act of 1933, Securities Exchange Act of 1934 and Energy Policy and Conservation Act of 1975 Regulation S-K, subsection 1300, Disclosure by Registrants Engaged in Mining Operations. The Mineral Resource and Mineral Reserve estimates presented herein are classified according to 17 CFR §229.1300 (Item 1300) Definitions.
Unless otherwise stated, all measurements are reported in U.S. customary units and currency in U.S. dollars ($).
This TRS was prepared by CPI. No prior TRS has been filed with respect to the site.
The quality of information, conclusions, and estimates contained herein is consistent with the level of effort involved in CPIs services, based on the:
| | Information available at the time of preparation |
| | Data supplied by outside sources |
| | Assumptions, conditions, and qualifications set forth in this TRS |
| 2.3 | SOURCES OF INFORMATION |
This study is supported by Titan technical, operational, market, and financial reports as well as studies and field programs performed by Titan and other external parties, published government reports, published government and historical data, and public information available at the time of writing. This information was related to the following:
| | Property history |
| | Property data |
| | Drillhole records |
| | Sampling protocols |
| | Laboratory protocols |
| | Sample analysis data |
| | Hydrogeology study |
| | Geotechnical studies |
| | Mine operations data |
| | Raw material crushing and handling data |
| | Site infrastructure information and data |
| | Environmental permits and related data/information |
| | Historical and forecast capital and operating cost data. |
The documentation reviewed and other sources of information are provided in Section 24 of this TRS.
9
| 2.4 | QUALIFIED PERSONS |
The QP for this TRS is CPI. CPI was established in 1988, and is an environmental, engineering, and geological consulting firm with offices in Albany, New York; Lutz, Florida; and Mechanicsburg, Pennsylvania. CPI offers expertise in geologic, hydrogeologic, Reserve analysis, environmental, and mine engineering and mapping services to private-sector clients throughout North America.
| 2.5 | PERSONAL INSPECTION |
Since 2000, CPI personnel have been on site on multiple occasions to provide technical support for geology, mine planning, and operations.
The CPI QP, Nathan Moore, conducted a site visit from May 7 to May 17, 2024, and completed the following tasks:
| | Visited the core storage area inspecting core from prior exploration programs |
| | Reviewed logging and sampling procedures |
| | Inspected several locations in the mine, observing the characteristics of the deposit geology |
| | Discussed grade control mapping and sampling procedures |
| | Visited some of the mine stockpile areas |
| | Visited the processing facilities |
| | Inspected the sampling points used to determine the tonnages and grades processed |
| | Visited the site sample preparation facility |
| | Held discussions with site personnel |
| 2.6 | REPORT VERSION |
This TRS, dated August 30, 2024, is the first TRS for the project.
10
| 3. | PROPERTY DESCRIPTION |
| 3.1 | PROPERTY DESCRIPTION AND LOCATION |
The site is in Botetourt County, Virginia, approximately 13 miles from Roanoke. The geodetic coordinates for the site are approximately 37°2743 N and 79°5942. Figure 3-1 shows the location of the site. The site is the accumulation of 24 tax parcels totaling approximately 2,567 acres. Property ownership is under the control of Titan or its subsidiaries.
| 3.2 | MINERAL RIGHTS |
Titan holds the title and mineral rights for the 28 individual properties observed in Figure 3-1. Titan does not lease any of the properties from or to any other ownership entity.
| 3.3 | SIGNIFICANT ENCUMBRANCES OR RISKS TO PERFORM WORK ON PROPERTY |
Several encumbrances are present on the site. These include:
| | Power Lines. A high-voltage electricity transmission line crosses the Catawba Farm proposed quarry. This easement is owned by American Electric Power (AEP) and will require relocation. Per the easement agreement, this will be relocated before 2030 at the cost of AEP. |
| | Conservation Easement. Titan has granted a conservation easement to the Blue Ridge Land Conservancy to compensate for past wetlands impacts. This easement is being modified as part of the Catawba Farm permit modification process. |
| | Public Access Hiking Trail. The Andy Layne Trail (ALT), which joins the Appalachian Trail, crosses the property and accesses a footbridge crossing over Catawba Creek. As part of the Catawba Farm permit modifications, the bridge is to be relocated. |
| | Virginia Route 779 (Catawba Road). This county road crosses the site and will be relocated in the future for the extension of the Catawba Farm Quarry. This could impact the Catawba Farm Extension Resource. The road right of way (ROW) is currently owned by the Commonwealth of Virginia. To relocate the road, both county and the state need to accept the relocation. The current proposal is that a new road will be constructed on Titan-owned land and deeded to the Commonwealth. With the acceptance of the new road, the existing ROW will be abandoned with Titan having the right of first refusal to purchase. As a precedent, a relocation of a section of this road was completed at the site in the 1970s. |
| 3.4 | LEASE AGREEMENTS OR ROYALTIES |
No royalties are paid on any current mining production, and no new royalties are expected in the future.
11
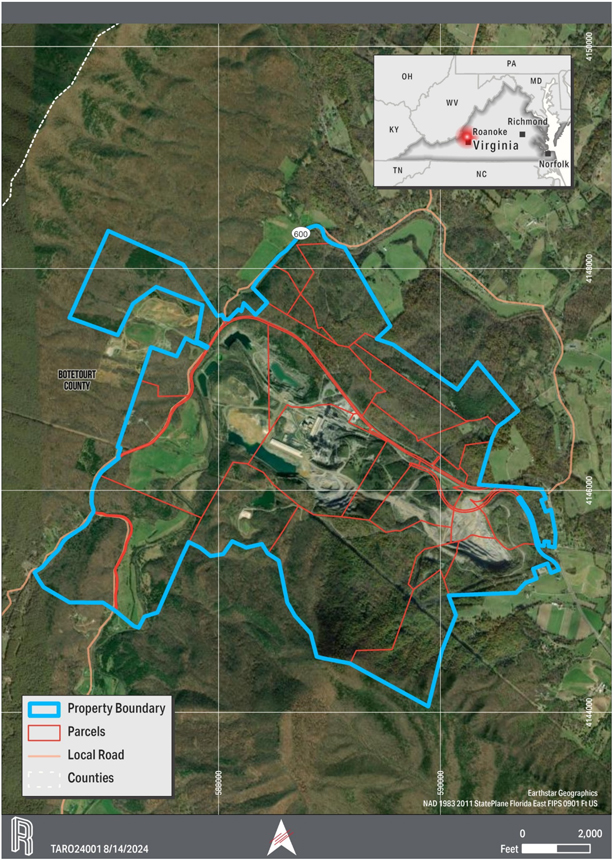
Figure 3-1. General Location Map.
12
| 4. | ACCESSIBILITY, CLIMATE, LOCAL RESOURCES, INFRASTRUCTURE AND PHYSIOGRAPHY |
The site is located in Troutville, Botetourt County, Virginia, and operates year-round.
| 4.1 | TOPOGRAPHY AND VEGETATION |
The site is in the mountainous portion of the Commonwealth of Virginia and is bordered by two major mountain ranges: the Blue Ridge Mountains and the Appalachian Mountains. The site is located in the Catawba Valley close to Tinker Mountain and the elevation ranges from approximately 1,400 to 1,700 feet above sea level (ASL)
The site flora is characteristic of seepage areas at high altitudes on north-facing slopes of the central Blue Ridge Mountains. The area is divided into three habitats: a dry forested tract, a wet forested tract, and an open glade. The dominant tree species in the dry forested tract are Red Oak (Quercus rubra) and Sweet Birch (Betula lenta). The shrubby growth in this area is composed of Rhododendron catawbiense and Kalmia latifolia (Dalmas, 1972).
In the wet forested tract, the dominant tree species are Yellow Birch (Betula lutea), eastern hemlock (Tsuga canadensis), and Red Maple (Acer rubrum). The wetter conditions in this area likely support a different set of plant species compared to the dry forested tract (Dalmas, 1972).
| 4.2 | ACCESSIBILITY AND LOCAL RESOURCES |
Catawba Road (State Route 779) is a two-lane state highway and the only road that provides access to the site. Catawba Road is typically accessed by US Route 220 (US 220) in Daleville. US 220 interchanges with US Interstate 81 a mile and a half from its intersection with Catawba Road. The site is approximately 6 miles from the intersection of US 220 with Catawba Road.
The nearest airport is the Roanoke-Blacksburg Regional Airport, located 16 miles from the site and accessible by the public highway system.
The Norfolk Southern Railway (Norfolk Southern) provides rail service directly to the plant with an 8-mile-long spur dedicated to the site. Norfolk Southern owns and operates this rail line, which runs adjacent to the Catawba Road and terminates at the Norfolk Southern line in Cloverdale, Virginia. This rail service delivers coal and raw materials to the site and finished cement from the site to the distribution terminal network.
| 4.3 | CLIMATE |
Roanoke, Virginia, has a humid subtropical climate characterized by warm to hot summers, mild winters, and rain to support temperate forest. The annual snowfall is less than 20 inches west of Blue Ridge (Ruffner 1980). Snowfalls over (10 inches) are rare in most areas. Thunderstorms are common in late spring and summer and can be severe. The plant and quarry work all year round. Figure 4-1 presents the temperature ranges and rainfall total (averages) for Roanoke.
13
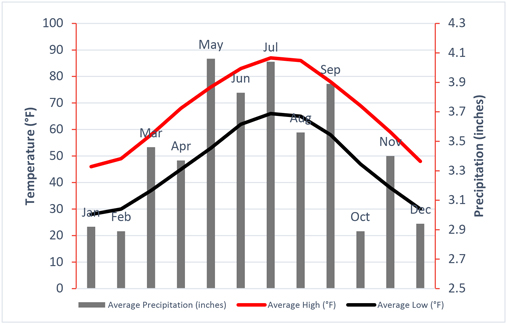
Figure 4-1. Roanoke, Virginia Temperature and Precipitation Data Recorded from 1981-2010 (US Climate Data, 2024).
| 4.4 | INFRASTRUCTURE |
The site has access to existing well-developed infrastructure, including potable water, industrial use water wells, power, gas supply, communications, and transportation. Details of the site Infrastructure are included in Section 15. Regional infrastructure is shown in Figure 4-2.
14
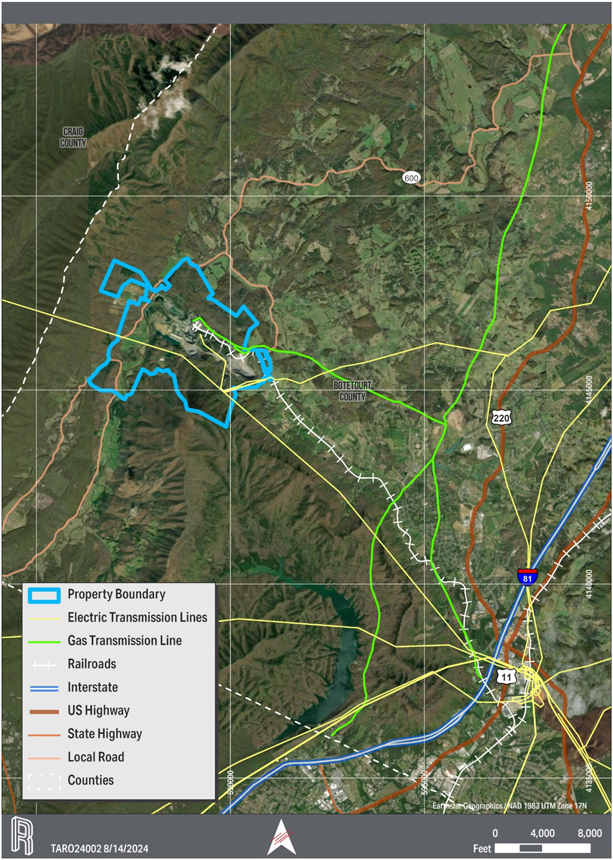
Figure 4-2. Regional Infrastructure.
15
| 4.4.1 | WATER |
The potable water system consists of a drilled well, a 25,000-gallon steel storage tank, and a distribution system that serves the various buildings.
The site has a water recycle system that collects, stores, treats, cools, and reuses processed water. A water treatment system managed by NALCO Water introduces various additives to manage water quality. Supplemental process water can be introduced from the quarry dewatering system.
| 4.4.2 | ENERGY SUPPLY |
Electricity is supplied to the site through Appalachian Power Company (APC). APC is responsible for transmitting and distributing electrical services to the plant. APC serves the site from the Cloverdale station on the Cloverdale, Virginia Mount Union 138 kilovolt (kV) transmission line. Two parallel circuits originate at this substation, providing a redundant loop feed to the site.
Roanoke Gas Company (RGC) delivers natural gas to the site. The RGC distribution system is fed by Columbia Gas Transmission, an interstate natural gas pipeline connecting to RGC at a gate station in Eagle Rock, Virginia.
The Norfolk Southern spur allows for delivery of coal to the site by rail. A railcar unloader transfers coal to the coal stockpile.
Alternative Fuels (AFs) (chipped tires or Tire-Derived Fuels [TDFs]) are another source of energy. Titan plans to consume up to 20 percent of AFs and convert from coal to natural gas by 2030.
| 4.4.3 | PERSONNEL |
The site employs approximately 140 people for operations. Employees include heavy equipment operators, skilled tradesmen, engineers, support personnel, and managers. Accommodation for site employees is available in the nearby communities of Botetourt, Craig, and Roanoke counties and the cities of Roanoke, Salem, and Blacksburg.
| 4.4.4 | SUPPLIES |
Supplies for plant operations (equipment, parts) are adequate and available in the region, which consists of the Lynchburg, New River Valley, and Roanoke-Alleghany Metropolitan Statistical Areas (MSAs). Supplies are also received through commercial shipping operations at the Roanoke-Blacksburg Regional Airport.
16
| 5. | HISTORY |
| 5.1 | PRIOR OWNERSHIP |
The site has been in operation since 1951. Titan purchased a controlling interest in the site in 1992 and took full ownership in 2000. Table 5-1 summarizes the ownership history of the site.
Table 5-1. Ownership History
| Year |
Company |
Operations/Activity |
||
| 1950 | Lone Star Cement Corporation (LSC) | Began constructing the cement plant | ||
| 1951 | LSC | Cement production began | ||
| 1960s | RCC | LSC started conducting business as RCC | ||
| 1992 | RCC, subsidiary of Titan | Titan purchased a controlling stake in the site | ||
| 2000 | RCC | Titan acquired the remaining shares |
| 5.2 | EXPLORATION AND DEVELOPMENT HISTORY |
Various drilling campaigns and geological investigations have been completed; however minimal data were recorded for exploration activities before 1979.
Table 5-2 summarizes the exploration and development history of the site.
Table 5-2. Summary of Historical Exploration Programs up to 1986
| Year |
Company |
Purpose |
Summary of Work |
Comment |
||||
| 1956 | Lone Star | No data available | Shale | |||||
| 1972 | Lone Star | No data available | Shale | |||||
| 1979 | William Seaton | To estimate RCCs Resources near Catawba Creek | 11 coreholes totaling 5,295 feet. Proven and Probable Reserves were estimated |
1,023 XRF assays, 5-ft intervals, laboratory unknown | ||||
| 1985- 86 |
J.D.Davenport | To estimate RCCs Resources | 12 coreholes totaling 3,150 feet. Proven Reserves were estimated |
679 assays, 5-ft intervals, on-site laboratory | ||||
XRF = X-ray fluorescence
17
| 6. | GEOLOGICAL SETTING, MINERALIZATION AND DEPOSIT |
| 6.1 | REGIONAL GEOLOGY |
The site is located in the Valley and Ridge physiographic province of Virginia, which is part of the Appalachian Highlands physiographic division. The Valley and Ridge province is composed of sedimentary layers of ancient North American continental margin that were folded and faulted during the collision of paleo-island arcs and continentals. Subsequent erosion and weathering of the sedimentary rock formed characteristic long, linear ridges (e.g., erosion-resistant sandstones) and valleys (preferentially weathered carbonate and shale) that give the physiographic province its name.
| 6.2 | LOCAL GEOLOGY |
The site is located at the apex of the Catawba Syncline among outcrops of limestone, dolomite, shale, and sandstone. Figure 6-1 shows the position of the site and quarries within the local geological setting. In the hinge zone the strike direction changes from northwest-southeast in the historical Lone Star Quarries to a northeast-southwest direction in the Catawba Farm property. Geologic mapping suggests structural thickening also occurs within units of the hinge zone. The site mines Ordovician-aged sedimentary calcareous rocks for production of cement.
| 6.3 | PROPERTY GEOLOGY |
The bedrock beneath the site is sedimentary in nature. Extensive historical excavations at the site have encountered sandstone, carbonaceous shale, limestone, and dolostone.
| 6.3.1 | LONE STAR EAST QUARRY |
The Lone Star East Quarry is located in the eastern limb of the Catawba Syncline. The strike of the strata is northwest to southeast, with beds dipping 30° to 75° to the southwest.
| 6.3.2 | HIGH GRADE SHALE QUARRY |
The High-Grade Shale Quarry is located along the strike of the outcrop of the contact between Ordovician sandstone and shale and Ordovician argillaceous limestone and calcareous shale on the eastern limb of the Catawba Syncline. The beds dip 25°to 50°to the southwest, with the steeper dip in the active mining area.
| 6.3.3 | CATAWBA FARM QUARRY |
The Catawba Farm Quarry will be located along the strike of the western limb of the Catawba Syncline. The strike of this strata is generally south-southwest by north-northeast, with beds dipping 30° to 50° to the east-southeast.
18
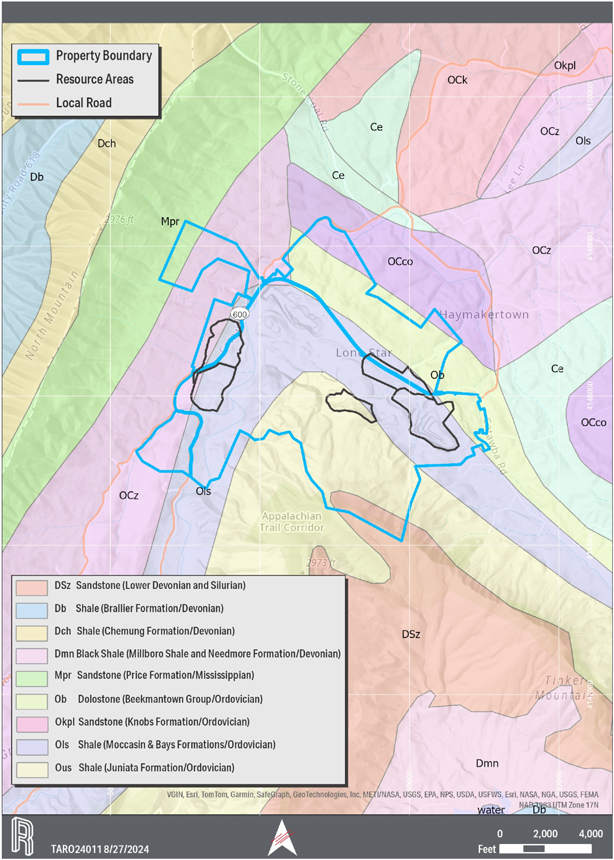
Figure 6-1. Local Geology Setting.
19
| 6.4 | STRATIGRAPHY AND MINERALOGY |
Figure 6-2 shows a stratigraphic column of the Ordovician units found at the site. The complete fault separation of the Catawba Syncline from surrounding bedrock geology has complicated the correlation of its units with similarly named regional equivalents that often outcrop only long distances away from the site. However, Catawba Syncline stratigraphy is broadly consistent with regional Valley and Ridge Paleozoic stratigraphy. Sandstone and shale-dominated Mississippian, Devonian, and Silurian sections pass downward into calcareous shale of the Upper Ordovician Martinsburg and Bays Formations, which are underlain by Middle Ordovician calcareous shale, limestones, and dolostone, and the Cambrian Upper and Lower Conococheague carbonate formations.
Figure 6-2. Typical Stratigraphic Column.
20
Figure 6-3 depicts the A-A cross section of the Catawba Quadrangle geologic map and shows that the Catawba Syncline block overlies the Saltville Thrust Sheet.
Figure 6-3. Cross Section of the Catawba Quadrangle [after (Prince & Henika, 2018)].
The stratigraphic units mined have been described in the 2018 Catawba Geological Quadrangle Map (Prince & Henika, 2018), and two previous CPI reports, as summarized in the following sections.
| 6.4.1 | THE BAYS FORMATION |
The Bays Formation is olive to brown, fine- to medium-grained quartz sandstone beds, 3 to 5 feet thick with some lithic content, interbedded with olive and maroon siltstone and shale. Prominent sandstone beds in the Bays Formation often present a sharp, distinct contact with underlying black calcareous shale of the Edinburg Formation.
| 6.4.2 | THE EDINBURG FORMATION (LIBERTY HALL) |
The Edinburg Formation is a thinly bedded dark gray to black limey shale, with uncommon calcite veins. It appeared as a series of even dark- and light-colored bands, with dark bands having more fissile beds than the light bands, and most core breaks happened in the dark bands.
| 6.4.3 | MIDDLE ORDOVICIAN LIMESTONES |
The Effna member limestone is dark gray, typically fine to very fine grained, occasionally banded medium and dark gray, bioclastic grainstone and often pyritic.
The Lincolnshire member of the Middle Ordovician limestones is a dark gray, medium to coarse grained, cobbly weathering wackestone with silty laminae and black chert stringers.
21
The New Market member is a compact, light to medium gray micrite with calcite rhombs and shaley stringers. This unit is also referred to as Five Oaks limestone. The base of this unit has interbedded dolomitic limestone and limestone beds.
| 6.4.4 | THE BEEKMANTOWN FORMATION |
The Beekmantown Formation is a light gray finely crystalline laminated dolostone containing abundant white, gnarled chert that dominates soil as float clasts and blocks up to four feet across. Gray micrite and angular dolomite breccia beds occur near the top of the unit, which is in unconformable contact with the overlying Middle Ordovician limestones. This unit weathers to a tan color.
| 6.4.5 | STRATIGRAPHY LONE STAR EAST QUARRY & CATAWBA FARM QUARRY |
The primary units targeted for cement production in the Lone Star East Quarry are the members of the Effna-Lincolnshire-New Market grouping of the Middle Ordovician limestones. Dolomitic limestone and karst infill can also be used for cement kiln feed in limited quantities. Dolostone from the Beekmantown Formation is also present in the quarry footprints.
| 6.4.6 | STRATIGRAPHY HIGH GRADE SHALE QUARRY |
The High-Grade Shale Quarry is located at the boundary between Bays and the Liberty Hall member of the Edinburg formation.
| 6.5 | MINERALIZATION |
The mineralization characteristics of the deposit are controlled by the sedimentary strata found at the site. The chemical signature of each unit is distinctive and allows for verification of contacts. The units in the Lone Star Quarries that have historically been targeted for use in cement are portions of the calcareous Edinburg (Liberty Hall) shale and Effna-Lincolnshire-New Market limestones.
Beekmantown dolostone is not currently used for kiln or finish mill feed and will be used as feed for finish mills starting in 2024, along with shale that otherwise exceeds sulfur content. Beekmantown dolostone has been identified as a potential source of aggregate.
Overburden (red clay) is not used in kiln feed. However, lime mud and clay interburden or infilled karst is used when conditions are dry. Topsoil is used for reclamation activities.
The mineable deposits at the site are limited by geology, bed orientation, environmental considerations, and surface features. Like many limestone deposits suitable for cement, usable material is widespread and linked closely with the chemical characteristics of individual beds.
22
| 7. | EXPLORATION |
| 7.1 | DRILLING PROGRAMS |
Numerous drilling campaigns have been conducted at the site since 1992. Table 7-1 details the recent campaigns by year at the site. Logs and core photographs are available for campaigns through 2005 through 2024. Figure 7-1 shows a plan view map of the site with all completed drillhole locations.
In 2005, a drilling campaign in Lone Star East accessed the short-term Reserves. A short-term mine plan was completed based on the results of the drilling campaign.
In 2006, a drilling campaign in and around Lone Star East accessed the long-term Reserves. A long-term mine plan was generated.
A 2007 drilling campaign was completed to identify and determine the quality of dolomite on site.
A 2013 drilling campaign was completed to better define the geology in the extension area of Lone Star East for future mine planning. Limestone and limey shale were mainly encountered, and only one hole to the west encountered the Effna formation.
In a continuation of the sites drilling activities, two phases of drilling were conducted in 2015. Holes were drilled in and around the Lone Star East and High-Grade Shale Quarries.
In 2022, drilling was conducted in two phases to better define geologic contacts in the Catawba Farm tract and the Lone Star East Pit.
Core drilling methods for all campaigns varied, and most drilling was performed by a truck-mounted drill rig capable of wireline drilling. Air rotary drilling was conducted in 2005. Sonic drilling was used on overburden holes in 2024.
23
Table 7-1. Drillholes by Year
| Campaign |
Company | Area |
Number of Holes |
Logs | Assays | Note |
||||||
| 2005 | RCC | Lone Star East | 36 | Yes | 287 | Air rotary, 5-ft intervals | ||||||
| 2006 | RCC | Lone Star East and shale | 9 | Yes | 378 | core, 10-ft intervals | ||||||
| 2007 (1) | Titan | Lone Star East Extension dolostone | N/A | N/A | 128 | Surface mapping & grab samples | ||||||
| 2007 (2) | Titan | Lone Star East Extension dolostone | 13 | Yes | 128 | Dolostone only (Project Blue), core, 10-ft intervals. No testing for aggregate. |
||||||
| 2007 (3) | Titan | Lone Star East Shale | 14 | Yes | 463 | Shale, sandstone, core, 5-ft intervals | ||||||
| 2013 | Titan | Lone Star East & Extension | 9 | Yes | 525 | Core, 5-ft. intervals | ||||||
| 2015 | Titan | Lone Star East, High-Grade Shale, Catawba Farm | 15 | Yes | 655 | Core, 5-ft intervals | ||||||
| 2015 ER | Titan | Catawba Farm, Lone Star East | N/A | N/A | | Electrical Resistivity | ||||||
| 2022 | Titan | Lone Star East | 12 | Yes | 281 | Core, 10-ft intervals | ||||||
| 2022 MW | Titan | Catawba Farm | 6 | Yes | Monitor Wells | |||||||
| 2024 | Titan | Catawba Farm and Extension, Lone Star East and Extension | 37 | Yes | 837 | Core, chemistry and Geotech, 10-ft intervals | ||||||
| 2024 SPT | Titan | High-Grade Shale, Lone Star East dolostone | 23 | | Split spoon (geotechnical) |
24
Figure 7-1. Drillhole Locations.
25
| 7.2 | HYDROGEOLOGY INFORMATION |
In 2023, a regional hydrogeologic analysis report was prepared by Koontz Byrant Johnson Williams, Inc. (KBJW). This analysis concluded that the current groundwater withdrawals at the site are not causing adverse impacts to the groundwater levels in the region. In the quarries, an observation well network was recommended to be installed to monitor groundwater levels in areas adjacent to the quarrying operations and five wells were installed in 2023. KBJW assumed that if a pit floor elevation of approximately 950 ft was used, the groundwater inflow rate into the Catawba Farm area would be approximately 250 gallons per minute.
| 7.3 | GEOTECHNICAL INFORMATION |
The site has conducted two slope stability analysis studies. The first study was completed in 2008 for the shale quarry (by CPI), and the second study was completed in 2024 for the Catawba Farm area (by KBJW). During the studies, core samples were collected to measure soil stability and rock properties and SLOPE/W software was used to establish quarry bench heights, bench widths, bench face angles, water control measures, and other operational parameters for the quarries.
| 7.4 | EXPLORATION OTHER THAN DRILLING |
Geophysics surveys were conducted in 2015 on the Catawba Farm site. These resistivity surveys were preliminary exploration of the site to indicate likely soft overburden depths and target future drilling campaigns.
26
| 8. | SAMPLE PREPARATION, ANALYSES AND SECURITY |
| 8.1 | SAMPLE PREPARATION AND ANALYSIS |
| 8.1.1 | 2005-2007 DRILLING PROGRAMS |
Multiple drill programs were performed between 2005 and 2007 using both wireline core and air rotary drilling. These programs were specifically designed for production scheduling, short-term mine planning, and Resource exploration. All field logging and sampling was completed by CPI. Recovered cores were split on site, and 5-to-10-foot composite intervals and assays were performed by Titans on-site laboratory, and all collars were surveyed by Titan.
| 8.1.2 | 2013-2022 DRILLING PROGRAMS |
Core drilling in this period was logged and sampled by CPI. Cores were split longitudinally and sampled in 5-foot composites. The remaining core split was reboxed and stored on site. All assays were performed by Titans on-site laboratory.
| 8.1.3 | 2023-2024 DRILLING PROGRAMS |
In the 2024 campaign, all field logging of cores was completed by CPI. Sample cores were split on site with one-half reboxed and archived. The remaining half was composited in 10-foot samples for limestones and calcareous shales. Dolomitic material was sampled in two 10-foot samples and one 50-foot composite. Clay samples were shipped in 5-foot intervals from the overburden drilling.
All samples were sent to Bowser-Morner Laboratories (BM) in Dayton, Ohio for testing. BM has the following accreditations:
| | Construction Materials Testing Laboratory AccreditationAASHTO ISO/IEC 17025 Accredited |
| | ANSI National Accreditation Board ANAB ISO/IEC 17025:2017 Accredited (Testing & Calibration ServicesCertificate # L2444) |
| | U.S. Army Corps of Engineers Validated |
BM received 858 samples for chemical assays and 12 samples for specific gravity (SG) testing. Samples were prepared following American Society for Testing and Materials (ASTM) C50. Chemical analysis was completed in accordance with ASTM C1271, ASTM C1301, and ASTM C25. SG was tested according to ASTM C127. BM sampling followed these internal procedures:
| | The received samples were logged in BM LIMS (laboratory information management system), and all bags were labeled accurately. |
| | All samples were dried overnight at 110ºC. The weight of the as-received and the dried samples were recorded. |
| | Material was then crushed and reduced per ASTM C50. |
| | Material for SG followed ASTMC127. |
| | Chemistry Laboratory Sample Prep and Testing: |
| | The crushed portion of each sample was subsampled (using a standard splitter), and 100-gram specimens were ground to a minus100 sieve for X-ray fluorescence (XRF) analysis. |
| | Pulverized minus 100 material was pressed to form a briquette. |
27
| | XRF analysis was performed on the briquette. |
| | If the analysis failed BM QC protocols pulverized minus 100 material was mixed with flux (lithium metaborate) and fused to prepare a bead and rerun for XRF analysis. |
| | XRF analysis was performed on the fused bead. |
| 8.2 | SAMPLE SECURITY |
All retained core material is boxed and housed in the core building located next to the quarry office. Returned remnant sampled material is also archived at this location. The core building is locked and access restricted by site management.
| 8.3 | QUALITY ASSURANCE/QUALITY CONTROL |
For validation of the 2024 drilling campaign, a random selection of 12 percent of the samples tested were sent as pulverized duplicates to Chicago Testing Laboratories (CTL) in Chicago, Illinois. CTL is an accredited testing facility. CTL performed XRF analysis on the samples as follows:
| | Pulverized minus 100 material was mixed with flux (lithium metaborate) and fused to prepare a bead for XRF analysis. |
Results of this testing were within the standard deviation for the relevant geochemistry and geologic unit.
As part of the 2024 drilling campaign, Lapis reviewed assay results from previous drilling campaigns and found significant errors in samples with low calcium oxide (CaO) content, indicating a calibration problem when testing low-grade limestone. Lapis derived a correction factor that adequately corrected the erroneous values in most cases; if the correction did not result in totals within the acceptable range, that interval was disregarded for chemistry modeling.
| 8.4 | OPINION OF THE QUALIFIED PERSON ON ADEQUACY OF SAMPLE PREPARATION |
The QP opines that sample preparation, analysis, and security are sufficient to support verifying the testing procedures and needs at the quarry. The QP also opines that additional data verification is not necessary at this site because of the extensive surface and subsurface data available.
28
| 9. | DATA VERIFICATION |
| 9.1 | SOURCE MATERIAL |
Drilling records for the site were reviewed including field geologists logs, assay results from laboratories, as well as map files and reports for the 2024 Resource estimation. To the extent possible, each drillhole included within the mine plan was checked individually against a copy of the drillers and/or geologists log to confirm data accuracy.
The core holes from 2024 were placed adjacent to twin DH-79-1, DH-79-4, and DH-79-5 to confirm the accuracy of the 1979 drillhole data. Based on this cross-check, it is reasonable to assume that the 1979 drillhole assay data is accurate and can be used in deposit modeling.
As noted in Section 8.4 by cross checking 2024 results to earlier campaigns an error in low-grade limestone values was noted and a correction factor that adequately corrected the erroneous values was applied.
The confidence in the pre-2024 drilling campaigns is highly based on the historical mining and production of cement and construction aggregates.
| 9.2 | OPINION OF THE QUALIFIED PERSON ON DATA ADEQUACY |
The QP opines that the adequacy of the data for the purposes used in this TRS is accurate and sufficient. The QP has determined that all referenced data in this TRS and all subsequent modeling meets industry quality standards for the purposes used in the technical summary.
29
| 10. | MINERAL PROCESSING AND MINERALOGICAL TESTING |
The cement plant has operated successfully for 73 years. The original testing records for the processing system are no longer available. It is the QPs opinion is that no additional testing is necessary to have confidence in the estimation of Resources or Reserves. The mine has been successfully producing cement products with the processing plant which has undergone numerous upgrades under the current ownership. The QP also notes that adequate quality control procedures are established and followed to ensure the production of quality products.
The Catawba Farms Quarry will be developed on the site. This quarry will extract raw materials from the same formations as the nearby Lone Star East Quarry. The results of exploration and chemical analysis of the limestone and dolostone indicate the material will have the same characteristics as the existing raw material feed to the plant.
30
| 11. | MINERAL RESOURCE ESTIMATES |
| 11.1 | DEFINITIONS |
The following text provides definitions of Mineral Resource and the different Mineral Resource categories according to 17 CFR § 229.1301 (2021):
A Mineral Resource is an estimate of mineralization, considering relevant factors such as cut-off grade, likely mining dimensions, location, or continuity, that, with the assumed and justifiable technical and economic conditions, is likely to, in whole or in part, become economically extractable.
Mineral Resources are categorized according to 17 CFR § 229.1301 (2021) based on the level of confidence in the geologic evidence. The following definitions of Mineral Resource categories are included for reference:
An Inferred Mineral Resource is that part of a mineral resource for which quantity and grade or quality are estimated on the basis of limited geological evidence and sampling. An inferred mineral resource has the lowest level of geological confidence of all mineral resources, which prevents the application of the modifying factors in a manner useful for evaluation of economic viability. An inferred mineral resource, therefore, may not be converted to a mineral reserve.
An Indicated Mineral Resource is that part of a mineral resource for which quantity and grade or quality are estimated on the basis of adequate geological evidence and sampling. An indicated mineral resource has a lower level of confidence than the level of confidence of a measured mineral resource and may only be converted to a probable mineral reserve. As used in this subpart, the term adequate geological evidence means evidence that is sufficient to establish geological and grade or quality continuity with reasonable certainty.
A Measured Mineral Resource is that part of a mineral resource for which quantity and grade or quality are estimated on the basis of conclusive geological evidence and sampling. As used in this subpart, the term conclusive geological evidence means evidence that is sufficient to test and confirm geological and grade or quality continuity.
| 11.2 | KEY ASSUMPTIONS, PARAMETERS AND METHODS |
The site contains multiple separate Resource areas. Figure 11-1 illustrates their position on the property.
31
Figure 11-1. Roanoke Cement Company - Resource Areas.
32
| 11.2.1 | DENSITY DETERMINATIONS |
In 2024, BM conducted 12 SG tests on core samples. A correction factor of 0.99 was applied to account for porosity in the rock matrix. The resulting density factors, rounded to the nearest 0.5 pcf, are:
| | Limestone (Effna, Lincolnshire/New Market): 169.0 pcf (2.29 tons/cubic yard) |
| | Shale (Edinburg): 168.0 pcf (2.27 tons/cubic yard) |
| | Dolostone (Beekmantown): 172.5 pcf (2.33 tons/cubic yard) |
| 11.2.2 | RESOURCE CLASSIFICATION CRITERIA |
This Resource estimate covers raw materials for cement manufacturing. Resources for each application may be sourced from separate quarry areas at the site and are evaluated separately.
| 11.2.2.1 | LIMESTONE RESOURCE AREAS |
The geology of the limestone Resource areas (Catawba Farm Quarry & Extension, Lone Star East Quarry & Extension) includes up to six separate lithologies in steeply inclined beds. Chemistry is controlled by stratigraphy in the inclined beds and can vary significantly in the horizontal direction across strike.
For Resources in these areas, Lapis used an approach based on the number of drillholes and samples that influence each block in a chemistry block model, using given modeling parameters. Table 11-1 summarizes the classification criteria for limestone and associated carbonates in the Catawba Farm and Lone Star East areas.
Table 11-1. Summary of Geologic Confidence Classification Criteria (Limestone)
| Geologic Confidence |
Minimum # of Drillholes |
Minimum # of Samples |
||||||
| Inferred |
1 | 1 | ||||||
| Indicated |
2 | 3 | ||||||
| Measured |
4 | 5 | ||||||
| 11.2.2.2 | NON-LIMESTONE RESOURCE AREAS |
Resource areas with non-limestone material do not have current chemistry block models to which the limestone criteria can be applied.
| 11.2.3 | MARKET PRICE |
This estimate of Resources at the site is based on the premise that quarrying operations will continue in the same manner and with the same economics as they have in the past. While future investments will be necessary, all are assumed to be reasonable and technically feasible. The 2025 reference price for cement for the economic analysis supporting the determination of economic viability is $136/ton. This is based on figures from the USGS and detailed in sections 16.5 and 19.1.2.
| 11.2.4 | CUT-OFF GRADE |
This site pre-blends raw feed at the primary crusher station to control quality. Operators stockpile materials of different lithologies, chemistries, and material handling qualities (clayey or karst limestone) separately at the crusher station for blending. As a result of this practice, nearly all carbonate material from the quarries can be used.
33
A recovery factor of 95 percent is used to convert in situ volumetrics to recoverable Resources and Reserves. The point of refence is the raw material stack after the primary crusher. This 5 percent loss represents minimal mining and processing losses.
| 11.2.5 | SUMMARY OF PARAMETERS |
Key assumptions and parameters applied to estimate mineral Resources are included in Table 11-2.
Table 11-2. Parameter Assumptions
| Factor Used in Resource Estimate |
Parameter Used |
|
| Chemistry Model influence: Inferred | At least 1 drillhole and at least 1 sample | |
| Chemistry Model influence: Indicated | At least 2 drillholes and at least 3 samples | |
| Chemistry Model influence: Measured | At least 4 drillholes and at least 5 samples | |
| ROI: Inferred | 2,640 feet | |
| ROI: Indicated | 1,320 feet | |
| ROI: Measured | 660 feet | |
| Density: Limestone | 169 pcf | |
| Density: Carbonaceous Shale | 168 pcf | |
| Density: Dolostone (Lone Star East) | 172.5 pcf | |
| Density: Aggregates (Dolostone) | 163 pcf | |
| Cut-off Grade | Not applied within ore body. | |
| Property Offset | 100 feet | |
| Infrastructure Protection Offset | Not applied |
| 11.3 | RESOURCE MODEL |
Drilling and geophysical methods have been used to collect information about the geology and chemistry of the deposit. Drilling and assay information has been consolidated into a single digital database containing all relevant data. The drillhole database includes collar (drillhole) and quality (assay) data determined through XRF spectroscopy at regular intervals.
Project geospatial data is based and reported in the US State Plane Virginia South (2011) coordinate system (EPGS 6595). Elevations are measured in the NAVD88 vertical datum (EPGS 5703).
The limestone and non-limestone materials in the Catawba Farm Quarry, Catawba Farm Extension, Lone Star East Quarry, Lone Star Extension, and Lone Star East Quarry areas have been thoroughly drilled and tested and have sufficient information available to support block modeling. Lapis constructed chemistry block models using Surpac software for the Catawba Farm Quarry and Catawba Farm Extension combined area, and the Lone Star East Quarry and Lone Star Extension combined area. Block size for both models is 25L X 25W X 5H.
Modeled geologic contacts were developed using the following methods:
| | The bottom of overburden: |
| | Data: drill log information and the results of the 2015 electrical resistivity survey (Catawba Farm only). |
| | Method of interpolation: kriging. |
| | Contact between the Liberty Hall and Effna members of the Edinburg Formation: |
| | Data: chemical assays. |
34
| | Method of interpolation: iterative minimum curvature interpolation method. |
| | Parameters of interpolation: visual interpretation of the jack-knife cross validation method. |
| | Contact between the New Market Formation and the Beekmantown Formation: |
| | Data: chemical assays. |
| | Method of interpolation: iterative minimum curvature interpolation method. |
| | Parameters of interpolation: visual interpretation of the jack-knife cross validation method. |
The following steps were used to assemble and compute the chemistry attributes of the block model:
| 1. | Assign background values. |
| 2. | Ordinary kriging using dynamic anisotropy. |
| 3. | Kriging with small search radius, small variogram range, and anisotropy to model Fe2O3 and SO3 outliers. |
| 4. | Model Cleaning to correct unrealistic values generated from kriging. |
| a. | Negative values for Na2O and K2O replaced with 0.005. |
| b. | CaO and loss on ignition above the theoretical maximum replaced with 56 and 44, respectively. |
The assay results for limestone and dolostone within each Resource area were compared with the average oxide values predicted by the block model. The results of all oxides are similar in all areas, indicating the block model is valid and can be used for Resource estimation.
Prior to 2015, Titan used Vulcan software to construct the geologic model in the High-Grade Shale Quarry. Low-alkali and high-alkali bed contacts are effective at predicting the sandstone/shale contacts in the quarry. The Vulcan solids were converted into digital surfaces for use in Carlson software.
The geologic model has proved to be accurate in predicting actual production quality, and it is reasonable to assume that it can be used to estimate the volume of shale and sandstone within the LOM pit shell.
| 11.4 | MINERAL RESOURCES |
| 11.4.1 | ESTIMATE OF MINERAL RESOURCES |
Lapis prepared in situ Resource estimates based on LOM plans and the criteria for classifying geological confidence as described in Section 11.2.2. Estimates are distinguished by Resource area and lithology, with separate estimates for limestone, carbonaceous shale and sandstone, and dolostone.
Block model statistics and classification parameters indicate that all limestone Resource blocks in the Catawba Farm Quarry, Catawba Farm Extension, Lone Star East Quarry, and Lone Star Extension areas are classified as Measured Resources. Lapis classified dolostone Resources in the Catawba Farm Quarry, Catawba Farm Extension, Lone Star East Quarry, and Lone Star Extension areas using the same criteria as the limestone Resources in those areas and determined the vast majority of dolostone Resource blocks in these areas are Measured. All shale Resources are located within a 660-foot ROI around one or more drillholes and can be classified as Measured Resources. Lapis is of the opinion that the dolostone in the aggregates Resource area should all be classified as Inferred as there is no materials testing available to confirm that the dolostone in this area can be used for aggregates.
Resource estimates are shown in Table 11-3 and are exclusive of tons to be converted to Reserves. The effective date of the Mineral Resource estimate fs May 1, 2024. The point of reference for the Resource estimates stated in this TRS is the raw material stack, located after the primary crusher.
35
Table 11-3. Roanoke Cement Company Summary of Mineral Resources (exclusive of Mineral Reserves) as of May 1, 2024
| Resource Category |
k tons | SiO2 (%) | Al2O3 (%) | CaO (%) | ||||||||||||
| Catawba Farm Quarry Dolostone |
||||||||||||||||
| Inferred |
48 | 18.3 | 1.2 | 30.8 | ||||||||||||
| Catawba Farm Extension Limestone |
||||||||||||||||
| Measured |
30,000 | 10.8 | 2.3 | 46.5 | ||||||||||||
| Indicated |
0 | | | | ||||||||||||
| Measured + Indicated |
30,000 | 10.8 | 2.3 | 46.5 | ||||||||||||
| Catawba Farm Extension Dolostone |
||||||||||||||||
| Measured |
4,600 | 12.9 | 1.4 | 31.2 | ||||||||||||
| Indicated |
190 | 12.9 | 1.4 | 31.2 | ||||||||||||
| Measured + Indicated |
4,790 | 12.9 | 1.4 | 31.2 | ||||||||||||
| Inferred |
48 | 12.9 | 1.4 | 31.2 | ||||||||||||
| Lone Star East Quarry Dolostone |
||||||||||||||||
| Measured |
1,500 | 13.3 | 1.7 | 32.0 | ||||||||||||
| Measured + Indicated |
1,500 | 1.7 | 32.0 | 1.1 | ||||||||||||
| Lone Star East Extension Limestone |
||||||||||||||||
| Measured |
54,000 | 7.9 | 1.5 | 48.3 | ||||||||||||
| Measured + Indicated |
54,000 | 7.9 | 1.5 | 48.3 | ||||||||||||
| Lone Star East Extension Dolostone |
||||||||||||||||
| Measured |
22,000 | 10.4 | 1.7 | 33.5 | ||||||||||||
| Measured + Indicated |
22,000 | 10.4 | 1.7 | 33.5 | ||||||||||||
|
|
|
|
|
|
|
|
|
|||||||||
| Roanoke Site Totals Limestone |
||||||||||||||||
| Measured |
84,000 | 8.9 | 1.8 | 47.7 | ||||||||||||
| Indicated |
0 | | | | ||||||||||||
| Measured + Indicated |
84,000 | 8.9 | 1.8 | 47.7 | ||||||||||||
| Inferred |
0 | | | | ||||||||||||
|
|
|
|
|
|
|
|
|
|||||||||
| Roanoke Site Totals Dolostone |
||||||||||||||||
| Measured |
28,100 | 11.0 | 1.6 | 33.0 | ||||||||||||
| Indicated |
190 | 12.9 | 1.4 | 31.2 | ||||||||||||
| Measured + Indicated |
28,290 | 11.0 | 1.6 | 33.0 | ||||||||||||
| Inferred |
96 | 15.6 | 1.3 | 31.0 | ||||||||||||
Notes:
| (1) | Mineral Resources are not Mineral Reserves and do not have demonstrated economic viability. |
| (2) | Mineral Resources are exclusive of Mineral Reserves. |
| (3) | Mineral Resources point of reference is the raw material stack at the plant area. |
| (4) | Mineral Resources Reasonable Prospects for Economic Extraction (RPEE) commodity price is based on a 2025 cement price of $136 per ton, Free on Board (FOB) the plant. |
| (5) | Tons are rounded to the nearest thousand. |
| (6) | Sums may not be exact because of rounding. |
| (7) | There is no certainty that all or any part of the Mineral Resources estimated will be converted into Mineral Reserves |
36
| 11.4.2 | GEOLOGIC CONFIDENCE AND UNCERTAINTY |
There is a high degree of confidence in the geologic formation based on drilling data, regional geologic mapping, and mining history.
| 11.5 | OPINION OF THE QUALIFIED PERSON |
The QP opines that the carbonate deposits at the Roanoke site are modeled adequately considering the quality and geologic characteristics of the ore body. Such interpretations were made based on the drilling campaigns, other exploration activities, and the mining history at the site. The QP also opines that the Resource estimates have been developed following customary and industry standard practices in the construction materials mining industry. No proprietary methods, standards, or software were used in the Resource estimate.
37
| 12. | MINERAL RESERVE ESTIMATES |
| 12.1 | DEFINITIONS |
The following text provides definitions of Mineral Reserve and the different Mineral Reserve categories according to 17 CFR § 229.1301 (2021):
A Mineral Reserve is an estimate of tonnage and grade or quality of indicated and measured mineral resources that, in the opinion of the qualified person, can be the basis of an economically viable project. More specifically, it is the economically mineable part of a measured or indicated mineral resource, which includes diluting materials and allowances for losses that may occur when the material is mined or extracted.
Probable Mineral Reserves comprise the economically mineable part of an indicated and, in some cases, a measured mineral resource. Proven mineral reserves represent the economically mineable part of a measured mineral resource and can only result from conversion of a measured mineral resource.
| 12.2 | KEY ASSUMPTIONS, PARAMETERS AND METHODS |
| 12.2.1 | RESERVE CLASSIFICATION CRITERIA |
Portions of the deposit that were identified in Section 11 as Indicated Resources have been converted to Probable Reserves and tons identified as Measured Resources have been converted to Proven Reserves.
LOM pit designs are constrained by surface features such as property setbacks, conservation easements, water bodies, quarry infrastructure, and/or geology. The Catawba Farm Quarry, Catawba Farm Extension, and High Grade Shale Quarry LOM pits were designed using benching plans recommended in slope stability studies performed specifically for those areas. The Lone Star East Quarry is well developed, with no history of slope failure; future development will continue with the existing parameters.
The Mineral Reserves figures for limestone represent the number of tons estimated to be in the full LOM pit design.
The Mineral Reserves figures for shale and dolostone represent the quantity expected to be consumed during the production schedule for cement raw feed. The quantity of both materials at the site exceeds the quantity required to blend with the limestone Reserves at the site. As more Resources are converted to Reserves in future years, this approach could be modified.
The point of reference for the Reserves stated in this TRS is the raw material stack, located after the primary crusher.
| 12.2.2 | CUT-OFF GRADE |
No cut-off grades were applied to this project. Limestone consumption to produce cement was based on approximately 1.425 million t/a of crushed stone used in multiple sub-product streams, each with varying specifications, and adjusted per Titans current blending strategy to meet the final specifications of the cement products.
38
A recovery factor of 95 percent is used to convert in situ volumetrics to recoverable Resources and Reserves. The point of refence is the raw material stack after the primary crusher. This 5 percent loss represents minimal mining and processing losses.
| 12.2.3 | MARKET PRICE |
The 2025 reference price for cement for the economic analysis supporting the determination of economic viability is $136/ton. This is based on figures from the USGS and detailed in sections 16.5 and 19.1.2.
| 12.3 | MINERAL RESERVES |
Table 12-1 shows the Reserve estimate for all Resource areas at the site. Values are stated in short tons.
39
Table 12-1. Roanoke Cement Company - Summary of Mineral Reserves as of May 1, 2024
| Tons | SiO2 | Al2O3 | CaO | |||||||||||||
| Quarry/Reserve Category |
(k ton) | (%) | (%) | (%) | ||||||||||||
| Catawba Farm Quarry Limestone |
||||||||||||||||
| Proven |
23,000 | 8.91 | 1.92 | 48 | ||||||||||||
| Probable |
0 | | | | ||||||||||||
| Total: |
23,000 | 8.91 | 1.92 | 48 | ||||||||||||
| Catawba Farm Quarry Dolostone |
||||||||||||||||
| Proven |
1,600 | 18.3 | 1.16 | 30.8 | ||||||||||||
| Probable |
68 | 18.3 | 1.16 | 30.8 | ||||||||||||
| Total: |
1,700 | 18.3 | 1.16 | 30.8 | ||||||||||||
| Lone Star East Quarry Limestone |
||||||||||||||||
| Proven |
13,000 | 5.7 | 1.3 | 49.4 | ||||||||||||
| Probable |
4,100 | 7.6 | 1.2 | 47.9 | ||||||||||||
| Total: |
17,100 | 6.16 | 1.28 | 49 | ||||||||||||
| Lone Star East Quarry Dolostone |
||||||||||||||||
| Proven |
1,600 | 13.3 | 1.7 | 32 | ||||||||||||
| Probable |
0 | | | | ||||||||||||
| Total: |
1,600 | 13.3 | 1.7 | 32 | ||||||||||||
| High Grade Shale Quarry |
||||||||||||||||
| Proven |
12,000 | 19.7 | 4.4 | 38.7 | ||||||||||||
| Probable |
0 | | | | ||||||||||||
| Total: |
12,000 | 19.7 | 4.4 | 38.7 | ||||||||||||
| Roanoke Site Totals - Limestone |
||||||||||||||||
| Proven |
36,000 | 7.8 | 1.7 | 48.5 | ||||||||||||
| Probable |
4,100 | 7.6 | 1.2 | 47.9 | ||||||||||||
| Proven + Probable |
40,100 | 7.7 | 1.6 | 48.4 | ||||||||||||
| Roanoke Site Totals - Dolostone |
||||||||||||||||
| Proven |
3,200 | 15.8 | 1.4 | 31.4 | ||||||||||||
| Probable |
68 | 18.3 | 1.16 | 30.8 | ||||||||||||
| Proven + Probable |
3,268 | 15.9 | 1.4 | 31.4 | ||||||||||||
| Roanoke Site Totals - Shale |
||||||||||||||||
| Proven |
12,000 | 19.7 | 4.4 | 38.7 | ||||||||||||
| Probable |
0 | | | | ||||||||||||
| Proven + Probable |
12,000 | 19.7 | 4.4 | 38.7 | ||||||||||||
Notes:
| (1) | Mineral Resources Reasonable Prospects for Economic Extraction (RPEE) commodity price is based on a 2025 cement price of $136 per ton, Free on Board (FOB) the plant. |
| (2) | Limestone Mineral Reserves are stated on a Life of Mine basis. |
| (3) | Shale and dolostone Mineral Reserves represent the tons that will be consumed during the Life of Mine production schedule. |
| (4) | No cut-off grades are applied. |
40
| (5) | The point of reference for the Reserves is the raw material stack, located after the primary crusher and includes mining recovery of 95%. |
| (6) | Tons are rounded to nearest 1,000s, which could cause apparent summation errors. |
| (7) | Catawba Farm Extension dolostone Resource quantity based on production requirements. |
| (8) | Dolostone blocks of Indicated and Inferred Resources are interspersed within the deposit. It is not reasonable to report separate chemistry statistics for these categories. |
| 12.4 | OPINION OF THE QUALIFIED PERSON |
Given the extent of geologic information, mine planning activities, and operating history at the site, the QP is confident that Reserves can be extracted and processed at the quantity and quality required to meet the sites production schedule to produce Portland cement and construction aggregates.
As part of this study, an economic analysis that included Capex estimates for development, infrastructure relocations, fleet acquisitions, permitting needs, and plant upgrades was performed. Opex was obtained from the cost tracking performed by Titan over its 20 plus year history of operating the site.
The QP opines that the Reserve estimate has been developed following customary standards in the construction materials mining industry. The QP is of the opinion that all relevant technical and economic factors are not likely to be significantly influenced by further work and that any technical and economic issues are not material to the site.
41
| 13. | MINING METHODS |
The site consists of two developed open-pit mining areas (limestone and shale) and one planned limestone quarry in development. All mineral extraction is used for cement production; materials from the two active quarries are blended based on their chemical composition.
| 13.1 | GEOTECHNICAL AND HYDROLOGIC CONSIDERATIONS |
Titan has conducted two slope stability analysis studies and one hydrogeologic study for the site. The studies are discussed in Section 7. CPI determined that the slope stability safety factors for the High Grade Shale Quarry meet or exceed the generally accepted minimum safety factors using the design parameters shown in Table 13-1. KBJW determined that the slope stability safety factors for the Catawba Farm Quarry meet or exceed the generally accepted minimum safety factors using the design parameters shown in Table 13-2.
Table 13-1. High Grade Shale Quarry Design Parameters
| Parameter |
Criteria | |||
| Bench Height |
50 feet | |||
| Bench Face Angle |
65 75 degrees | |||
| Catch Bench Width |
25 feet | |||
| Haul Road Width |
60 feet | |||
| Overall Pit Slope |
46 degrees | |||
| Table 13-2. Catawba Farm Quarry Design Parameters |
|
|||
| Parameter |
Criteria | |||
| Bench Height |
50 feet | |||
| Bench Face Angle (Limestone or Shale) |
65 75 degrees | |||
| Bench Face Angle (Dolostone) |
55 degrees | |||
| Catch Bench Width |
25 feet | |||
| Haul Road Width |
60 feet | |||
| Max Haul Road Grade |
10% | |||
| Soft Overburden Slope |
3:1 | |||
| Overall Pit Slope (Limestone or Shale) |
61 degrees | |||
| Overall Pit Slope (Dolostone) |
49 degrees | |||
| 13.2 | MINE OPERATING PARAMETERS |
The site currently averages a production rate of 1.6 million t/a from the Lone Star East limestone quarry, and 0.4 million t/a from the High Grade Shale Quarry. Approximately 50,000 t/a of sandstone is sourced from the High Grade Shale Quarry to control alkali and silica in the raw mix. The Lone Star East Quarry is an irregular shape, approximately 3,700 ft long by 800 ft wide. The current quarry bottom elevation is 950 ft. The High Grade Shale Quarry is also an irregular shape, approximately 6,000 ft long by 600 ft wide. The future Catawba Farm Quarry is estimated to be approximately 4,100 ft long and approximately 1,500 ft wide with a bottom elevation of 850 ft.
42
At the current production rates, the Lone Star East Quarry and High Grade Shale Quarry can maintain production through 2027, with some limestone production supplemented from the Catawba Farm Quarry while it is in development. In 2028, the Lone Star East Quarry will begin to scale down limestone production to approximately one-third of current levels while primary limestone production shifts to the Catawba Farm Quarry. To achieve full production capacity, the Catawba Farm Quarry development is planned to begin in 2025 with proposed limestone production in 2027. Once full production capacity is achieved at the Catawba Farm Quarry, limestone can be extracted through 2051.
Initial overburden removal from the Catawba Farm Quarry will be used to create perimeter berms, sediment basins, and haul road fill. Any remaining overburden material will be placed into the stockpile dump. Through 2051, approximately 6,300,000 yd3 of overburden material will be stripped from the Catawba Farm Quarry with approximately 3,370,000 yd3 removed through 2032 as the quarry is developed and ramps up production.
Figure 13-1 shows final limits for the active and proposed quarries. The mine plan supporting Reserves estimates incorporates the Lone East, High Grade Shale, and Catawba Farm Quarries. Resource areas under evaluation for mine life extension include the Lone Star Extension and Catawba Farm Extension areas. The Lone Star West Quarry is effectively mined out. The aggregates area is under evaluation.
43
Figure 13-1. Final Quarry Limit.
44
Figure 13-2 shows the mine plan production quantities from each of the quarries. The 2024 mine plan shows there is sufficient limestone in the Catawba Farm Quarry and Lone Star East Quarries to support kiln feed through the year 2051, assuming limestone production of approximately 1.425 million t/a. It should be noted that 2024 production represents the remainder of the years production after the effective date of the TRS. The following Mining Schedule details the transition from mining the Lone Star East Quarry to the new Catawba Farm Quarry. For additional information on future production, see section 19.1.3.
Figure 13-2. Annual Mine Production Schedule.
| 13.3 | MINING OPERATIONS |
The Lone Star East and High Grade Shale Quarries are developed with a series of benches oriented perpendicular to the strike of the bedding planes. The waste removal process starts with land clearing and stripping of the overburden material. Stripping activities are completed by contractors who free-dig the waste material. If rocks are encountered, drilling and blasting may be used. Operators maintain approximately 160,000-tons across three working faces to blend material and achieve chemistry targets for the raw mix.
The drilling and blasting operations are currently performed by contractors. Site personnel load and haul the material to the stockpiles adjacent to the primary crusher. A front-end loader works the various stockpiles near the primary crusher to manage the blend of the raw mix stockpiles being built. The loader operator manages material quality from the stockpiles using real-time data from a cross-belt analyzer.
45
| 13.4 | MINE PLANT, EQUIPMENT AND PERSONNEL |
The mobile fleet consists of five Caterpillar 777 100-ton haul trucks, three Caterpillar 992 16-yd3 front-end loaders, and one Caterpillar 349F excavator. Ancillary mobile equipment includes one Caterpillar 336 excavator used for rock breaking, one Caterpillar 773D water truck, one Caterpillar 140M grader, one Komatsu 375 dozer, and one Volvo A25D water truck. All the mining equipment is owned, except for a leased grader. Contractors have additional equipment for overburden removal and drilling and blasting operations. Equipment necessary for supporting mining operations includes various utility vehicles and dewatering pumps.
The quarries operate year-round, five days per week with two 10-hour shifts per day. Operating personnel for the quarries consist of 4 salaried employees and 15 hourly employees. 22 contract personnel work to complete stripping, drilling, blasting, and heavy mobile equipment maintenance activities for the quarries.
46
| 14. | PROCESSING AND RECOVERY METHODS |
| 14.1 | PROCESS PLANT DESCRIPTION |
The material process for the cement operation is illustrated in Figure 14-1. The cement plant comprises three main plant sections: the clinker plant, the grinding plant, and the packhouse.
Figure 14-1. Cement Plant Process.
The plant components are typical of a dry process cement plant. The clinker section includes material blending two vertical roller raw mills, a six-stage preheater tower, a calciner, a rotary kiln, and clinker cooling and storage. Cement grinding includes material handling for additional additives, two finish mills, and product silos. The overall process flow of the cement plant is presented in Figure 14-2.
47
Figure 14-2. Flowsheet of the Roanoke Cement Plant.
48
| 14.2 | PLANT THROUGHPUT AND DESIGN |
The kiln is the limiting process at the cement plant, based on the Title V Prevention of Significant Deterioration permit, which limits clinker production to 184 t/h for a maximum of 1,300,000 t/a.
Figure 14-3 illustrates the annualized mass flows for each process stage and end products, including the percent recovery. The cement plant recovery is 100%.
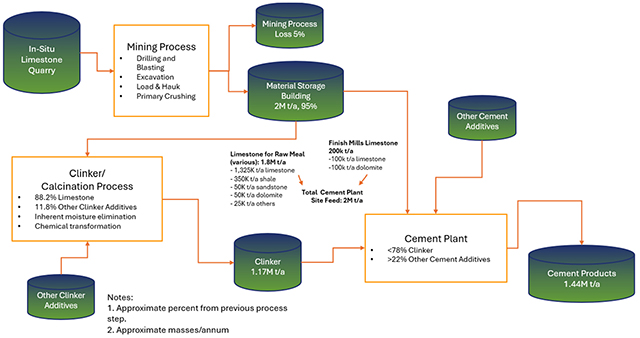
Figure 14-3. Pit to Product Mass Balance.
| 14.3 | PLANT OPERATIONAL REQUIREMENTS |
| 14.3.1 | ENERGY |
The 3-year average (2021-2023) annual electrical energy consumption at the site is 177 million kilowatt-hours (kWh). Electrical supply to the site is provided by APC (69 kV).
The plant relies on multiple sources of energy. The fuel for firing the kiln can be 100 percent natural gas, which is supplied by RGC. The use of natural gas is supplemented by coal and AF.
The total fuel consumption for cement operation is 4.2 million British thermal units (BTUs) per ton of clinker. The 3-year average (2021-2023) consumption for different fuel types includes:
| | Natural Gas: 964 MMCF (2022-2023 average) |
| | Coal: 90,000 ton |
| | AF: 3,272 tons |
| 14.3.2 | WATER |
Rainwater is captured for beneficial use in plant and mine operations and can be supplemented by ground water accumulating in the mine excavations if needed. The 3-year average (2021-2023) annual consumption at the site is 66 million gallons.
| 14.3.3 | PROCESS MATERIALS |
Process materials consist primarily of the raw materials mined in quarry operations.
| 14.3.4 | PERSONNEL |
The plant personnel include 73 hourly Titan employees. The major work performed includes electrical and mechanical repair, process, production, operation, packhouse utility, and control room operator.
| 14.4 | APPLICATION OF NOVEL OR UNPROVEN TECHNOLOGY |
None of the processing at the site is considered novel or unproven. The cement manufacturing plant is based on designs typical for the industry and has been operating successfully for decades at this site.
49
| 15. | INFRASTRUCTURE |
Figure 15-1 shows a plan view map of the operation and major infrastructure features. Plant area infrastructure detail is shown in Figure 15-2.
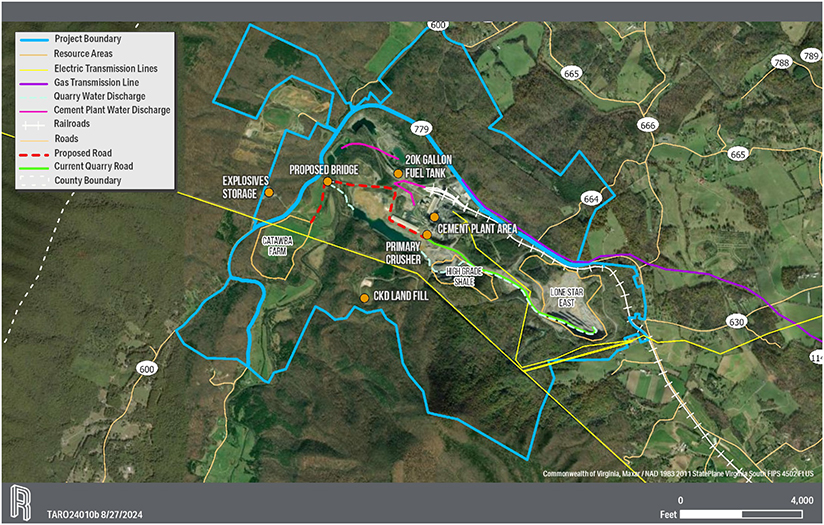
Figure 15-1. Site Infrastructure Features.
50
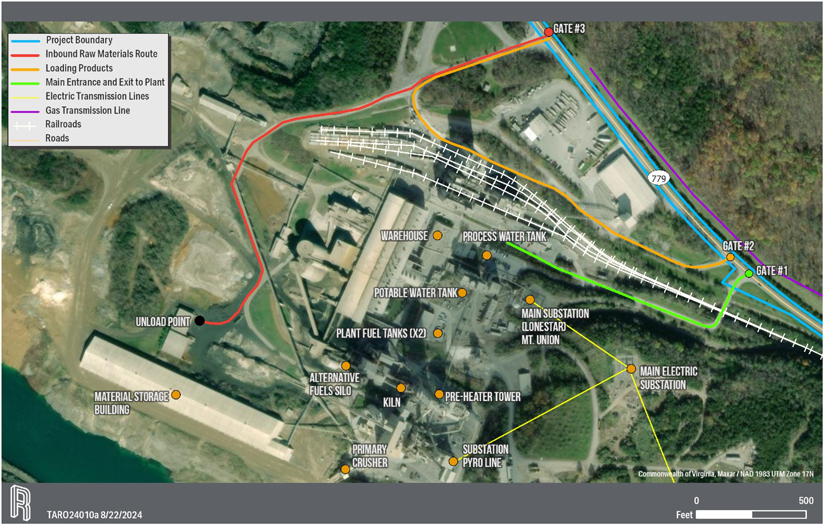
Figure 15-2. Plant Area Infrastructure.
51
| 15.1 | ACCESS ROAD AND RAIL |
The main route to the site is Catawba Road (State Route 779), a two-lane state highway that provides direct access at three designated points of entry: Gate 1, Gate 2, and Gate 3 (see Figure 15-1). Catawba Road connects to US Route 220 (US 220) in Daleville. US 220 connects with US Interstate 81 a mile and a half from its intersection with Catawba Road.
The site has over 16,000 feet of rail track, which is serviced by Norfolk Southern. The rail infrastructure allows for both inbound and outbound transportation of supplies and cement products.
| 15.2 | WAREHOUSES AND MAINTENANCE FACILITIES |
The maintenance facilities include three shops, 10 tool storage facilities, and a storeroom. The three shop areas are dedicated to electrical, machine/mechanical, and mobile equipment. The storeroom facility is central to warehousing operations. It stocks standard and specialized components and is climate-controlled and secure.
| 15.3 | NATURAL GAS |
RGC is the public natural gas utility that services the site. RGCs distribution system is fed by Columbia Gas Transmission (interstate gas producer) at a gate station in Eagle Rock, Virginia, at a design flowrate of five hundred dekatherms per hour. The site also includes redundant runs of piping and equipment in the case of maintenance or a malfunction. The piping owned by Titan runs from the RGC regulator station and runs underground to the kiln and calciner gas racks.
| 15.4 | ELECTRIC POWER |
Electrical power is provided to the site by APC. Two 138 kV circuits, running in a redundant loop, feed the site. The 138 kV circuits terminate at the Lone Star Mount Union 69 kV substation. The total plant monthly peak capacity is 25.5 MW, and energy consumption is approximately 15,500 MWh monthly.
| 15.5 | FUEL STORAGE |
The quarry has a 20,000-gallon diesel fuel tank for its mobile equipment located near the equipment ready line. In addition, close to the maintenance shop, there is one 1,000-gallon diesel tank and one 1,000-gallon gasoline tank.
| 15.6 | EXPLOSIVES STORAGE |
Explosives are stored on site in a magazine area of approximately 7.36 acres. The storage area contains four vertical bins to load blasting emulsion into blasting trucks. The electronic blasting caps and boosters are stored on site in Type 2 magazines according to Bureau of Alcohol, Tobacco, Firearms, and Explosives (ATF) regulations and requirements.
| 15.7 | WATER SUPPLY |
The potable water system consists of a drilled well and a 25,000-gallon steel storage tank. The 125-foot well has a 6-inch casing grouted to a depth of 56 feet. A submersible pump powered by a 3-hp electric motor discharges water from the well to the storage tank through a 4-inch line. The well pump is controlled manually and runs continuously. Additionally, rainwater is captured for beneficial use in plant and mine operations and can be supplemented by ground water that accumulates in the mine excavations.
52
| 15.8 | ALTERNATIVE FUELS |
The kiln and calciner consume AF, which include shredded tires, wood chips, and sawdust. The site system includes a receiving hopper, a silo, and a network of screw conveyors. The materials are fed by screw conveyors into the calciner. The AF feed system was refurbished in 2022. The TDF feeder system has 75k cubic feet of bin capacity and is equipped with safety features such as temperature monitoring systems. The capacity of the AF feeding system is rated at 6.5 t/h.
| 15.9 | MINE AND PLANT WASTE |
The site has multiple permitted facilities to manage overburden and waste rock which are governed by the state Department of Mines, Minerals and Energy (DMME). The location of these facilities are shown in a figure in section 17. Permitted waste rock facilities are adequate to support the current mine plan.
The only byproduct from the cement manufacturing process is cement kiln dust (CKD) which can be reintroduced into the cement manufacturing process. In the event of a mechanical failure of the transfer system, this material is stored on site in the active waste disposal facility. This active landfill, a Class-2 solid waste disposal unit, was permitted by the Virginia Department of Environmental Quality (VDEQ) in 1988. The storage capacity of the active landfill is adequate to support LOM. The inactive landfill was used during wet kiln operations and removed from service in 1988.
53
| 16. | MARKET STUDIES |
| 16.1 | MARKETS |
| 16.1.1 | INTRODUCTION |
Titan mines limestone, dolostone and shale for use in the manufacturing of a variety of cement. The cement serves as the primary bonding agent in the production of ready-mixed concrete, precast concrete, masonry blocks, concrete siding, and mortar for bonding concrete blocks, stone, and brick. Titans cement production primarily serves the Virginia and North Carolina markets.
The information presented in this section is based on data from industry organizations and federal, state, and local sources.
| | The Portland Cement Association |
| | United States Geological Survey (USGS) |
| | 2024 North American Cement Directory |
| | Sage Economics Newsletters |
| | Datamyne (https://www.datamyne.com) import data |
| 16.1.2 | MARKET REVIEW CONCLUSIONS |
The demand for cement is expected to remain high in North Carolina and Virginia because of substantial infrastructure investments and economic growth. The Infrastructure Investment and Jobs Act funds various construction projects, including roads, bridges, and public transit systems. Additionally, the rapid urbanization and expansion of residential, commercial, and industrial sectors in these states further drive the need for cement.
| 16.1.3 | COMPETITOR ANALYSIS (COMPETITIVE LANDSCAPE) |
Virginias cement market is served by three key suppliers.
| | Titan. Operates the only cement plant in Virginia and distributes its products through three rail terminals in Virginia and four in North Carolina. |
| | Heidelberg Materials. Operates a 2.3-2.4 million ton cement plant in Union Bridge, Maryland, and supplies Virginia through terminals in Richmond, Hampton Roads, and a rail terminal in Durham, North Carolina. |
| | Summit Materials (Argos). Operates a 2 million ton cement plant in Martinsburg, West Virginia, and distributes through terminals in Ashland and the Hampton Roads area of Virginia. |
| 16.2 | KEY DRIVERS AND TRENDS AFFECTING THE MARKET |
There are several key drivers for the demand of Titans products in the Virginia and North Carolina markets. The demand for cement is driven by economic growth and infrastructure development. A strong economy has led to increased investments in both residential and commercial real estate. As more people move to urban areas, the demand for housing, office spaces, and retail establishments continues to rise, directly boosting the need for cement.
54
| 16.3 | GEOGRAPHIC MARKETS |
| 16.3.1 | VIRGINIA |
Virginias cement demand is expected to remain stable over the next four years at an average annual growth rate of 1.7 percent (PCA, 2024). Within Virginia, the primary markets driving cement demand are the major MSAs of Northern Virginia, Richmond, and Hampton Roads. Northern Virginia, part of the Washington, D.C. metropolitan area, is a hub of economic activity with significant investments in residential and commercial real estate driven by the regions growing population (Figure 16-1) and expanding technology and data industries. Infrastructure projects, such as the Silver Line Metro extension and numerous highway expansions, contribute substantially to cement demand. Hampton Roads is a large metropolitan area and has the largest naval facility in the US, both of which require significant infrastructure expansion. Examples of projects include Hampton Roads Bridge-Tunnel expansion and improvements to the I-81 corridor, as well as other infrastructure projects related to transit, roads, bridges, and tunnels. In addition, Richmonds urban revitalization projects, industrial growth, and efforts to expand transportation networks also require large volumes of cement.
55
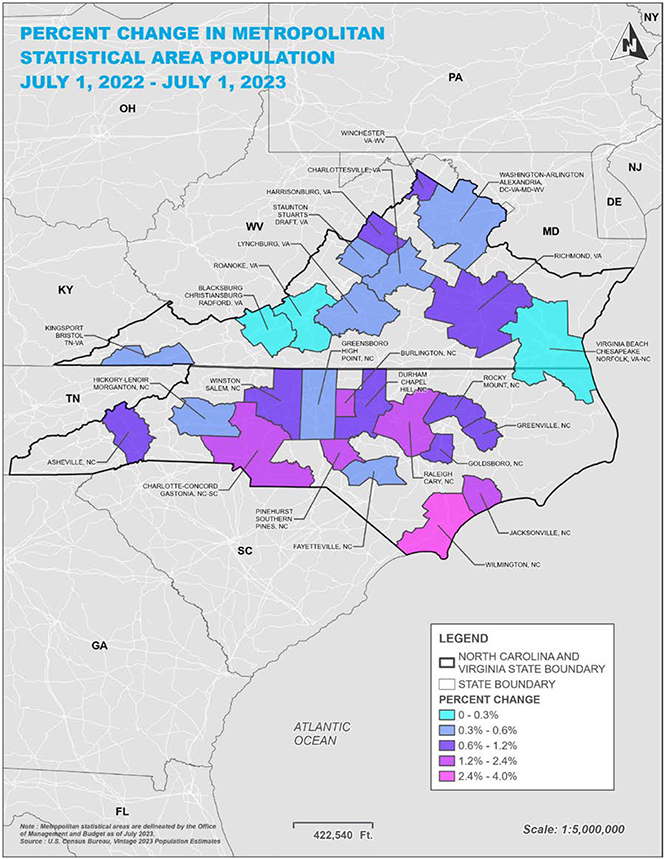
Figure 16-1. Virginia/North Carolina MSA Population Growth.
56
| 16.3.2 | NORTH CAROLINA |
North Carolinas cement demand is expected to grow at an average annual rate of 2.4 percent (PCA, 2024). This growth is generally attributed to residential and infrastructure projects, while there are three key MSAs influencing cement demand- the Research Triangle, Charlotte, and the Piedmont Triad. The Research Triangle are the cities of Raleigh, Durham, and Chapel Hill and is known for its technology and research sectors. Charlotte is the fifteenth largest city in the US and second largest financial center in the US (Roberts, 2018), and experiences development in commercial real estate, residential projects, and infrastructure improvements, such as the expansion of the Charlotte Douglas International Airport. The Piedmont Triad, which includes Greensboro, Winston-Salem, and High Point, also contributes to cement demand through industrial growth and ongoing infrastructure projects aimed at improving transportation and logistics capabilities within the region.
North Carolinas commitment to improving its transportation network is a significant growth driver for cement consumption. Major projects such as the expansion of the I-77 toll lanes, the development of the Southeast High-Speed Rail Corridor, and numerous airport upgrades require substantial quantities of cement. These infrastructure investments are crucial for enhancing connectivity, reducing congestion, and supporting economic growth.
| 16.4 | SALES AND DISTRIBUTION CHANNELS |
Bulk cement is distributed from the site by truck and rail. Approximately 55 percent of the cement sold is distributed via truck, with the remaining 45 percent distributed via rail through seven rail terminals that Titan owns or operates.
Titans rail-distribution network is served by Class 1 and Class 2 rail carriers in Virginia and North Carolina (Figure 16-2).
Titans trucking capabilities provide flexible and responsive delivery options for customers. Truck deliveries are made to fixed ready-mix plants, portable ready-mixed concrete plants, full depth reclamation road projects, and soil stabilization projects.
Cement sales are FOB terminal or plant. Customers pick up bulk cement by truck. Package cement sales occur through retail channels.
57
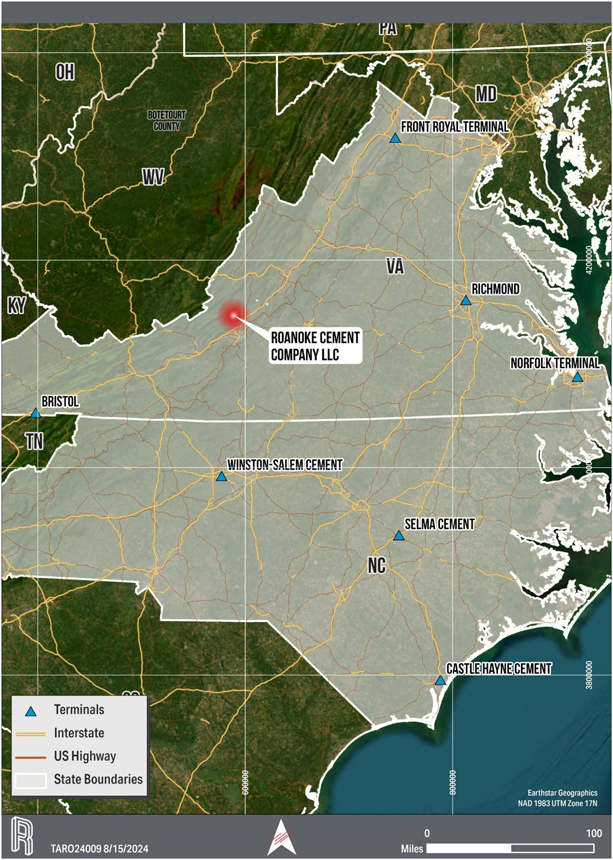
Figure 16-2. Titan Distribution Network.
58
| 16.5 | COMMODITY PRICES |
The price forecast for cement over the next 5 years is anticipated to show a moderate upward trend.
National figures to define the cement market are published annually by the USGS. The most recent Mineral Commodity Summary for cement was published in January 2024. The report includes annual data on cement price. The most recent figure is $150 per tonne, or $136.08 per ton. As the cement price data is estimated, the 2023 value is used for the 2025 cement price for this study is $136 per ton.
Cost inputs such as raw materials, energy, and transportation impact cement pricing. Figure 16-3 shows the price index of cement and concrete products nationally.
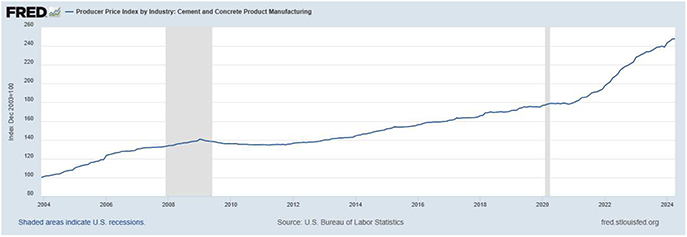
Figure 16-3. PPI for Cement and Concrete Product Manufacturing (U.S. Bureau of Labor Statistics, 2024).
| 16.6 | PRODUCTS |
| 16.6.1 | CEMENT |
Titan produces Portland limestone cement (Type IL), Type III cement, masonry cements, and a specialty cement designed for one customer. The largest portion of the plants production is Type IL, a blended cement with up to 15 percent limestone addition, which is a product that has a lower carbon dioxide contribution per ton compared to Type I/II.
| 16.6.2 | BULK |
The majority of cement sales from Roanoke are bulk. Bulk cement sales are transported in tankers, outbound pressure differential rail cars, and gravity rail cars. Typically, less than 10 percent of the bulk products produced at the cement plant are sold to internal outlets. External customers have long-term buying patterns.
| 16.6.3 | PACKAGE |
Packaged cement sales of Type IL and masonry cements are sold in 94-pound bags for Type IL and 80-pound bags for masonry. These are palletized and delivered on flatbed trucks. These bags are sold to brick yards, concrete block plants, lumber yards as well as retail outlets like Home Depot and Lowes.
| 16.7 | MATERIAL CONTRACTS |
Roanoke does not have any material contracts with respect to the mining and processing of limestone and shale. Roanoke does engage with third-party contractors to perform certain services for the mining operations. Titan has one long-term supply contract with James Hardie Industries since 2006.
59
| 17. | ENVIRONMENTAL STUDIES, PERMITTING AND PLANS, NEGOTIATIONS, OR AGREEMENTS WITH LOCAL INDIVIDUALS OR GROUPS |
| 17.1 | ENVIRONMENTAL STUDIES AND PERMITTING REQUIREMENTS |
| 17.1.1 | ENVIRONMENTAL STUDIES |
Many studies were completed as part of permitting efforts for the existing site including the Lone Star East Quarry.
Titan has completed the following environmental and technical studies for permitting efforts for the proposed Catawba Farm Quarry project:
| | Archaeological Study (Cultural Resources). James River Institute for Archaeology, Inc. (JRIA) completed an initial Archaeological Survey of approximately 79.2 acres of the proposed Catawba Farm Quarry in early 2023. An additional 40 acres surrounding the original area was investigated in December 2023. In total from the two surveys, JRIA identified and documented one architectural resource, five architectural sites, and eleven isolated finds within the proposed Catawba Farm Quarry project area. JRIA recommended that none of the archaeological sites nor the architectural resources are eligible for listing in the National Register of Historic Places (National Register) and no further investigation was recommended. The recommendation has been included in the permit modification application. |
| | Hydrology and Drainage Studies. A floodplain study was conducted for the Catawba Farm Quarry project. A proposed haul bridge will connect the proposed Catawba Farm Quarry with the existing cement plant site will span the floodplain of Catawba Creek, which is, classified as Flood Zone A. A floodplain model was generated to determine potential impacts of the preliminary haul bridge design to the 100-year flood surface water elevation. During the site plan approval process, Botetourt County will review the bridge design to determine if permitting is required. |
| | Hydrogeological Study. The Catawba Farms Quarry regional hydrogeological study was conducted from 2022-2023 and updated in 2024 to estimate the potential effects dewatering activities may have on the underlying aquifer and on neighboring water supply wells. Hydraulic conductivity, storativity, and transmissivity were derived from both aquifer tests and slug-and-pump tests were used to develop a modeled cone of depression. The model estimated groundwater inflow into the proposed pit at approximately 250 gallons per minute. The groundwater drawdown model estimated the cone of depression with a radius of approximately 1,200 feet from the pit edge. The groundwater model estimated leakage from Catawba Creek, which was calculated to be approximately 0.6 percent of the average streamflow. |
| | Wetlands Studies. Wetland delineations have been completed. A request for a Preliminary Jurisdictional Determination (PJD) was filed with the United States Army Corps of Engineers (USACE) in February of 2024. The wetlands and stream delineation studies indicate that development of the proposed Catawba Farm Quarry will cause unavoidable impacts to federally and state protected surface waters, including wetlands. Verification of the PJD is likely to occur with the issuance of the Individual 404 Dredge and Fill permit for the proposed Catawba Farm Quarry project. |
60
| 17.1.2 | ENDANGERED AND THREATENED SPECIES STUDY |
Catawba Creek has also been designated by the Virginia Department of Wildlife Resources (VDWR) as a Threatened and Endangered Species Water for the James spiny mussel. On April 20, 2024, biologists with Daguna Consulting, LLC conducted a survey across a study area of Catawba Creek extending from approximately 2,600 feet downstream to 660 feet upstream of the proposed haul bridge. The survey did not detect live mussels or recent shell material.
| 17.1.3 | PERMITTING REQUIREMENTS. |
Titan has secured permits, authorizations, and entitlements from regulatory agencies at multiple levels for the existing operation. The proposed Catawba Farm Quarry project will require modification of existing permits and require new permits.
Key permits that apply to the site and their status are listed in Table 17-1. Permitting is in progress, and it is reasonable to anticipate all permits can be acquired. The development of the Catawba Farm Quarry is scheduled for 2025.
61
Table 17-1. Permit Regime
| Existing Site |
Proposed Catawba Farm |
|||||
| Reviewed and Issued By: |
Permit Name |
Permit Status |
Permit Status |
|||
| Building Development Services |
Site Plan Review | Authorized work completed | Submitted June 2024 | |||
| Building Permit Review | Authorized work completed | Anticipated to follow Site plan review | ||||
| Department of Environmental Quality (DEQ) |
Individual Virginia Pollutant Discharge Elimination System Permit
|
Current coverage; no modification needed | n/a | |||
| General Permit for Nonmetallic Mineral Mining (VAG84)
|
n/a | Submitted May 2024 | ||||
| Individual Water Protection Permit (VWP Permit) | Authorized work completed; modification submitted May 2024
|
Submitted May 2024 | ||||
| Solid Waste Facility Permit | Current coverage; no modification needed | n/a; no modification needed to current coverage
|
||||
| Title V Federal Operating Permit | Current coverage; no modification needed | n/a; no modification needed to current coverage
|
||||
| Prevention of Significant Deterioration Permit (PSD) | Current coverage; no modification needed | n/a; no modification needed to current coverage |
||||
| Department of Health | Waterworks Operation Permit | Current coverage; no modification needed | n/a; no modification needed to current coverage | |||
| Virginia Marine Resources Commission (VMRC) | Subaqueous Permit | n/a | Submitted May 2024 #23-1360 | |||
| Department of Energy | Mining Permit | Current coverage | Current mine permit modification required; Submitted June 2024 | |||
| Western Virginia Water Authority | Industrial Use Permit | Current coverage; annual renewal upcoming in 2025 | n/a; no modification needed to current coverage | |||
| Department of Transportation | Land Use Permit | Authorized work completed | Submitted July 2024 | |||
| United States Army Corps of Engineers (USACE) | Individual 404 Dredge and Fill Permit | Authorized work completed; modification submitted May 2024 | Submitted May 2024 | |||
| United States Fish and Wildlife Service (USFWS) | Consultation regarding Endangered Species | Completed concurrent with USACE Permit process | Occurs concurrently with USACE Permit process | |||
62
| 17.2 | WASTE DISPOSAL, SITE MONITORING AND WATER MANAGEMENT |
| 17.2.1 | MINE WASTE |
The site has eight locations for overburden and waste rock storage, which are governed by the state DMME. The locations are shown in Figure 17-1.
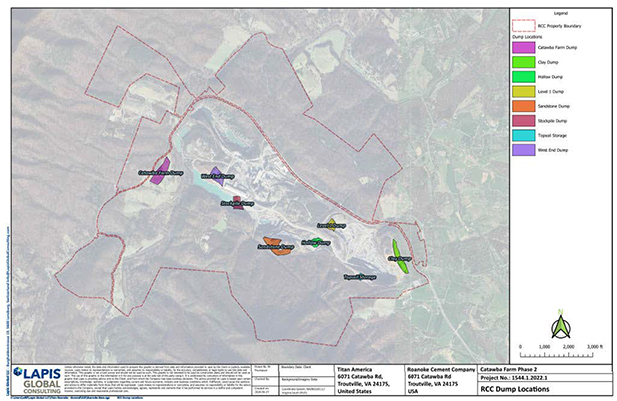
Figure 17-1. Mine Waste Location.
| 17.2.2 | PLANT WASTE |
The only byproduct from the cement manufacturing process is CKD, which is stored on site in two locations. The inactive waste facility was used before 1988 during the operation of the wet kilns. In 1988, a Class-2 solid waste disposal unit was permitted by VDEQ and is currently in use. The locations of the two solid waste disposal locations are provided in Figure 17-2.
63
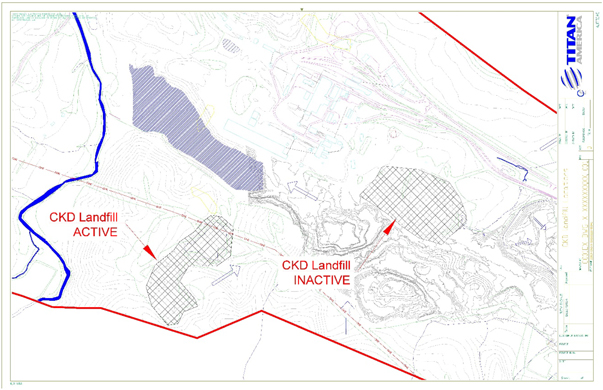
Figure 17-2. CKD Landfill Locations.
| 17.2.3 | WATER MANAGEMENT |
The site has three water streams: storm water, process water, and ground water, excluding the sanitary flows.
| 17.2.3.1 | STORMWATER |
There are four main stormwater drainage basins on the site, all with multiple Virginia Pollutant Discharge Elimination System approved outfalls. Six new outfalls are proposed for the Catawba Farm Quarry project under VDEQs General Permit for Nonmetallic Mineral Mining (VAG84), and the registration for coverage was submitted in May 2024.
| 17.2.3.2 | PROCESS WATER |
The process water is defined as any water used for mechanical cooling, which comes in contact with raw materials, or may require treatment before discharge. These waters flow to Ponds 1, 2, or 3, and are either discharged or reintroduced as process water to the plant. Water infrastructure exists to store, convey, and manage this flow.
| 17.2.3.3 | GROUNDWATER |
Mining activities extract material below the water table, resulting in groundwater infiltration through the floors and walls of the pits. This water is collected and discharged through the mine dewatering system, which results in the commingling with stormwater in the three ponds previously described.
64
| 17.3 | POST-MINING LAND USE AND RECLAMATION |
The existing operation will be reclaimed in accordance with the DMME permit (No.05791AE). Reclamation activities include structure removal, earthwork, establishing surface water drainage, and revegetation. To date, two legacy overburden storage sites have been reclaimed., Appalachian Technical Services Inc. (ATS) completed a Reclamation Cost Estimate of the existing operation in February 2024. Figure 17-3 shows the reclamation plan for the current operation. The mine closure costs are estimated at $18.5 million dollars. The costs are reviewed and updated on an annual basis by Titan. For accounting purposes, the costs are accrued on a percent completion basis and are subject to depreciation.
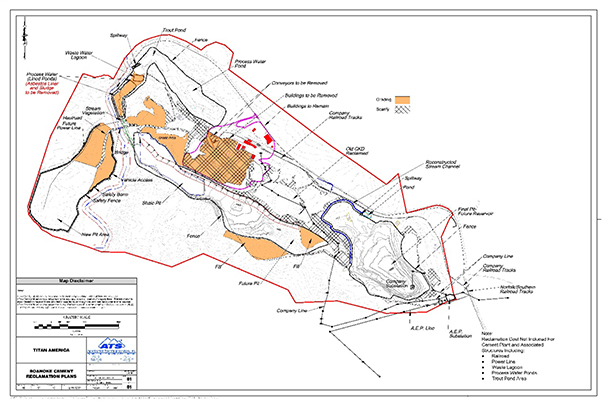
Figure 17-3. Reclamation Plan Highlighting Earthwork.
| 17.4 | LOCAL OR COMMUNITY ENGAGEMENT AND AGREEMENTS |
A local public relations firm, PLUS Communications, was engaged to advise and coordinate outreach to NGOs and stakeholders that might have an interest in the existing facility and proposed Catawba Farm Quarry project. A community engagement team was developed to meet with NGOs and stakeholders to increase awareness about the site. The team developed an engagement toolkit to include presentations, an economic impact study, viewshed analysis, Q&A fact sheets, a project website (https://roanokequarryproject.com/), and a crisis communications task force.
65
| 17.5 | OPINION OF THE QUALIFIED PERSON |
The QP opines that the current plans are sufficient to address any issues related to environmental compliance and permitting. The QP also opines that all necessary permits are obtainable.
66
| 18. | CAPITAL AND OPERATING COSTS |
| 18.1 | SUMMARY AND ASSUMPTIONS |
Capital and operating costs are primarily estimated using a combination of equipment quotes from recent projects and vendor quotes for mobile equipment, and based on recent experience with similar projects. These estimates include annual inflation based on the Consumer Price Index projections. Opex estimates are to a +/- 10% accuracy. Capex estimates are to a +/- 20% accuracy.
| 18.2 | MINING CAPITAL SUMMARY |
| 18.2.1 | STRIPPING |
Overburden removal at the quarry is completed as part of the operational cost and reclassified on a yearly basis to capital cost.
Each year, as part of the mine planning and budgeting process, the operation will determine the total volume of overburden that needs to be removed. The unit cost for budgeting is based on the previous years actualized cost for blasting and excavation, with escalation for changes in scope or dump destination. The volume is based on the internal requirements to always maintain a minimum of one year of uncovered Reserves.
The capitalized stripping costs are expenditures incurred over the life of the mine to remove overburden or waste materials, enabling access to Reserves. The projected stripping costs for both the new Catawba Farm Quarry and the existing Lone Star East Quarry over the LOM are $82.5 million in 2024 dollars. After adjusting for the Consumer Price Index inflation projection, the total cost is $101 million.
Since 2015, all overburden removal has been contracted to a third-party. This lowers the total cost and increases efficiency, as the crew and equipment fleet can be tailored to the amount of material planned to be moved each year.
In addition to the projected stripping costs, there are current stripping costs that have been capitalized and not yet expensed. The dollar value to be expensed is projected to be $3.98 million at the end of 2024.
| 18.2.2 | CATAWBA FARM DEVELOPMENT |
The Catawba Farm site has been in capital development since 2021, with the completion of a scoping study, a prefeasibility study, and the ongoing permit and engineering phases. During each of these phases, the scope of the project has been refined and major portions of the work have gone through the procurement process. The capital cost estimate provided in Table 18-1 includes a contingency of 15 percent.
The scope of the construction phase can be categorized by the following line items.
| | Initial Site Preparation: land clearing, erosion and sediment control, and construction entrance. |
| | Environmental Mitigation: purchase of stream and wetlands credits. |
| | Infrastructure Relocation: relocation and construction of public hiking trail. |
| | Haul Road Construction: 157-foot concrete bridge, 6,000 linear feet of dirt road. |
| | Quarry Development: overburden removal, ramp construction, pit dewatering. |
67
Table 18-1. Catawba Farm Development
| Item |
Amount ($) | |||
| Infrastructure |
$ | 6,322,850 | ||
| Environmental |
$ | 1,660,489 | ||
| Initial mine development |
$ | 4,300,000 | ||
| Other |
$ | 550,000 | ||
| Subtotal |
$ | 12,833,339 | ||
| Contingency @ 15% |
$ | 1,925,001 | ||
|
|
|
|||
| Total Capital Cost |
$ | 14,758,340 | ||
|
|
|
|||
The projected Catawba Farm Development cost is $14.8 million in 2024 dollars. After adjusting for the Consumer Price Index inflation projection, the total cost will be $16.7 million.
In addition to the projected capital costs, there are current costs that have been capitalized, including the prefeasibility study, drilling, testing, and permitting. The current amount is projected to be $0.98 million at the end of 2024.
| 18.2.3 | SUSTAINING CAPITAL |
Sustaining capital encompasses all projected investments required to maintain current operations and the specified growth investments of the mining operation over the projected LOM. These projections are derived from historical investment data, as well as current and past quotes for refurbishing or acquiring equipment.
The sustaining capital cost figure includes the refurbishment and replacement of mobile equipment. The projected sustaining capital cost will be $90.8 million in 2024 dollars. After adjusting for the Consumer Price Index inflation projection, the total cost will be $127.5 million.
In addition to the projected sustaining capital costs, there are current costs that have been capitalized. The current amount is projected to be $3.91 million at the end of 2024.
| 18.2.4 | SUMMARY |
Based on the timing of the projected capital projects the annual Capex is indicated in Figure 18-1. The figure also indicates the annual depreciation for both existing and projected Capex.
68
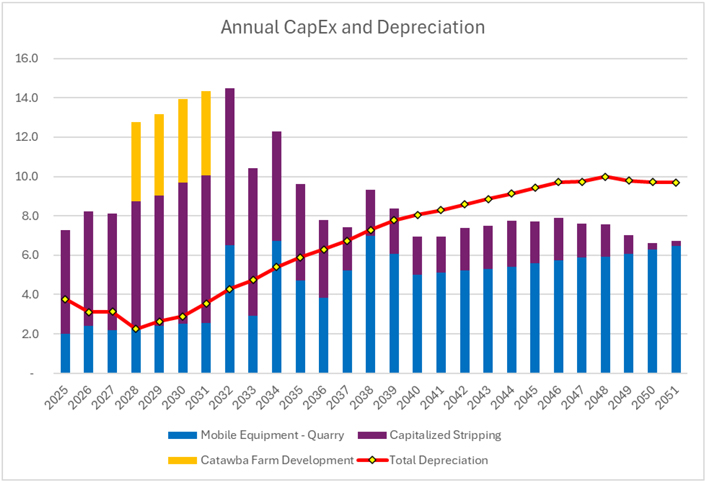
Figure 18-1. Annual Capital Expenditures.
| 18.3 | CEMENT PROCESSING CAPITAL COSTS |
The cement processing capital investment over the evaluation period is estimated at $354 million, including growth projects of $1.6 million. In addition, there is existing capital of $54 million to be depreciated over the next 20 years. These estimates include an inflation based on Consumer Price Index projections and a 10 percent contingency.
| 18.4 | OPERATING COST ESTIMATE |
| 18.4.1 | INTRODUCTION AND ESTIMATE RESULTS |
The ongoing operating cost estimate was developed using historical trends and detailed projections based on general economic indices and external forecasts for specific commodities and Resources used in cement production.
Operating costs are presented in 2024 US dollars on a calendar year basis. In addition, Figure 18-1 presents these costs broken down by category.
| 18.4.2 | PRODUCTION |
The projected production from the quarry as delivered to the primary crusher or the cement mills is projected to be approximately:
| | Raw Mill |
| Limestone Shale Sandstone |
1,325 thousand t/a 350 thousand t/a 50 thousand t/a |
69
| Dolostone |
50 thousand t/a |
|
| Other |
25 thousand t/a |
| | Cement Mill |
| Limestone |
100 thousand t/a |
|
| Dolostone |
100 thousand t/a |
Actual tonnages vary because of the chemistry of the mined materials.
In addition to the materials delivered to the primary crusher, there is the associated stripping of overburden. These costs are capitalized as discussed in Section 20.
| 18.4.3 | COSTS |
Depreciation is calculated based on the following depreciation schedules:
| | Stripping is depreciated over 15 years or the remaining LOM, whichever is shorter. |
| | Catawba Farm development is based on the life of the Catawba Farm Quarry, which is 21 years, with the initial depreciation starting in 2028 when the access bridge is completed. |
| | Sustaining Capex is depreciated over the life of the individual items of equipment. |
The mining and cement processing operating costs (Mining Costs, Processing Costs respectively) over the 27 year life of mine (LOM) are indicated in Table 18-2. The mining costs are estimated on the basis of tons delivered to the primary crusher.
Table 18-2. Summary of Mining and Cement Processing Operating Costs over the LOM.
| Operating Costs |
$ Million Projected |
|||
| Mining Costs |
$ | 643 | ||
| Processing Costs |
$ | 3,791 | ||
| Total Costs |
$ | 4,433 | ||
Eighty percent of the mining costs are for blasting, repairs, labor, and fuel.
In addition, the total mining cost includes:
| | Depreciation for the Catawba Farm Development |
| | Depreciation for the Sustaining Mining costs |
| | Depletion of the Reserve at $0.25 per ton |
| | Amortization of the capitalized stripping cost |
| | Allocation of SG&A |
The processing costs include:
| | Grinding, preheating and calcination |
| | Kiln, grinding and storage |
| | Allocation of SG&A |
70
18.4.4 MINING OPERATING COST SUMMARY
After adjusting for inflation and unit costs, the projected total mining cost is $5.87 per ton in 2025. This increases during the evaluation period to reflect changes in depreciation, and changes to the Consumer Price Index adjustment. The mining cost does not include any contingency and will be addressed though the sensitivity analysis.
71
| 19. | ECONOMIC ANALYSIS |
| 19.1 | KEY PARAMETERS AND ASSUMPTIONS |
| 19.1.1 | DISCOUNT RATES |
The discount rate used for the economic analysis is 9.6 percent. This rate reflects the cost of capital, accounting for the time value of money and the risk associated with the cash flows.
| 19.1.2 | COMMODITY PRICES |
The commodity prices used in the economic evaluation are determined using a blend of current market prices and long-term forecasts from both internal and external sources.
| | Bulk Cement Pricing. Bulk base cement pricing (for 2025) is set at $136.00 per ton. This price is derived from the USGS annual report (as detailed in Section 16) at the cement plant net of freight and distribution expenses. Escalations in price were added based on the Standard and Poors (S&P) Global 10-year price forecast for cement sales through 2034 and the 2024-to-2034 average rate for the remainder of the evaluation period. |
| | Natural Gas. RCCs current average price of natural gas is $3.61 per million BTU. Escalation for LOM was based on the Energy Information Administrations (EIAs) Short-Term Energy Outlook through 2025 and the Long-Term Outlook for 2026 2050. |
| | Coal. RCCs current average coal price delivered is $126.84 per ton. Escalation for LOM was based on EIAs Stort Term Energy Outlook through 2025 and the Long-Term Outlook for 2026 2050. |
| | AFs. RCCs current average AF price delivered is $30.15 per ton. Escalation for LOM was based on an annual price increase of 0.5 percent. |
| | Diesel Fuel. The offroad fuel cost per gallon, $1.25 per ton of cement, is based on the current average cost. The escalation price is based on EIAs Annual Energy Outlook 2023. |
| | Electricity. The 2025 electricity cost is $6.62 per ton of cement, based on current average rates. Escalation for LOM was based on EIAs Stort Term Energy Outlook through 2025 and the Long-Term Outlook for 2026 2050. |
| 19.1.3 | INFLATION |
The projections for Consumer Price Index percentages through 2054 were obtained from S&P Capital IQs USA Economic & Demographic Data. These projections were applied to escalate costs that were not directly covered by other basis of estimate methods within the economic model.
| 19.1.4 | LABOR |
Labor cost data were sourced from S&P Capital IQs USA Economic & Demographic Data. These data were used to derive and apply labor cost assumptions within the economic model.
| 19.1.5 | PRODUCTION PARAMETERS |
The annual production from the quarry as delivered to the primary crusher is 2.0 million tons per annum (t/a) which is comprised of:
| Limestone |
1.425 million t/a | |
| Dolostone |
0.150 million t/a | |
| Shale |
0.350 million t/a | |
| Sandstone |
0.050 million t/a | |
| Other (karst limestone) |
0.025 million t/a |
Shale and sandstone are abundant at the site for use in the process. The production schedule only details the limestone and dolomite extraction between the active quarries.
This results in an LOM of 27 years from 2025 through 2051.
Cement annual production rate is 1.46 million tons. The difference between the mined production and cement plant output is a result of the loss in the cement kiln derived from the loss of moisture and chemical transformation.
72
| 19.1.6 | CAPITAL EXPENDITURES |
The total Capex for the combined cement plant and quarry is:
| Existing Capex |
$85 million | |
| Total Capital 2025 through 2051 |
$599 million |
| 19.1.7 | TAXES |
The corporate income tax is 25.5 percent.
| 19.2 | RESULTS OF ECONOMIC ANALYSIS |
| 19.2.1 | ECONOMIC ANALYSIS |
The summary of the financial model for the combined cement and quarry operations is detailed below. Due to the uncertainty of the timing of specific Capex, except for the mining capital (as defined in Section 18), the analysis is presented with depreciation and amortization. There is no interest line item as the model is always cash positive and hence has no interest payments.
Table 19-1 illustrates the analysis assuming the product production rates over LOM as defined in section 19.1.5.
73
Table 19-1. Economic Analysis Model
| 2025F | 2026F | 2027F | 2028F | 2029F | 2030F | 2031F | 2032F | 2033F | 2034F | |||||||||||||||||||||||||||||||
| Net Revenue |
$ | 196 | $ | 197 | $ | 200 | $ | 205 | $ | 210 | $ | 215 | $ | 220 | $ | 225 | $ | 230 | $ | 235 | ||||||||||||||||||||
| Operating Expense |
$ | 120 | $ | 121 | $ | 124 | $ | 125 | $ | 128 | $ | 132 | $ | 135 | $ | 139 | $ | 144 | $ | 148 | ||||||||||||||||||||
| Operating Income |
$ | 76 | $ | 76 | $ | 77 | $ | 80 | $ | 82 | $ | 82 | $ | 85 | $ | 86 | $ | 86 | $ | 87 | ||||||||||||||||||||
| Adjustments to Cash Flow* |
$ | 27 | $ | 35 | $ | 36 | $ | 31 | $ | 29 | $ | 57 | $ | 27 | $ | 27 | $ | 28 | $ | 25 | ||||||||||||||||||||
| Cash Flow |
$ | 49 | $ | 42 | $ | 40 | $ | 48 | $ | 52 | $ | 25 | $ | 57 | $ | 59 | $ | 59 | $ | 62 | ||||||||||||||||||||
| 2035F | 2036F | 2037F | 2038F | 2039F | 2040F | 2041F | 2042F | 2043F | 2044F | |||||||||||||||||||||||||||||||
| Net Revenue |
$ | 242 | $ | 248 | $ | 255 | $ | 262 | $ | 269 | $ | 276 | $ | 284 | $ | 291 | $ | 299 | $ | 307 | ||||||||||||||||||||
| Operating Expense |
$ | 153 | $ | 157 | $ | 161 | $ | 165 | $ | 169 | $ | 173 | $ | 176 | $ | 179 | $ | 183 | $ | 187 | ||||||||||||||||||||
| Operating Income |
$ | 89 | $ | 91 | $ | 94 | $ | 97 | $ | 100 | $ | 103 | $ | 108 | $ | 112 | $ | 117 | $ | 121 | ||||||||||||||||||||
| Adjustments to Cash Flow* |
$ | 25 | $ | 23 | $ | 16 | $ | 19 | $ | 21 | $ | 26 | $ | 29 | $ | 26 | $ | 26 | $ | 28 | ||||||||||||||||||||
| Cash Flow |
$ | 64 | $ | 69 | $ | 78 | $ | 77 | $ | 79 | $ | 78 | $ | 78 | $ | 86 | $ | 91 | $ | 93 | ||||||||||||||||||||
| 2045F | 2046F | 2047F | 2048F | 2049F | 2050F | 2051F | Total | |||||||||||||||||||||||||||||||||
| Net Revenue |
$ | 316 | $ | 324 | $ | 333 | $ | 342 | $ | 352 | $ | 361 | $ | 371 | $ | 7,266 | ||||||||||||||||||||||||
| Operating Expense |
$ | 190 | $ | 194 | $ | 198 | $ | 203 | $ | 206 | $ | 211 | $ | 214 | $ | 4,433 | ||||||||||||||||||||||||
| Operating Income |
$ | 126 | $ | 130 | $ | 135 | $ | 140 | $ | 145 | $ | 150 | $ | 157 | $ | 2,832 | ||||||||||||||||||||||||
| Adjustments to Cash Flow* |
$ | 46 | $ | 31 | $ | 31 | $ | 37 | $ | 31 | $ | 44 | $ | 43 | $ | 825 | ||||||||||||||||||||||||
| Cash Flow |
$ | 80 | $ | 100 | $ | 104 | $ | 103 | $ | 114 | $ | 107 | $ | 114 | $ | 2,008 | ||||||||||||||||||||||||
Note:
All Figures in USD Millions unless otherwise noted
Total annual quarry production is constant at 2.1 Million tons
*Adjustments to Cash Flow includes change in Working Capital, Capital Expense, Income Tax, less Depreciation, Depletion & Amortization (DD&A)
| 19.2.2 | MEASURES OF ECONOMIC VIABILITY |
Based on the analysis the cement plant operation had positive annual income and earnings before interest, taxes, depreciation and amortization over the evaluation period, confirming the end users of the product from the mining operation is a viable, profitable business and will be able to use the mined product.
Net Present Value (NPV) is also used to evaluate the economic viability of the ongoing mining and processing of material to manufacture cement. Based on the LOM evaluation period (27 years) and the assumed discount rate of 9.6 percent, the NPV of the operation (cement plant and quarry combined), after tax, is $676 million.
| 19.3 | SENSITIVITY ANALYSIS |
Sensitivity analysis is presented below for changes for:
| | Operating Costs |
| | Capital Expenditures |
| | Sales Price (Cement / Aggregates) |
| | Mining Costs |
| | Processing Costs |
74
Table 19-2 illustrates the results of the sensitivity analysis.
Table 19-2.19-3. Sensitivity Analysis
| Sensitivity Parameter |
Variance to Expected Case (%) |
After-Tax NPV (US $ ,000) |
||||||
| Operating Costs |
+10% | $ | 544,044 | |||||
| -10% | $ | 710,871 | ||||||
| Price ($/t) |
+$5.00 | $ | 682,611 | |||||
| -$5.00 | $ | 572,304 | ||||||
| Mining Costs ($/t) |
+$1.00 | $ | 613,710 | |||||
| -$1.00 | $ | 641,205 | ||||||
| Capital Expenditure |
+20% | $ | 669,942 | |||||
| -20% | $ | 584,974 | ||||||
| 19.4 | CONCLUSION |
The analysis of the cement plant operation, demonstrated a positive annual net income and positive EBITDA over the evaluation period, confirming that the end user of the product from the mining operation is a viable, profitable businesses and will be able to use the mined product.
Sensitivity to increases in the mining cost indicates that these increases do not materially impact the profitability of the combined cement and aggregate financial performance.
The effect of a $1 increase in the mining cost was evaluated for the sensitivity of increases in the mining cost. With $1 increase in mining cost, the NPV (after tax) is reduced from $627 million to $614 million or 2.1 percent.
75
| 20. | ADJACENT PROPERTIES |
There are no adjacent properties from which relevant information material to the Resource and Reserves estimates was available or considered.
76
| 21. | OTHER RELEVANT DATA AND INFORMATION |
| 21.1 | CATAWBA ROAD RELOCATION |
This Catawba Road crosses the site and will be relocated in the future for extension of the Catawba Farm Quarry. The road ROW is currently owned by the Commonwealth of Virginia. To relocate the road, both county and the state need to accept the relocation. The current proposal is that a new road will be constructed on Titan owned land and deeded to the Commonwealth. With the acceptance of the new road and the existing ROW will be abandoned with Titan having the right to purchase. As a precedent a relocation of a section of this road was completed at the site in the 1970s.
| 21.2 | AGGREGATES PRODUCTION |
A resource in excess of 340 million tons of dolomitic limestone was confirmed in the northern region of the site, first delineated in 2007. Because of the chemistry of this material (higher magnesium values), it is not suitable for cement production. Some dolomitic limestones can be introduced in the finish mills process, but the Reserves have sufficient amounts of this material available for the foreseeable future. This dolomitic limestone is ideal for producing construction aggregates, and this specific geological formation, the Beekmantown dolostone, is mined in other parts of Virginia as an aggerates source.
| 21.3 | LONE STAR WEST RECOVERY |
The mining activity ceased in the Lone Star West Quarry in 1995, as the quarry walls had reached the limit based on the location of existing infrastructure. The updated geological model shows that several places along the legacy high walls did not fully extract the available limestone Resources. Redeveloping mine benches on these high walls in the future could yield additional limestone resources.
| 21.4 | UNDERGROUND EXPANSION |
The limestone mined on site extends under the current operation well beyond the current pit floor, and the strike of the deposit runs under various portions of the site that are not open for surface development. These resources could potentially be accessed via an underground development. A future engineering study will be required to assess viability.
77
| 22. | INTERPRETATION AND CONCLUSIONS |
| 22.1 | INTERPRETATIONS AND CONCLUSIONS |
In summary concerning the Resource and Reserve estimates for the Roanoke site:
| | Geology is well known and understood and proven to supply suitable stone both for cement raw material. |
| | Mining operations and practices have been well established over many decades. |
| | The processing of raw materials and manufacture of cement has been in place for many decades and upgraded to be a state-of-the-art, very low emissions facility. |
| | All necessary off-site infrastructure is in place and has served the operation for many decades. |
| | Additional infrastructure will be required to develop the Catawba Farm Quarry and planning and design for this is adequate. |
| | All necessary permits are in place and future permitting is expected to enable extraction of all Reserves included in the estimate. |
| | Costs are well understood and predictable, with the operations having been economic for many years and reasonably expected to be so for the LOM projected. |
The QP opines that no issues are unresolved with the technical or economic factors considered in determining RPEE that supports the Resource estimate and that the risk of material impacts on the Reserve estimate is low.
| 22.2 | RISKS AND UNCERTAINTIES |
Catawba Farm Quarry Joint Permit Application Delay
The extension of the mining operation to the new Catawba Farm Quarry location is predicated on the timely receipt of local, state, and federal permits. The geology is well understood, there are no land use issues with zoning or mineral rights, and the capital cost has been established. The permit with the most significant potential for delay is the Joint Permit Application (JPA) that covers the state DEQ, state VMRC, and the US Army Corps of Engineers permitting scope. These permits are critical to the quarry operations are related Resources and Reserves. The QP opines that the permits are obtainable. The risk is the potential of delay. This is mitigated in the mine schedule with no activity taking place at the Catawba Farm Quarry until 2026.
Catawba Farm Extension
Measured Resources in this pit extension will require extensive permitting activities including the VDEQ, VMRC, USACE, VDOT and Botetourt County as well as a road relocation in order to be considered Reserves. The QP opines that this process, while achievable will be costly and time consuming.
78
| 23. | RECOMMENDATIONS |
It is recommended that the site:
| | Dedicate Resources and effort to securing the Catawba Farm permits and advancing the necessary infrastructure for mining. Permit applications are submitted. Capital costs are included in Section 18. |
| | Advance the approval process for the Catawba Farm Extension Permitting and infrastructures costs are estimated at $20 million. Road Relocation is estimated at $26 million. |
| | Continue evaluation of development of the Lone Star East Extension. A prefeasibility study is planned to support internal approval of the Extension. The current estimated cost of the prefeasibility study is less than $50,000. |
79
| 24. | REFERENCES |
Diener, F. (1949). 1949 Drilling Report.
Donald H. Campbell, P. (1999). Microscopical Examination and Interpretation of Portland Cement and Clinker, SP030. Skokie, IL: Portland Cement Association.
Hellstrom, S. (1986). Roanoke- Quarry Evaluation As Related to the Atlas Property Acquisition.
iNaturalist. (2024, June 7). iNaturalist. Retrieved from inaturalist.org: https://www.inaturalist.org/places/botetourt-county
Kulander, B., & Dean, S. (1986). Structure and tectonics of central and southern Appalachian Valley and Ridge and Plateau Provinces, West Virginia and Virginia. American Association of Petroleum Geologists Bulletin, (pp. v.70 pp. 1674-1684).
NPS. (2020, February). Convergent Plate BoundariesCollisional Mountain Ranges. Retrieved from National Park Service: https://www.nps.gov/subjects/geology/plate-tectonics-collisional-mountain-ranges.htm
PCA, 2. (2024). PCA 2024 Spring Forecast. Retrieved from Current Forecasts: https://www.cement.org/economics/forecasts
Prince, P., & Henika, W. (2018). Geology of the Catawba Quadrangle, Virginia. Charlottesville: Department of Mines, Minerals, and Energy, Commonwealth of Virginia.
Roberts, D. (2018, November 16). Charlotte regains its place as No. 2 U.S. banking center. Will it keep it?
Retrieved from The Charlotte Observer: https://www.charlotteobserver.com/news/business/banking/article221589840.html
U.S. Bureau of Labor Statistics. (2024, August). Producer Price Index by Industry: Cement and Concrete Product Manufacturing [PCU32733273], retrieved from FRED, Federal Reserve Bank of St. Louis. Retrieved from https://fred.stlouisfed.org/series/PCU32733273
US Climate Data. (2024, August). Climate RoanokeVirginia. Retrieved from US Climate Data: https://www.usclimatedata.com/climate/roanoke/virginia/united-states/usva0659
Virginia Department of Conservation and Recreation. (2021). Overview of the Physiography and Vegetation of Virginia. Division of Natural Heritage.
Watkins, J. (1949). Watkins Report.
Weatherspark. (2024, August). Climate and Average Weather Year Round in Roanoke Virginia, United States. Retrieved from Weatherspark: https://weatherspark.com/y/19622/Average-Weather-in-Roanoke-Virginia-United-States-Year-Round
World Economic Forum. (2022, July 28). Cement Industry. Retrieved from The Net-Zero Industry Tracker: https://www.weforum.org/publications/the-net-zero-industry-tracker/in-full/cement-industry/
80
| 25. | RELIANCE ON INFORMATION PROVIDED BY THE REGISTRANT |
In the development of this TRS, various information and data were provided by Titan. The information and data that were presented to the QP were used to substantiate the content and findings of this TRS. The QP opines based on evaluation of other similar operations that the information is valid and represents similar expected information for the mining of limestone and the production of cement. The information that was provided by the registrant for the development of this TRS are listed below.
| | Macroeconomic trends and data Sections 18 & 19 |
| | Marketing Section 16 |
| | Environmental Section 17 |
| | Accommodations to local groups Section 17 |
| | Governmental factors regarding Catawba Road relocation Sections 3 & 22 |
81
| 26. | DATE AND SIGNATURE PAGE |
This report titled, Technical Report Summary for Roanoke Quarry, Botetourt County, Virginia with an effective date of May 1, 2024, was prepared and signed by:
Signed by Continental Placer Inc.
Continental Placer Inc.
Dated at Lutz, FL
August 30, 2024
82